US English


7 Revenue Data & Analytics Manager Resume Templates with Example
By Ria · Last Updated On October 16, 2026
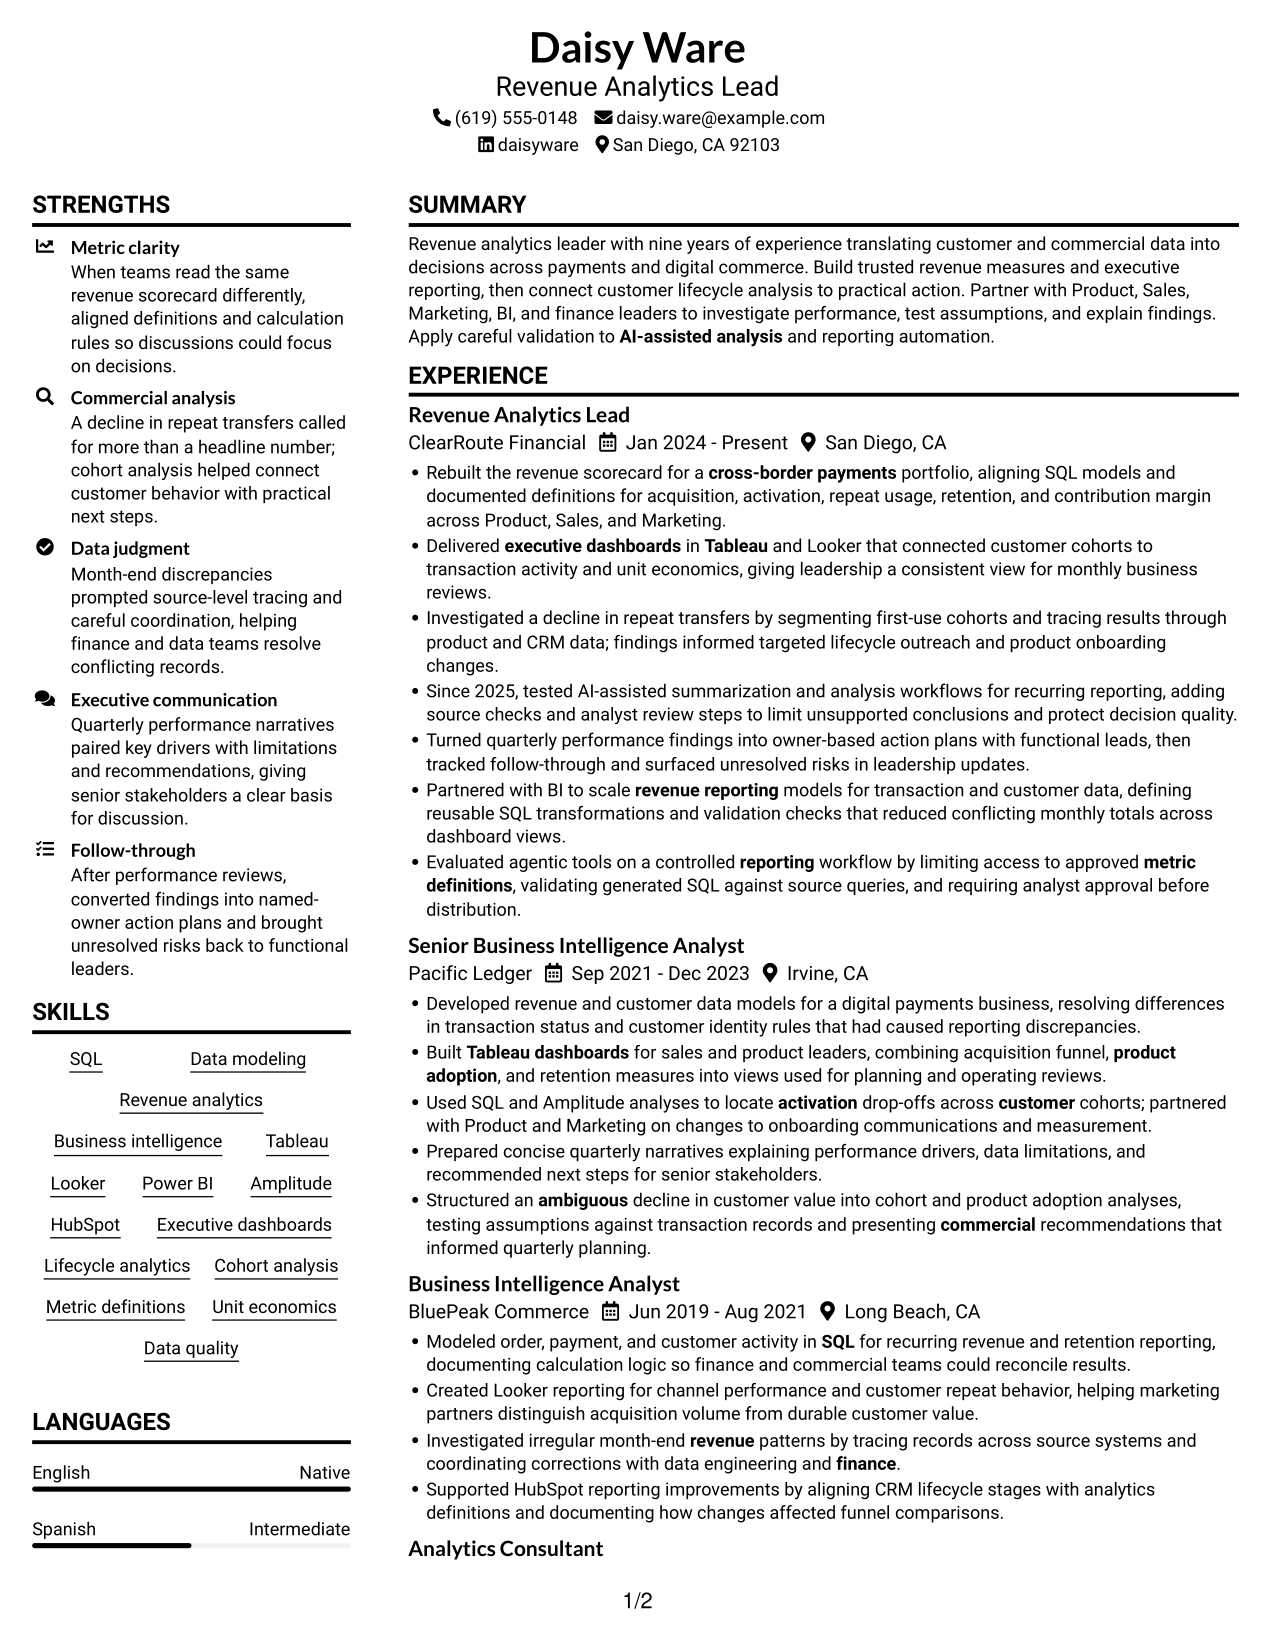
Resume example — page 1

This guide shows you how to build a Revenue Data & Analytics Manager resume that makes your measurement, analysis, and business impact easy to understand. You will learn how to organize your evidence so readers can quickly see how your work supports revenue decisions.

Strong resumes for this role connect customer lifecycle analysis with clear measures, reliable data, and useful recommendations. Show how you define metrics, build data models and dashboards, investigate performance changes, and communicate findings to business partners.

The resume example is presented in 7 layouts, so you can compare the image previews and choose a clear structure for your experience. The guide also covers ATS-friendly sections, role-relevant keywords, and ways to describe measurable results.

What Makes a Great Revenue Data & Analytics Manager Resume in 2026

A strong resume makes revenue measurement, customer analysis, and business impact easy to scan. Clear experience bullets show how your work led to better reporting or informed a decision.

Include specific evidence for SQL, data modeling, executive dashboards, and lifecycle or cohort analysis when supported by your experience. Use role-relevant terms such as retention, unit economics, metric definitions, and data quality.

Note: Resume examples are for educational purposes only. Use only information that accurately reflects your experience and qualifications. References to real organizations do not imply affiliation or endorsement.

#1 Plain Two Column Format Resume Example

The two-column structure separates career details from supporting sections, making this a practical choice when readers need to locate several kinds of information.
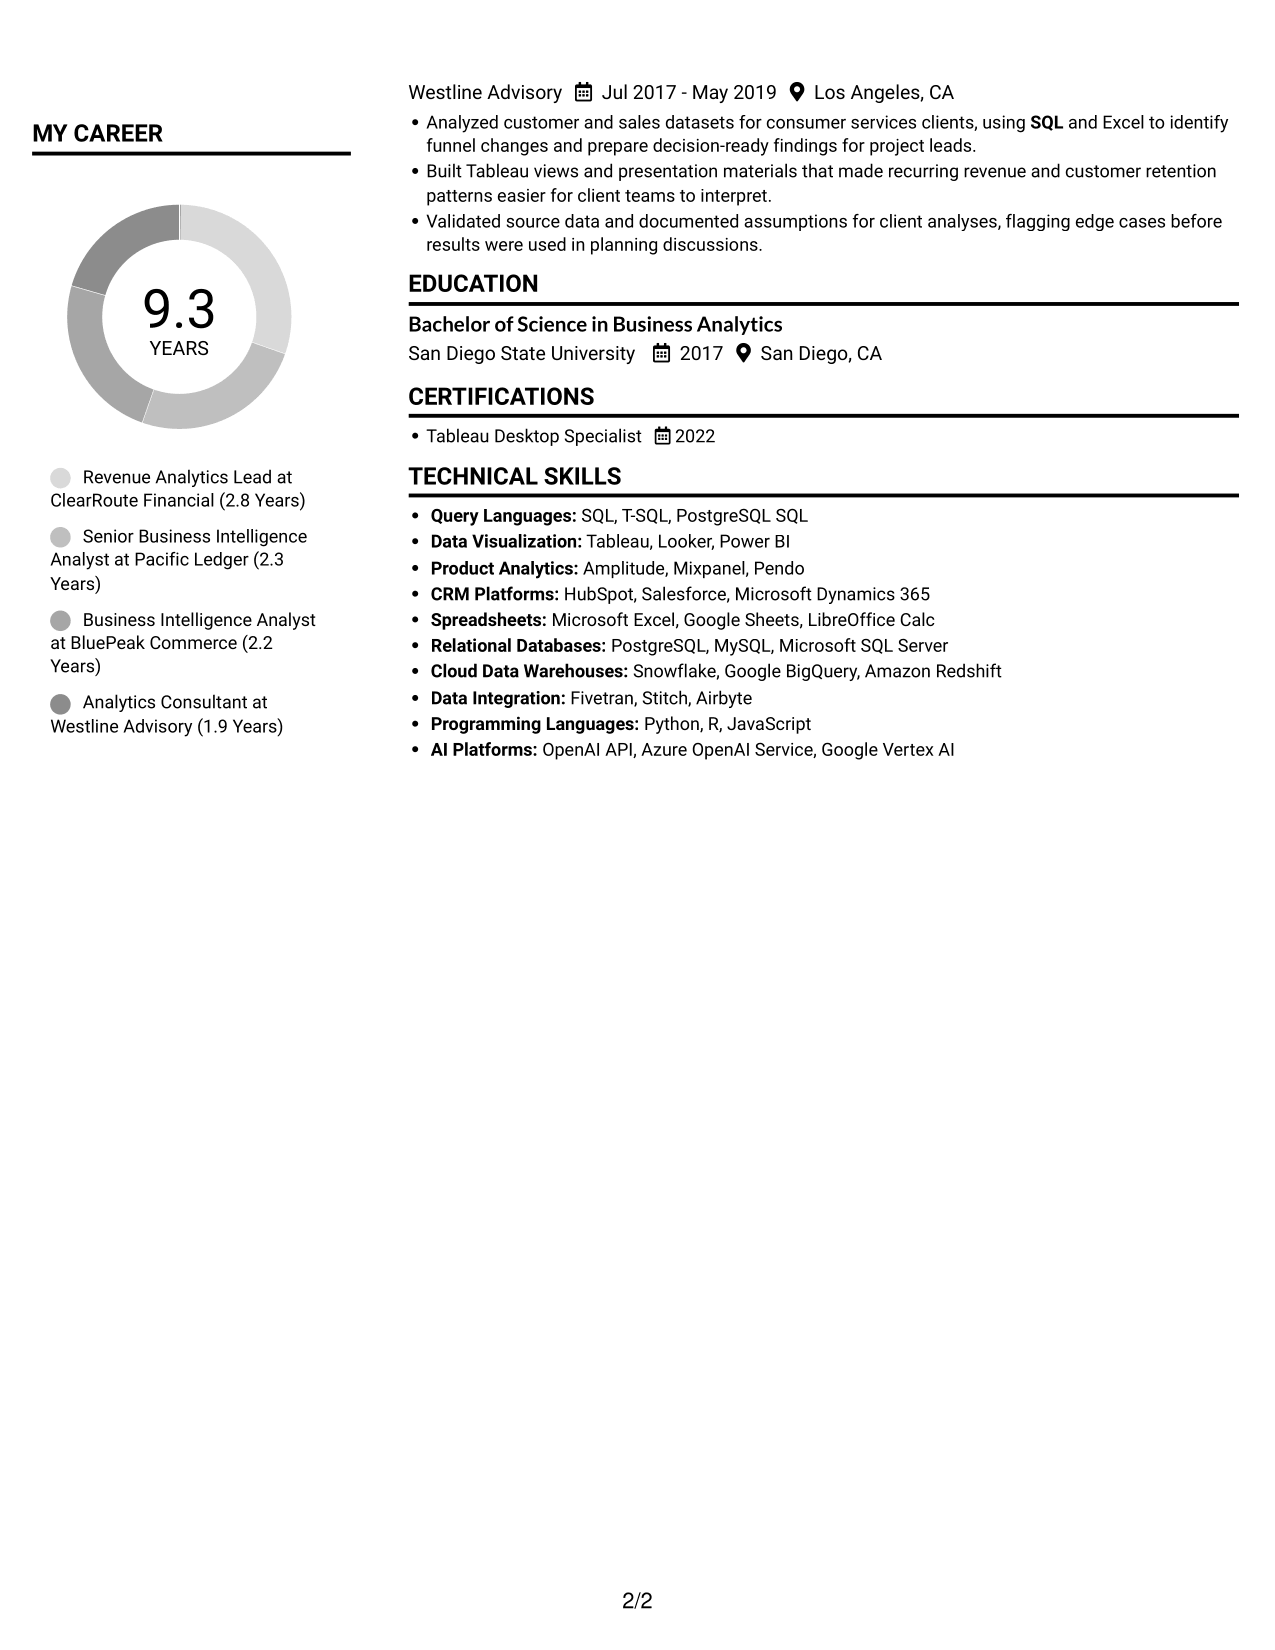
 
Resume example — page 1   Resume example — page 2

Resume Snapshot

  • Nine years of revenue analytics experience
  • SQL, data modeling, Tableau, and Looker
  • Bachelor of Science in Business Analytics
  • Tableau Desktop Specialist, 2022

Why This Format Works

  • Two-column reading lets reviewers compare experience with supporting skills and education.
  • Separate content areas help recruiters locate career history within a varied resume.
  • Education and credentials remain easy to find beside detailed work history.

Best For

  • Resumes with detailed work histories
  • Parallel organization of supporting sections
  • Recruiter scans across varied content
  • Education and credentials alongside experience
  • Applications needing clear section labels

Resume Keywords

  • SQL
  • Data modeling
  • Rebuilt the revenue scorecard for a cross-border payments portfolio, aligning SQL models and documented definitions for acquisition, activation, repeat usage, retention, and contribution margin across Product, Sales, and Marketing.
  • Metric definitions
  • Executive dashboards
  • revenue reporting
  • Business intelligence
  • Investigated a decline in repeat transfers by segmenting first-use cohorts and tracing results through product and CRM data; findings informed targeted lifecycle outreach and product onboarding changes.
  • Built Tableau dashboards for sales and product leaders, combining acquisition funnel, product adoption, and retention measures into views used for planning and operating reviews.
  • Unit economics
  • Used SQL and Amplitude analyses to locate activation drop-offs across customer cohorts; partnered with Product and Marketing on changes to onboarding communications and measurement.
  • Tableau
  • cross-border payments
  • cohort analysis
  • Investigated irregular month-end revenue patterns by tracing records across source systems and coordinating corrections with data engineering and finance.
See all keywords
 

#2 Simple One Column Format Resume Example

A single-column layout keeps the resume's sections in one vertical reading path, a useful choice when straightforward top-to-bottom review matters.
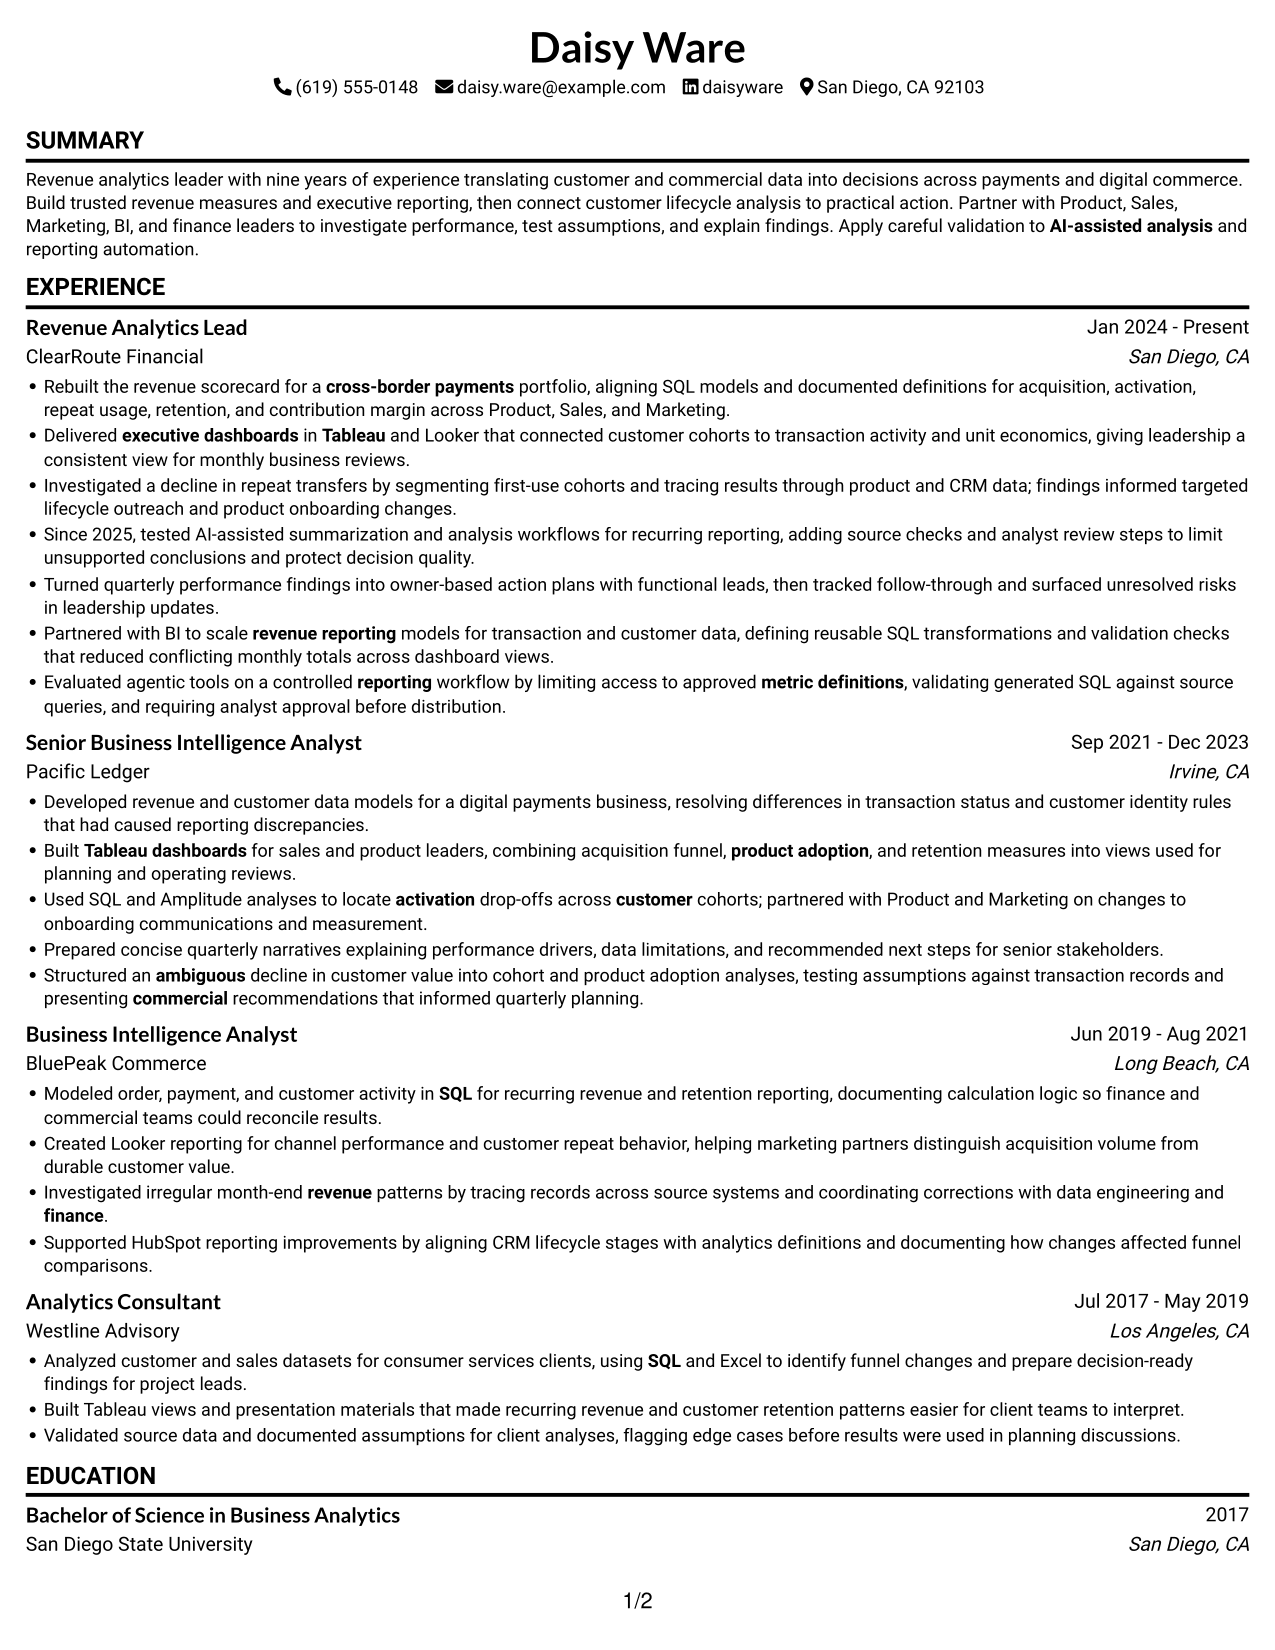
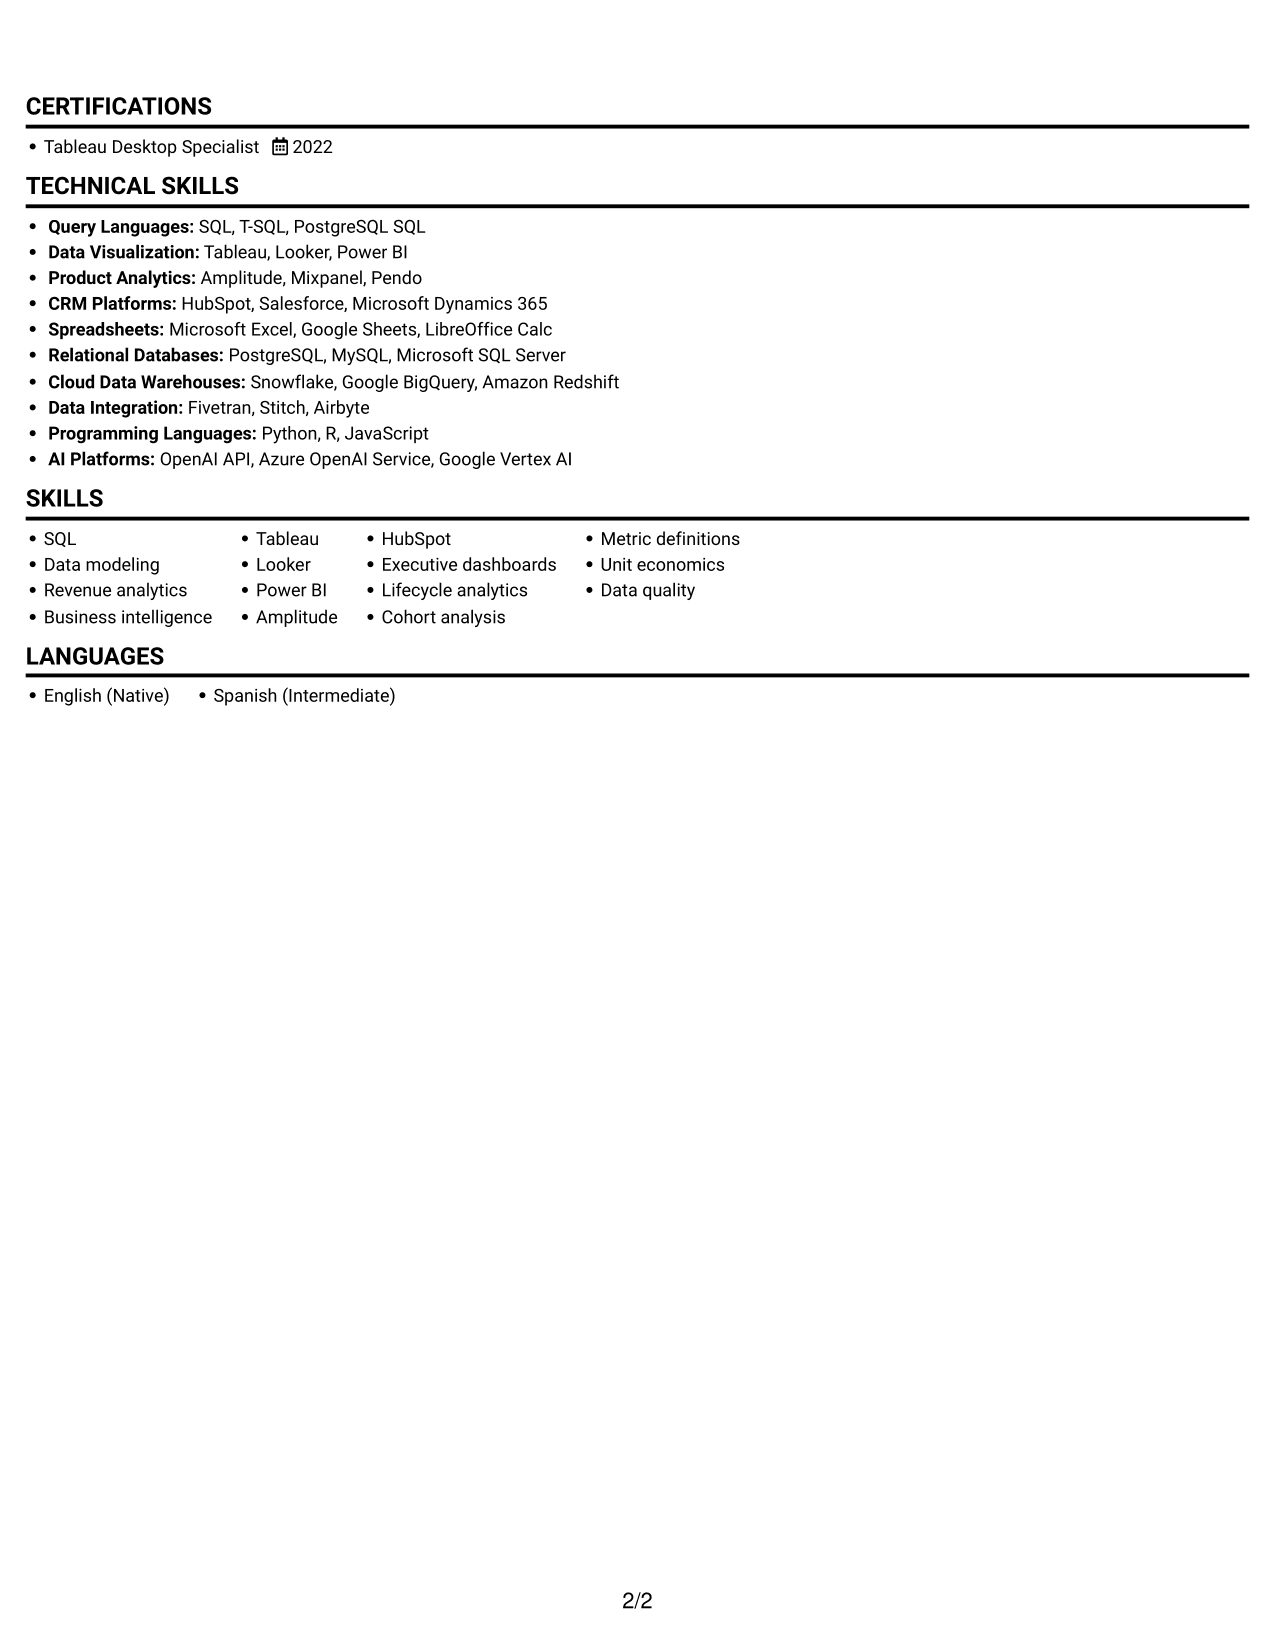
 
Resume example — page 1   Resume example — page 2

Why This Format Works

  • One vertical sequence keeps experience, education, and skills in a familiar review order.
  • Section headings help recruiters move from career history to credentials in sequence.
  • Role dates are easier to follow when the resume keeps a single reading path.

Best For

  • Top-to-bottom resume review
  • Chronological career records
  • Familiar section order
  • Text-first application materials
  • Detailed role entries
 

#3 Clean Two Column Sidebar Format Resume Example

A sidebar alongside the main column gives this two-column resume a clear way to distinguish supporting details from career history.
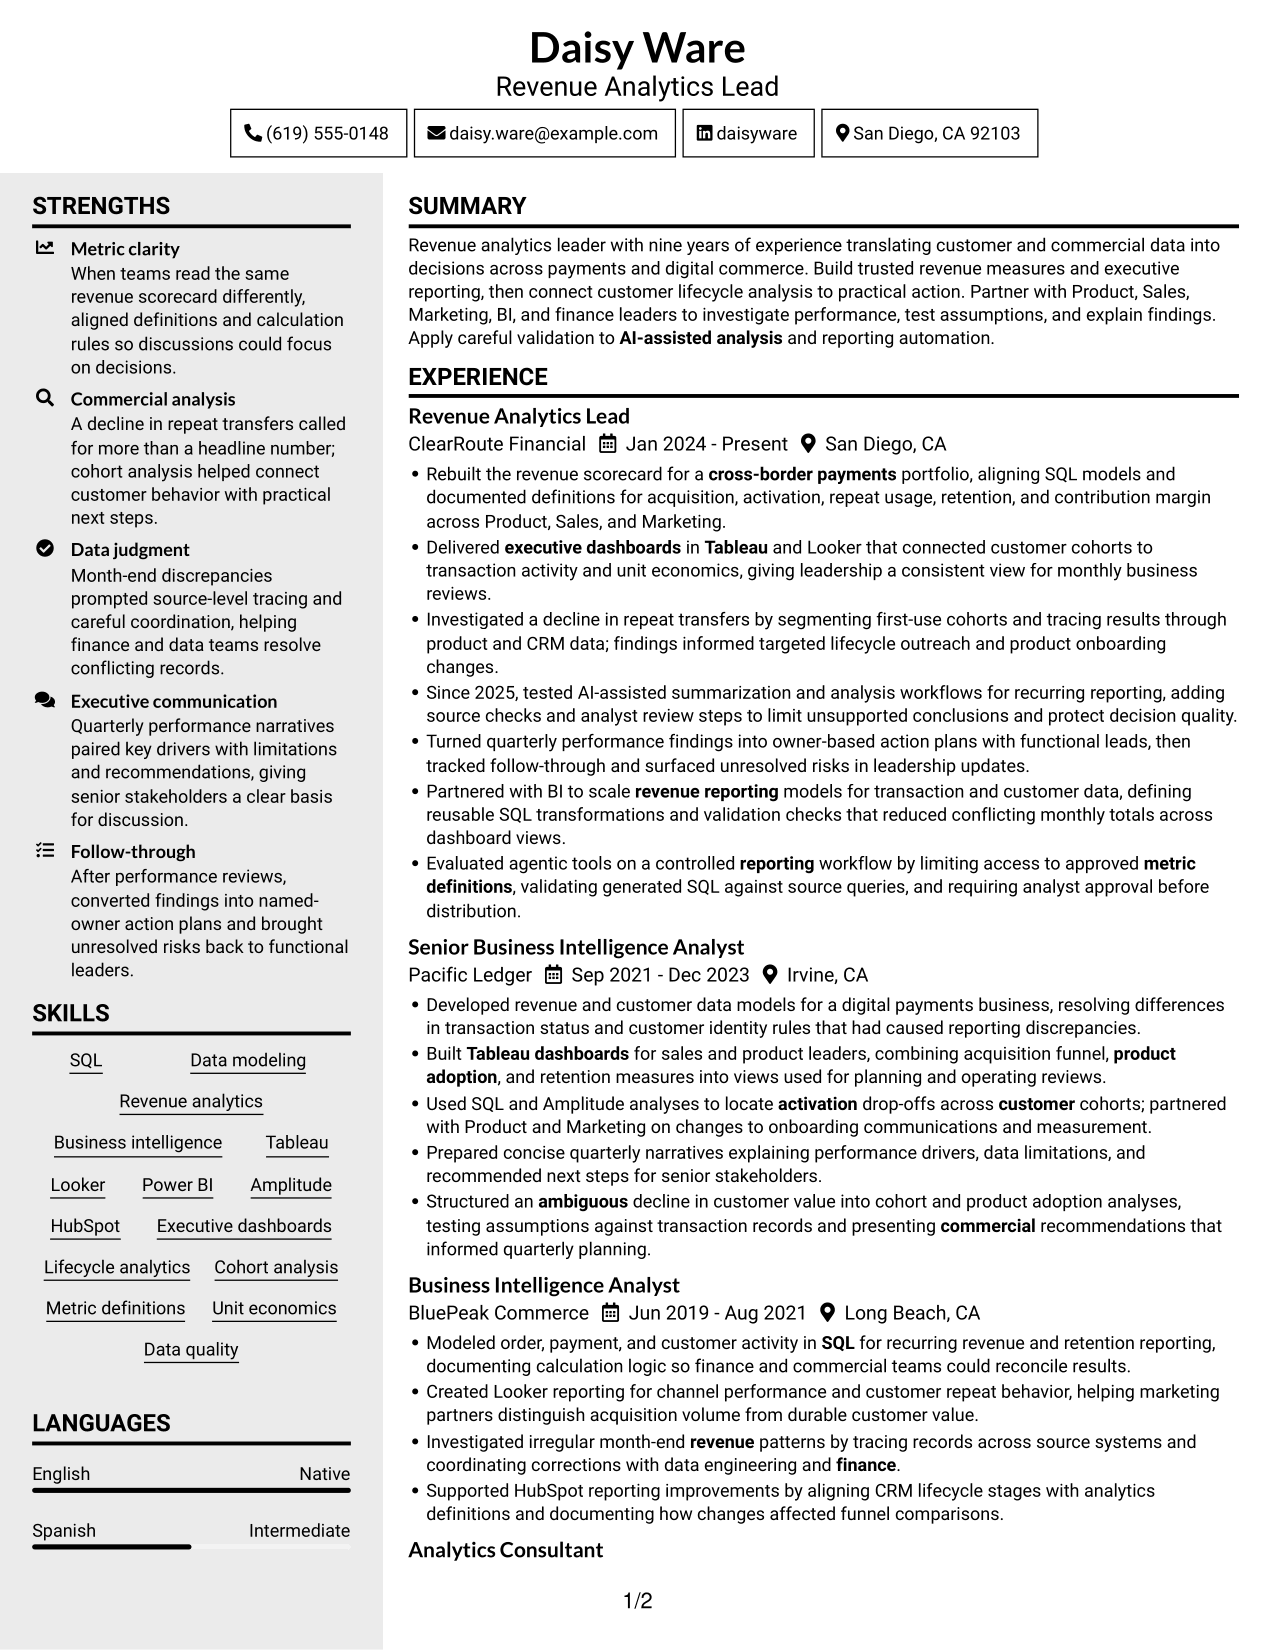
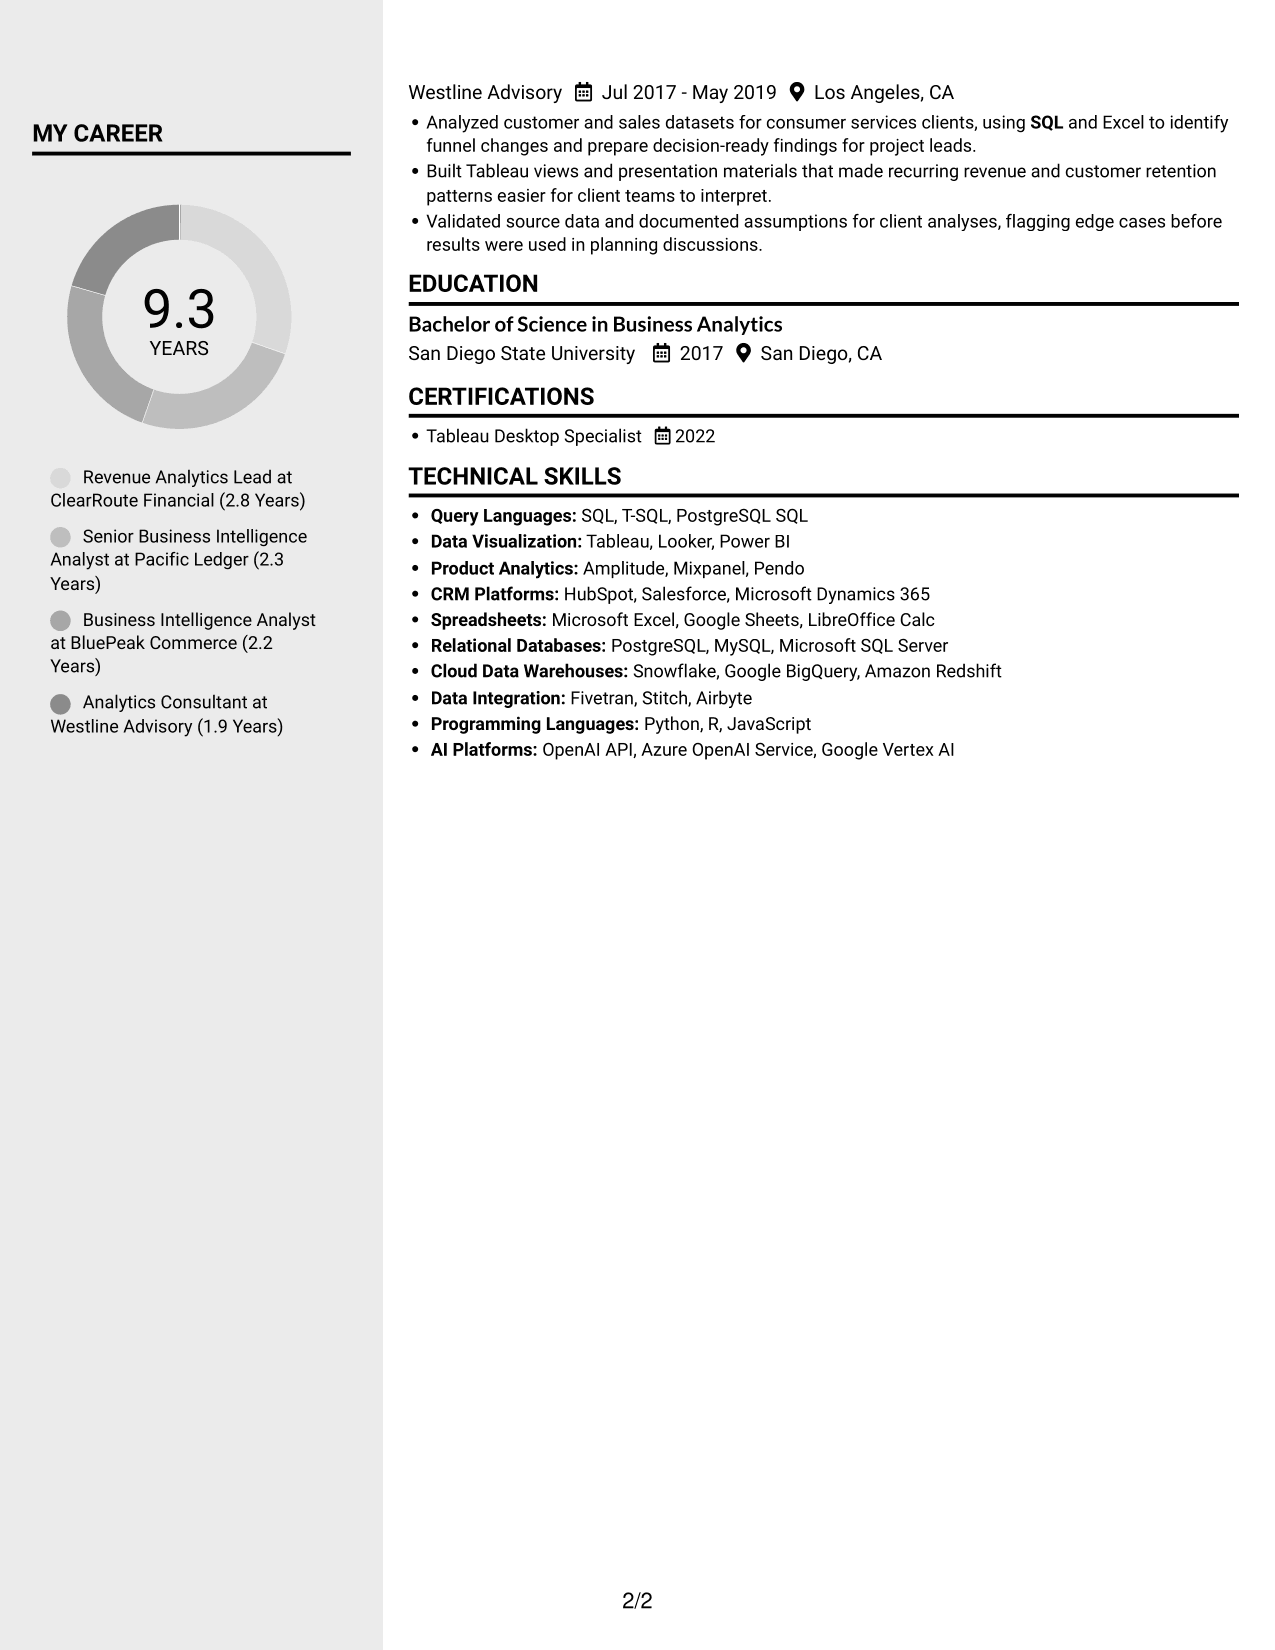
 
Resume example — page 1   Resume example — page 2

Why This Format Works

  • Role dates form a clearer timeline when experience stays in the main reading area.
  • Skills remain available as a distinct category beside detailed career entries.
  • Education and credentials are easier to locate apart from the work record.

Best For

  • Career history beside supporting details
  • Distinct section navigation
  • Review across multiple resume categories
  • Resumes with varied section types
  • Quick access to skills and credentials
 

#4 Two Column Format Resume Example

Two columns divide the resume into parallel reading areas, a useful choice when reviewers need to move between experience and supporting sections.
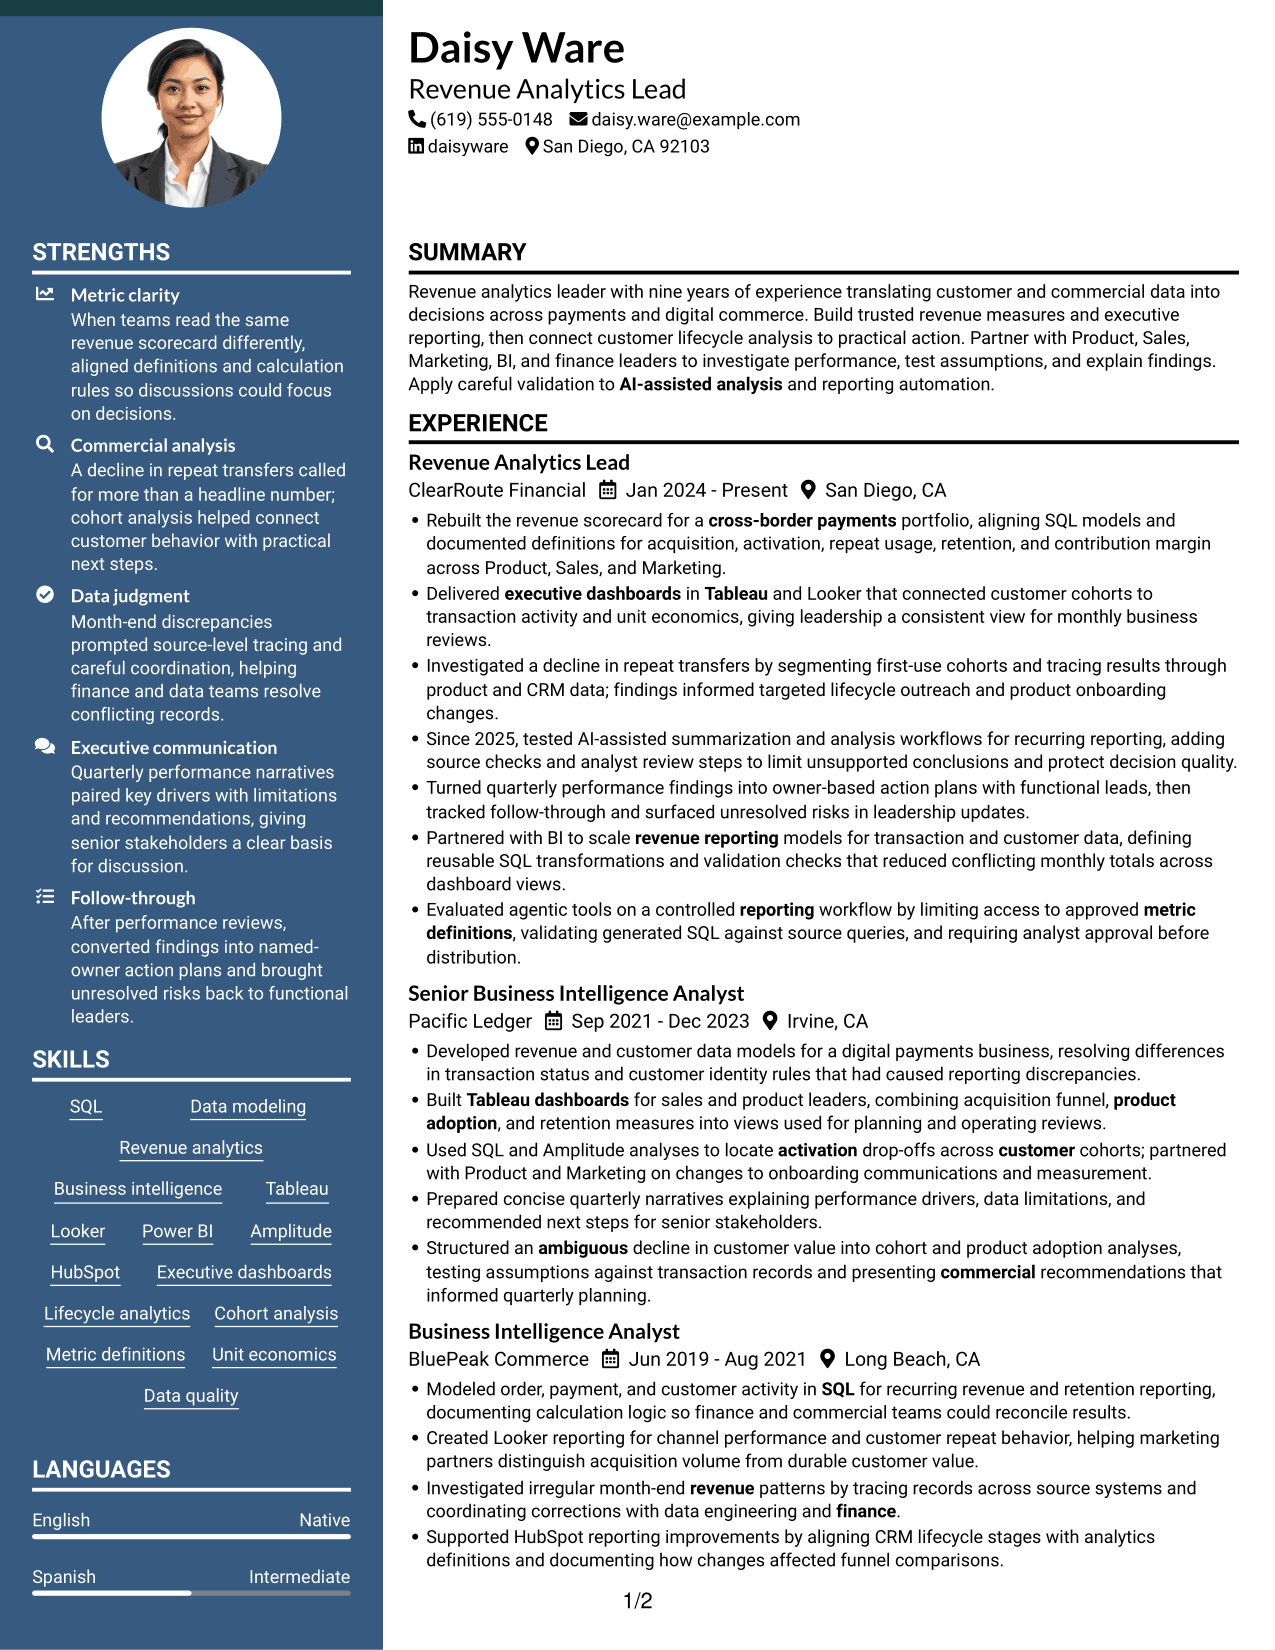
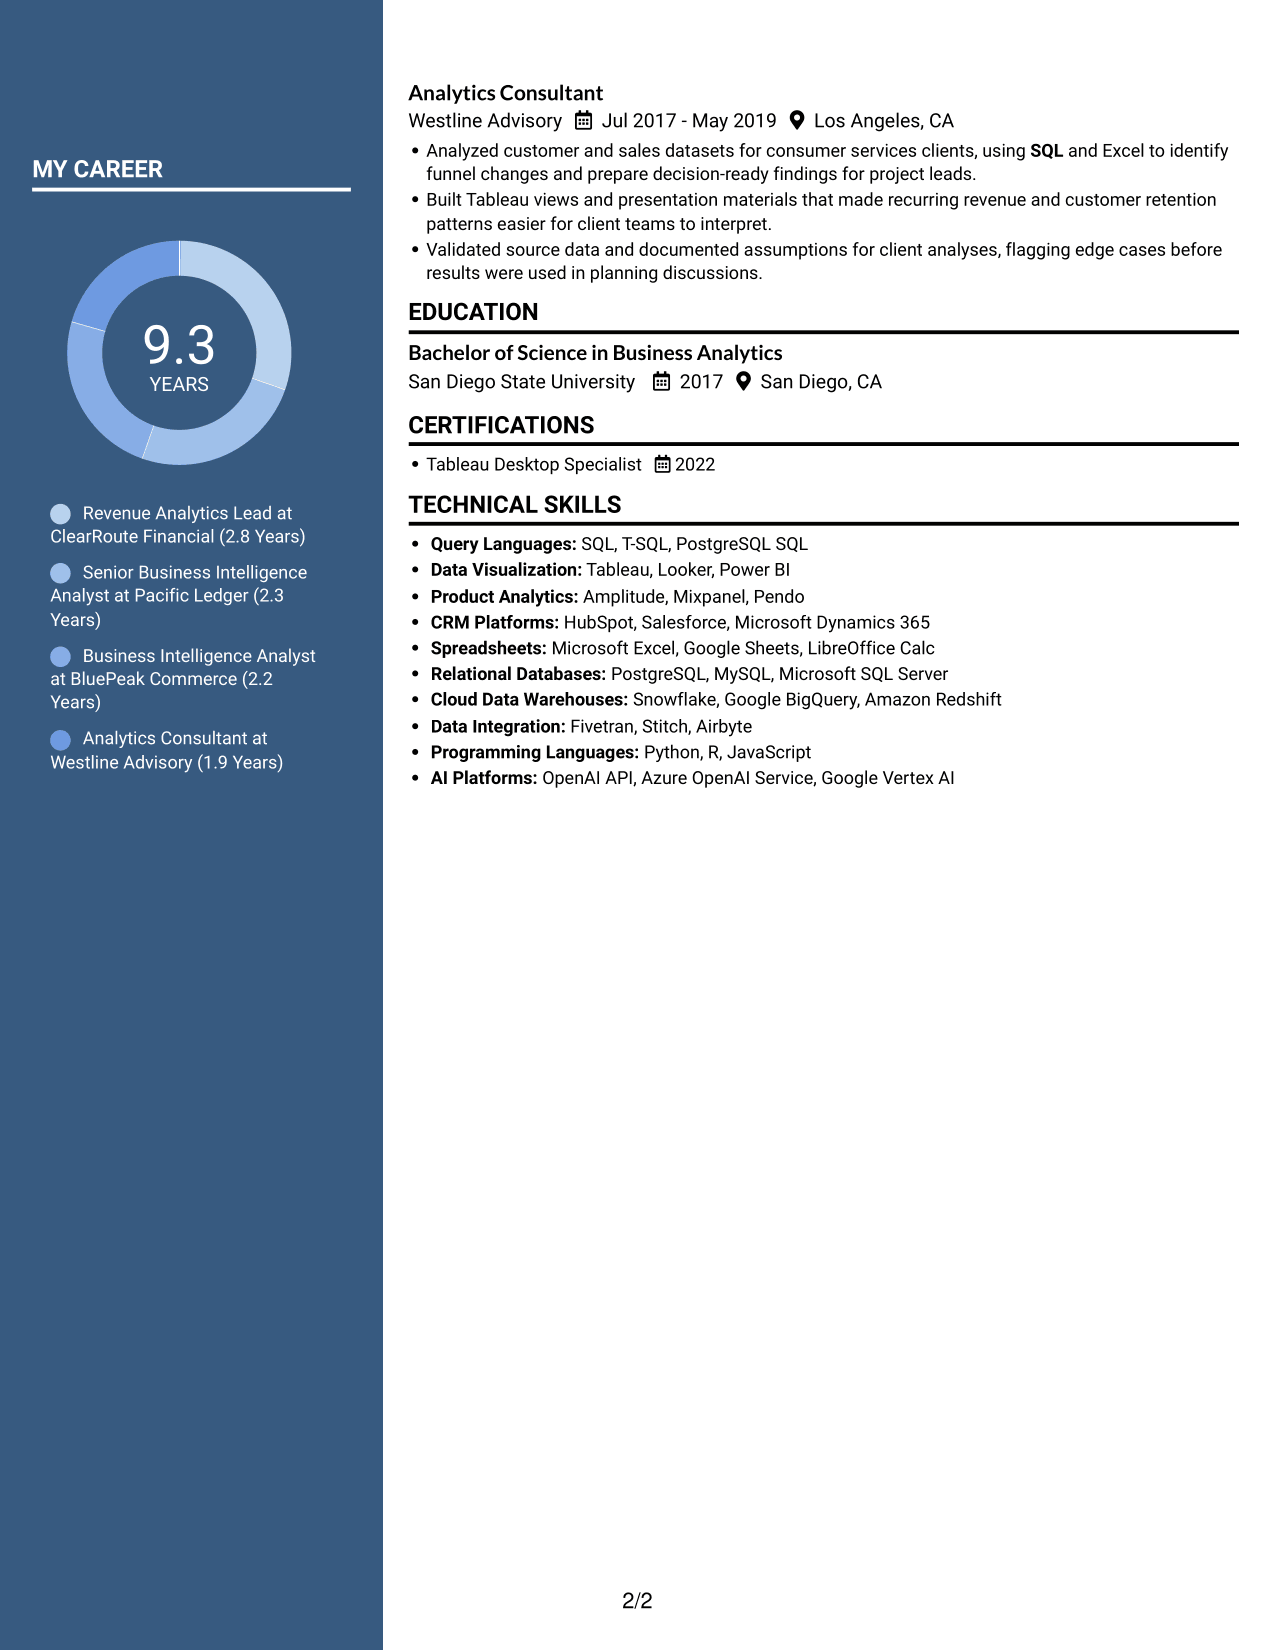
 
Resume example — page 1   Resume example — page 2

Why This Format Works

  • Skills can be scanned separately, then checked against the experience record.
  • Education and credentials stay easy to locate during a focused review.
  • Role dates support a clear view of career progression across the work history.

Best For

  • Career records with several content areas
  • Separate review of experience and skills
  • Quick access to education and credentials
  • Resumes combining summaries and role details
  • Readers who prefer parallel organization


#5 Photo Header Two Column Format Resume Example

A portrait appears with this two-column resume, offering a visual identifier while keeping the document's information divided for review.
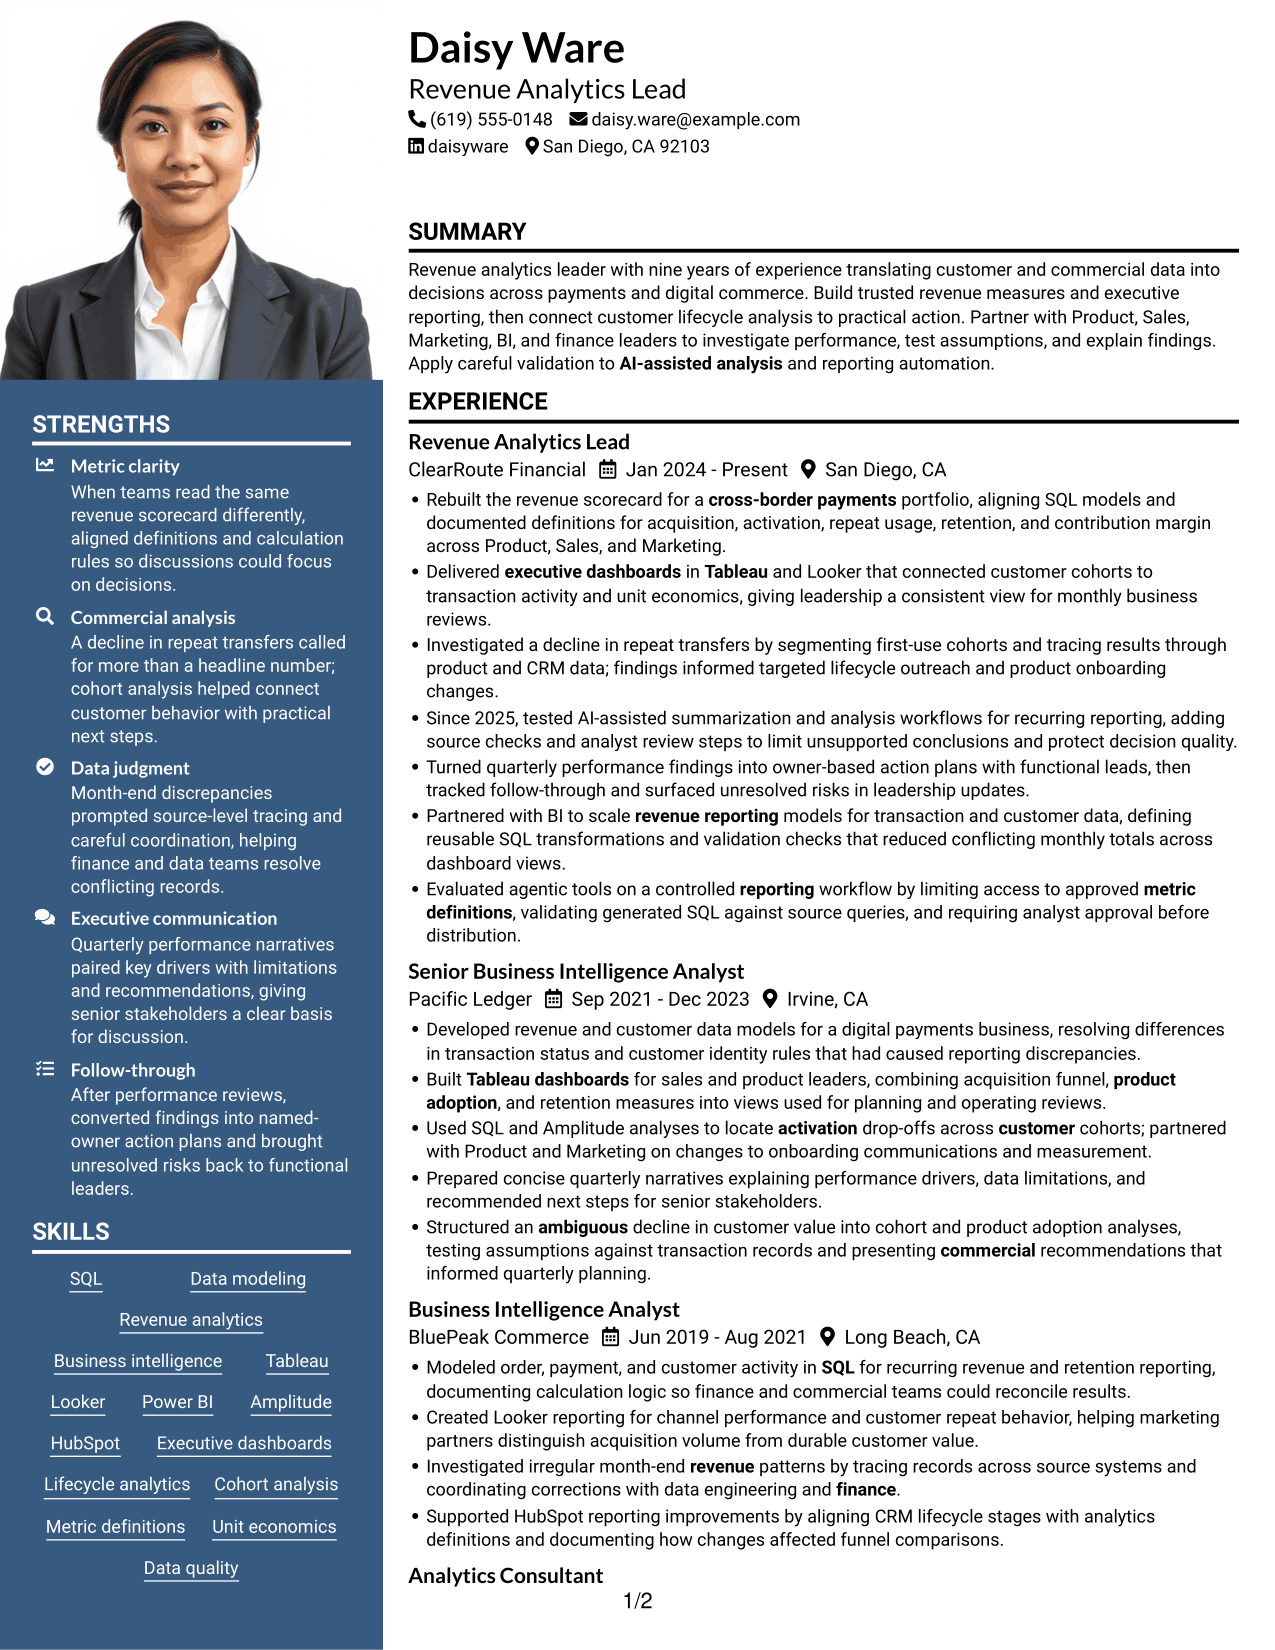
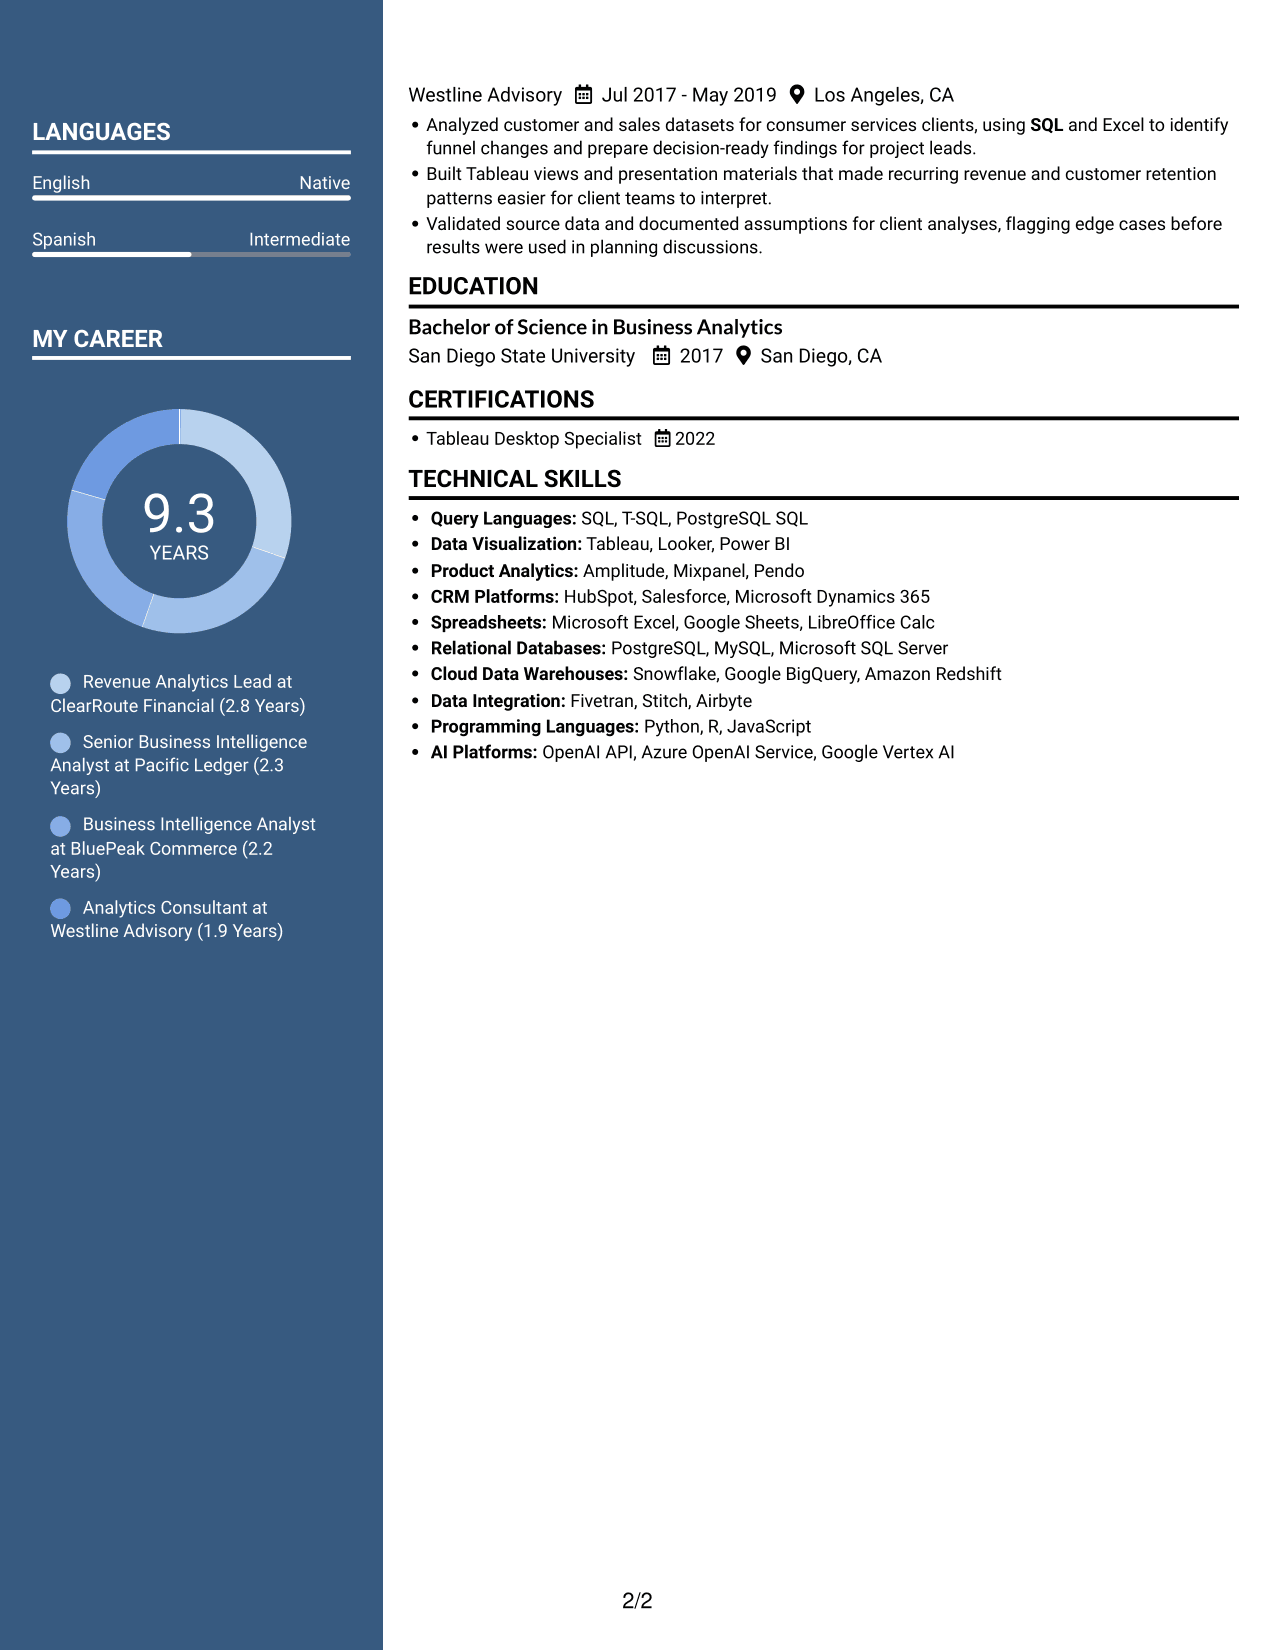
 
Resume example — page 1   Resume example — page 2

Why This Format Works

  • Career progression remains readable when work history and supporting sections use separate areas.
  • Skills and credentials can be found without searching through role descriptions.
  • Education details remain accessible alongside the experience record.

Best For

  • Applications where a portrait is requested
  • Two-column section organization
  • Experience with supporting details
  • Review across distinct content areas
  • Photo-inclusive professional documents
 

#6 Colored Two Column Format Resume Example

The two-column arrangement divides resume information into parallel areas, helping reviewers move between work history and supporting details.
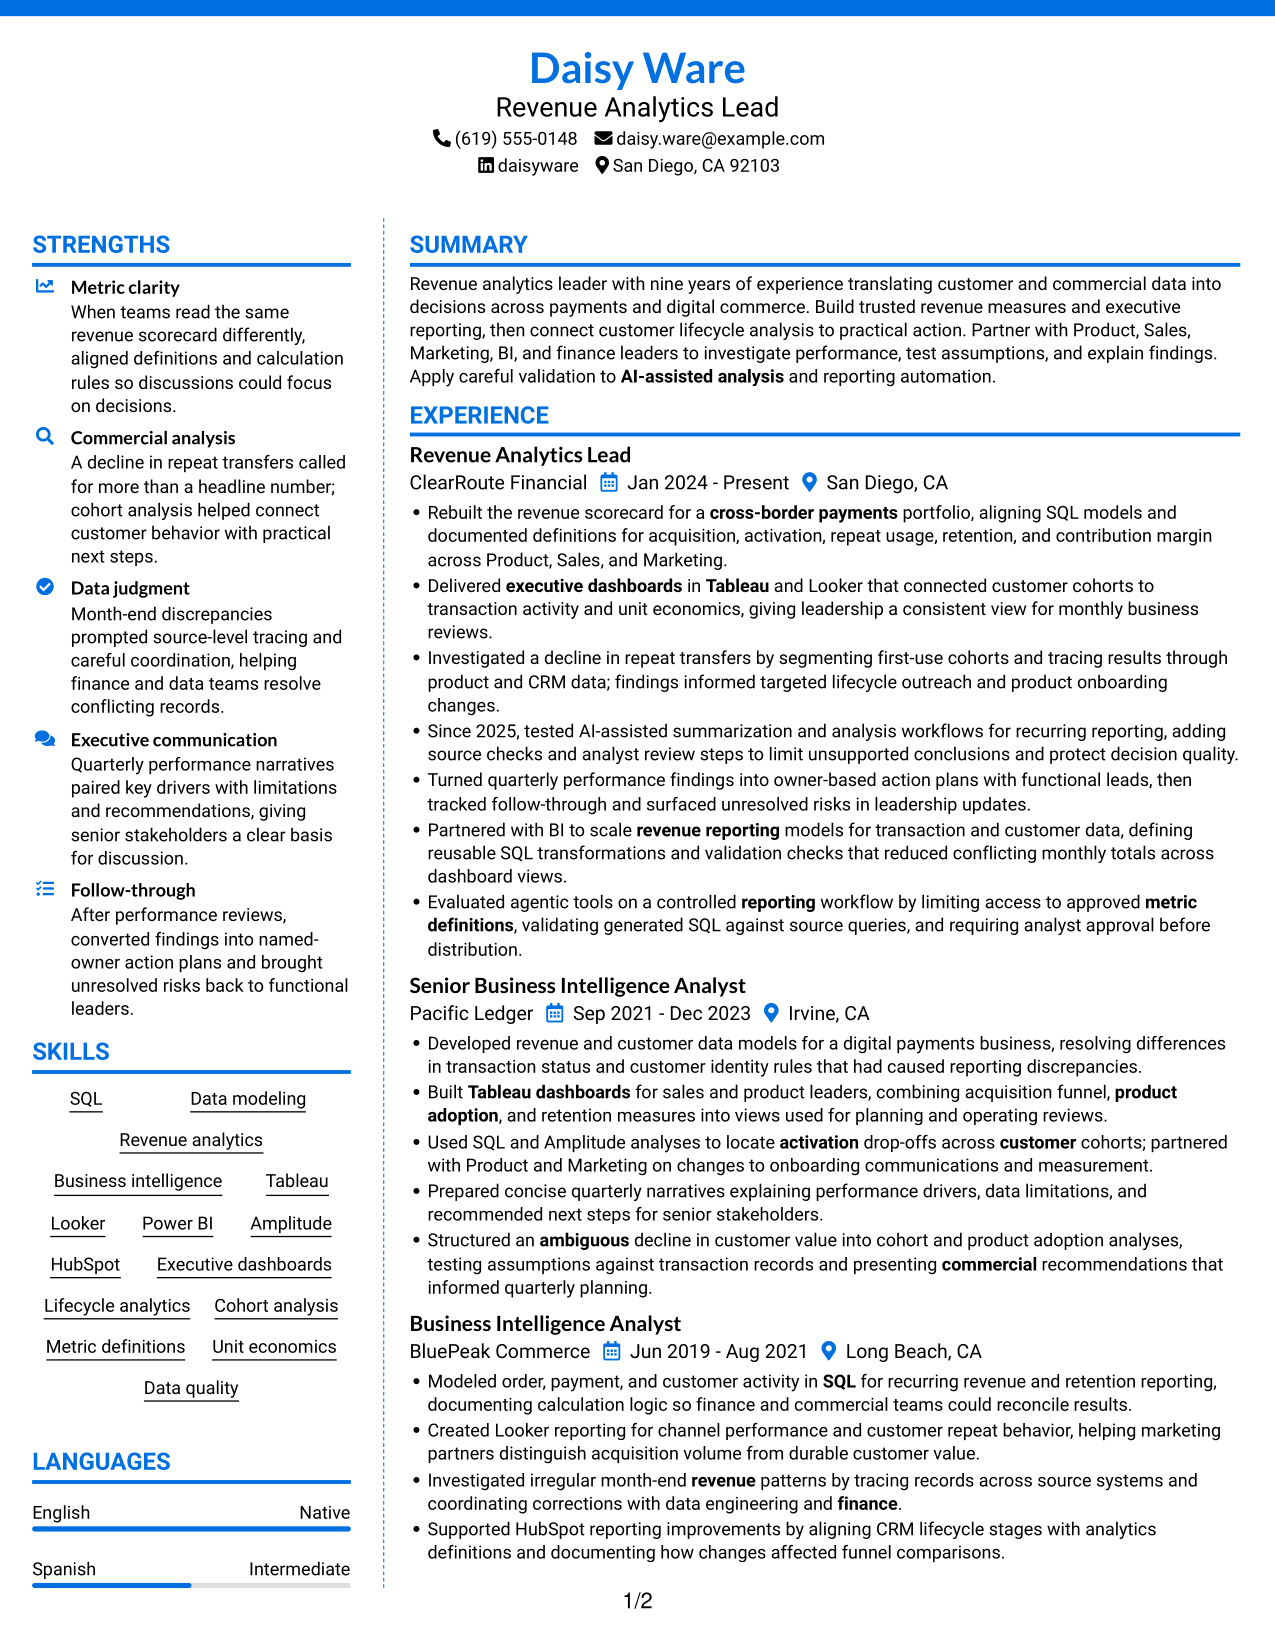
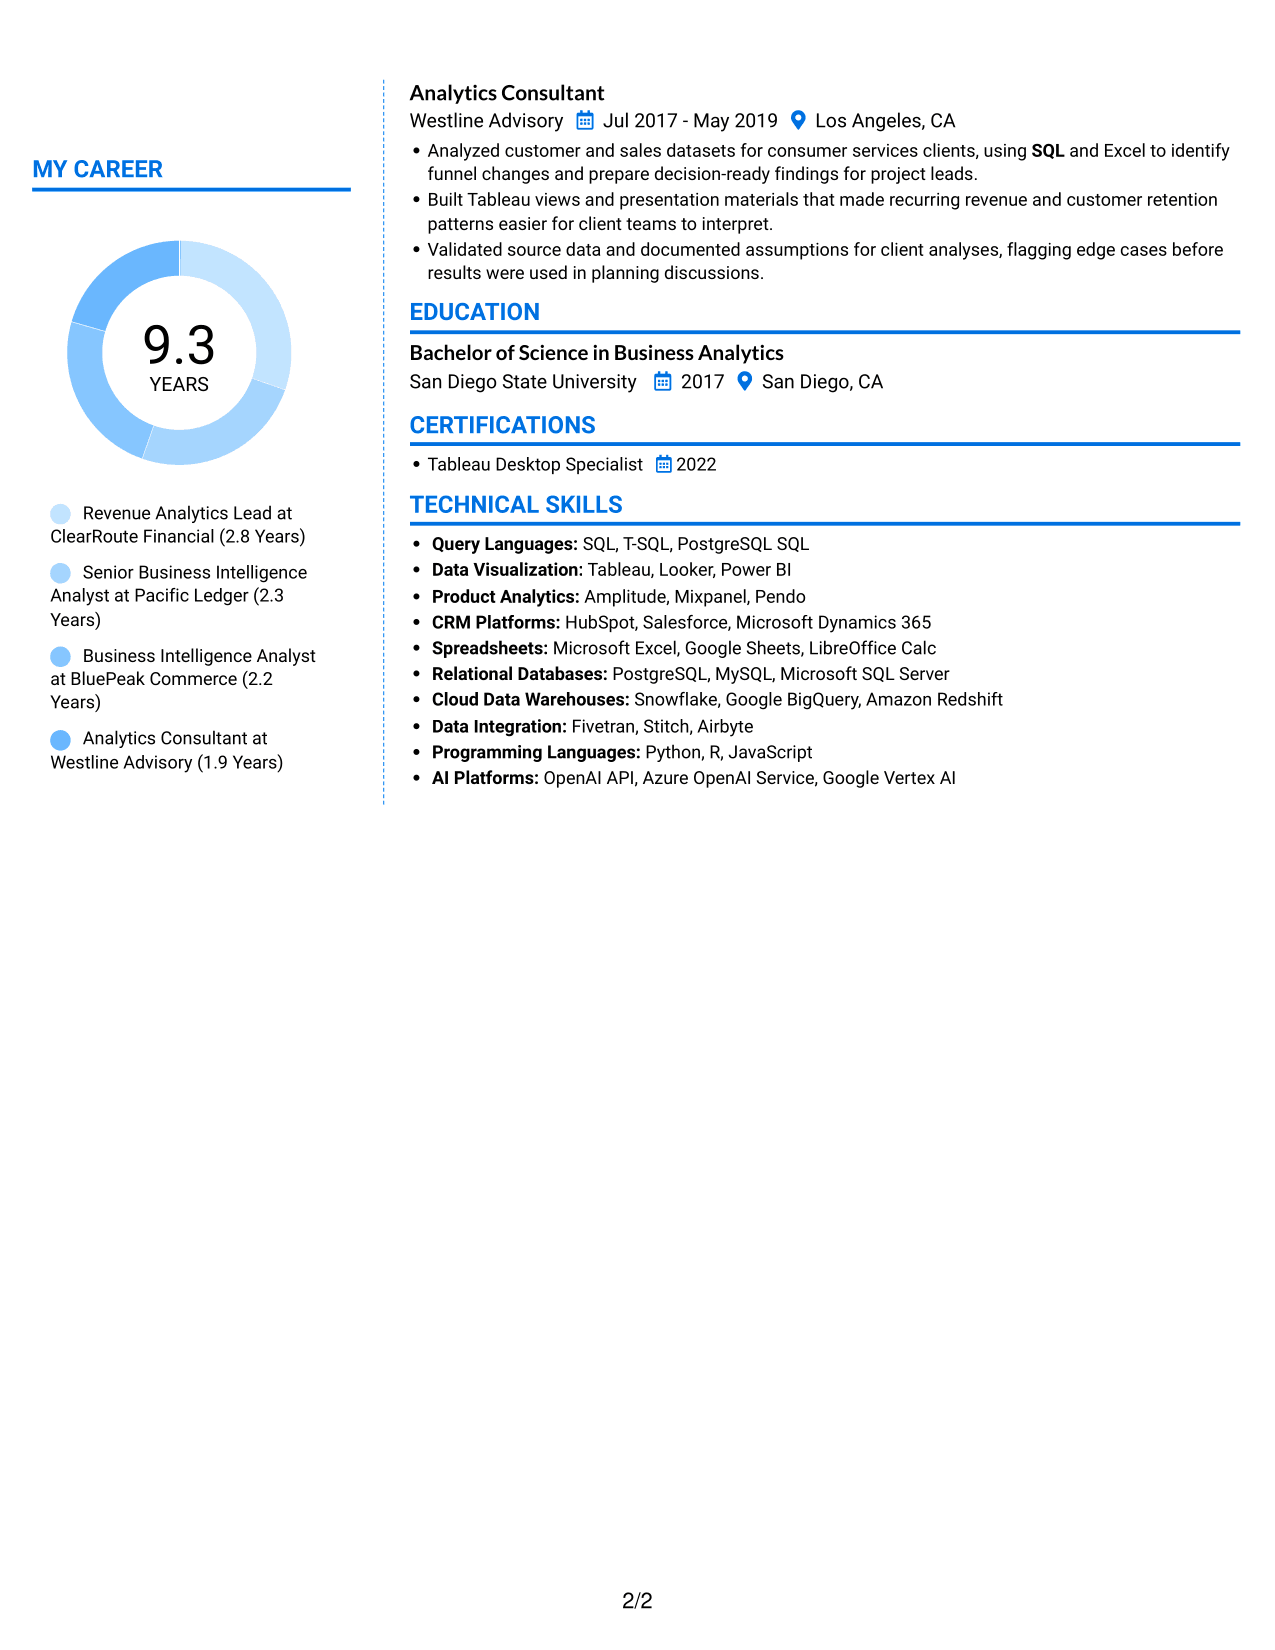
 
Resume example — page 1   Resume example — page 2

Why This Format Works

  • Skills appear as a distinct category rather than blending into role descriptions.
  • Education and certifications are simple to locate during a focused review.
  • Role dates remain easy to compare across the career timeline.

Best For

  • Parallel organization of resume sections
  • Career timelines with multiple roles
  • Separate review of skills and experience
  • Fast access to education details
  • Applications with varied resume content
 

#7 Stylish Two Column Designer Format Resume Example

This two-column layout gives the resume a divided reading structure, useful when reviewers need to move between experience and related sections.
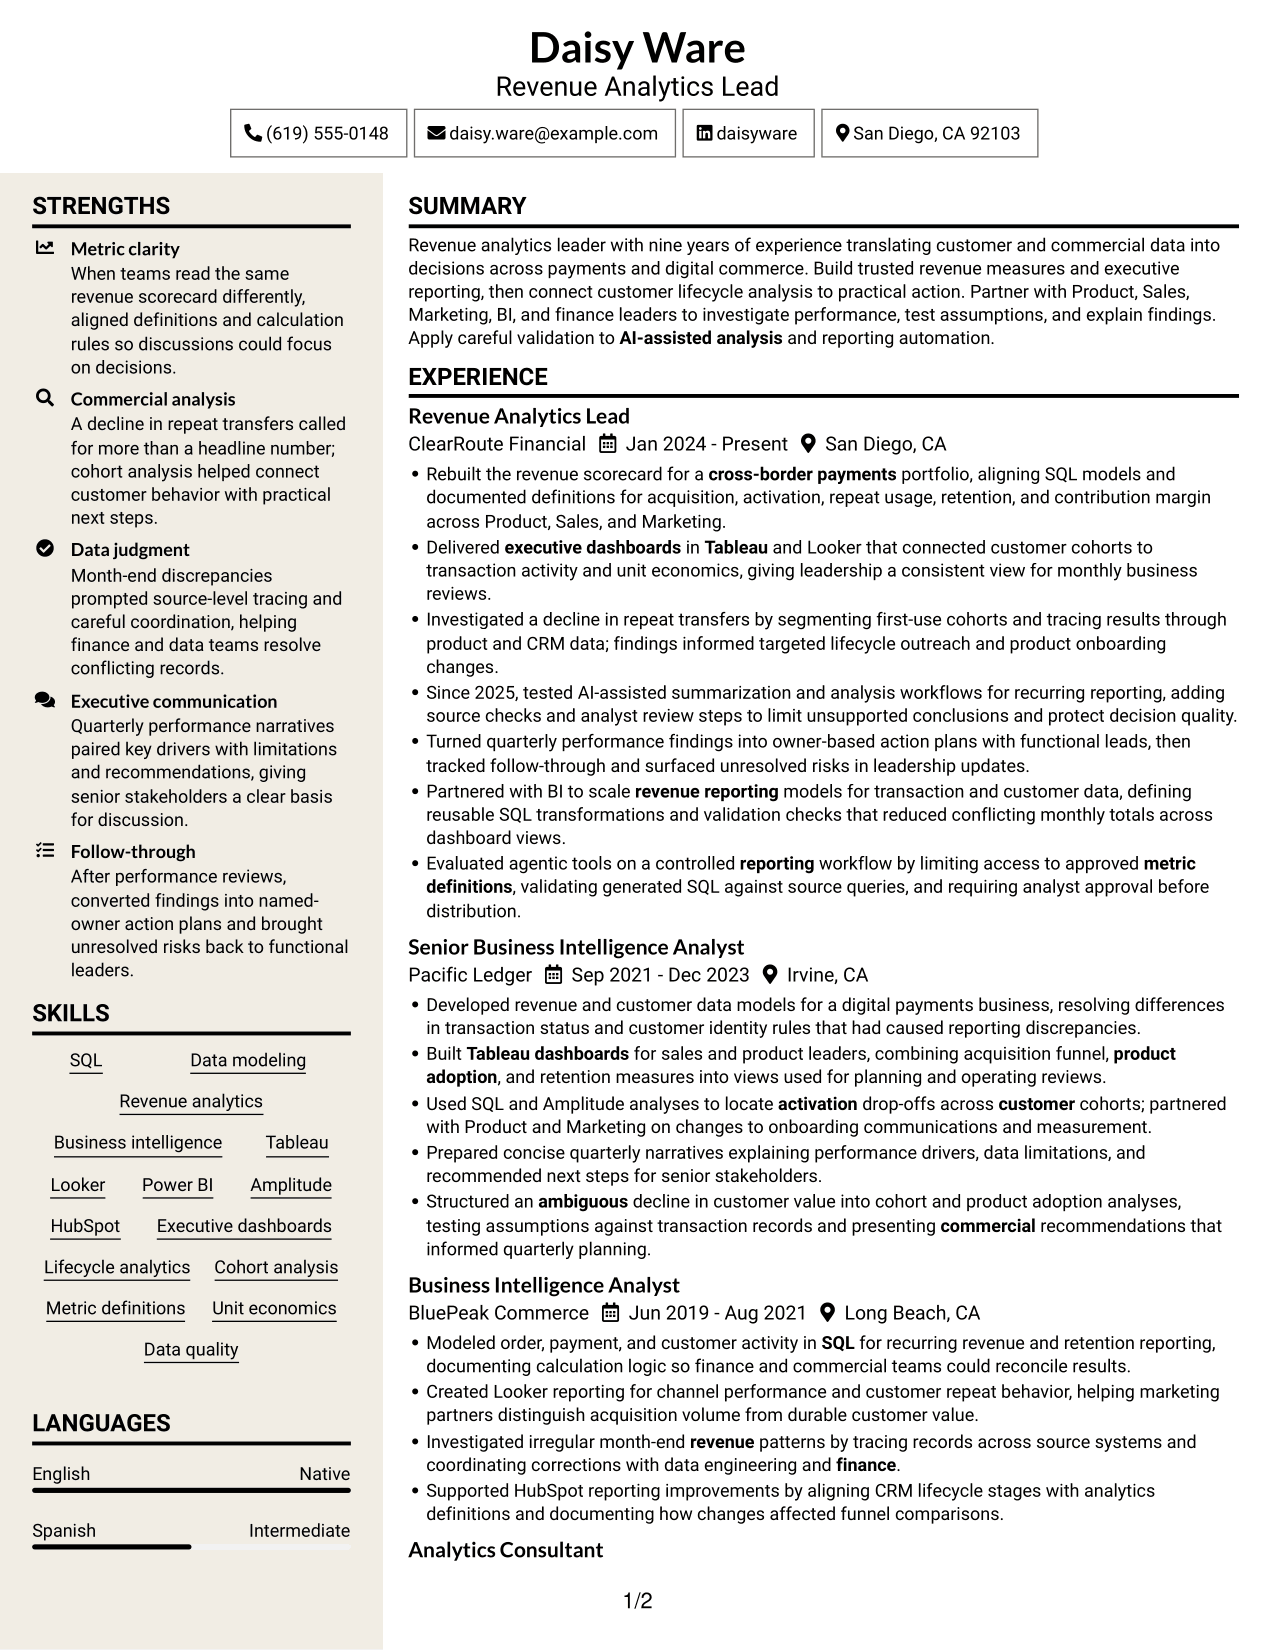
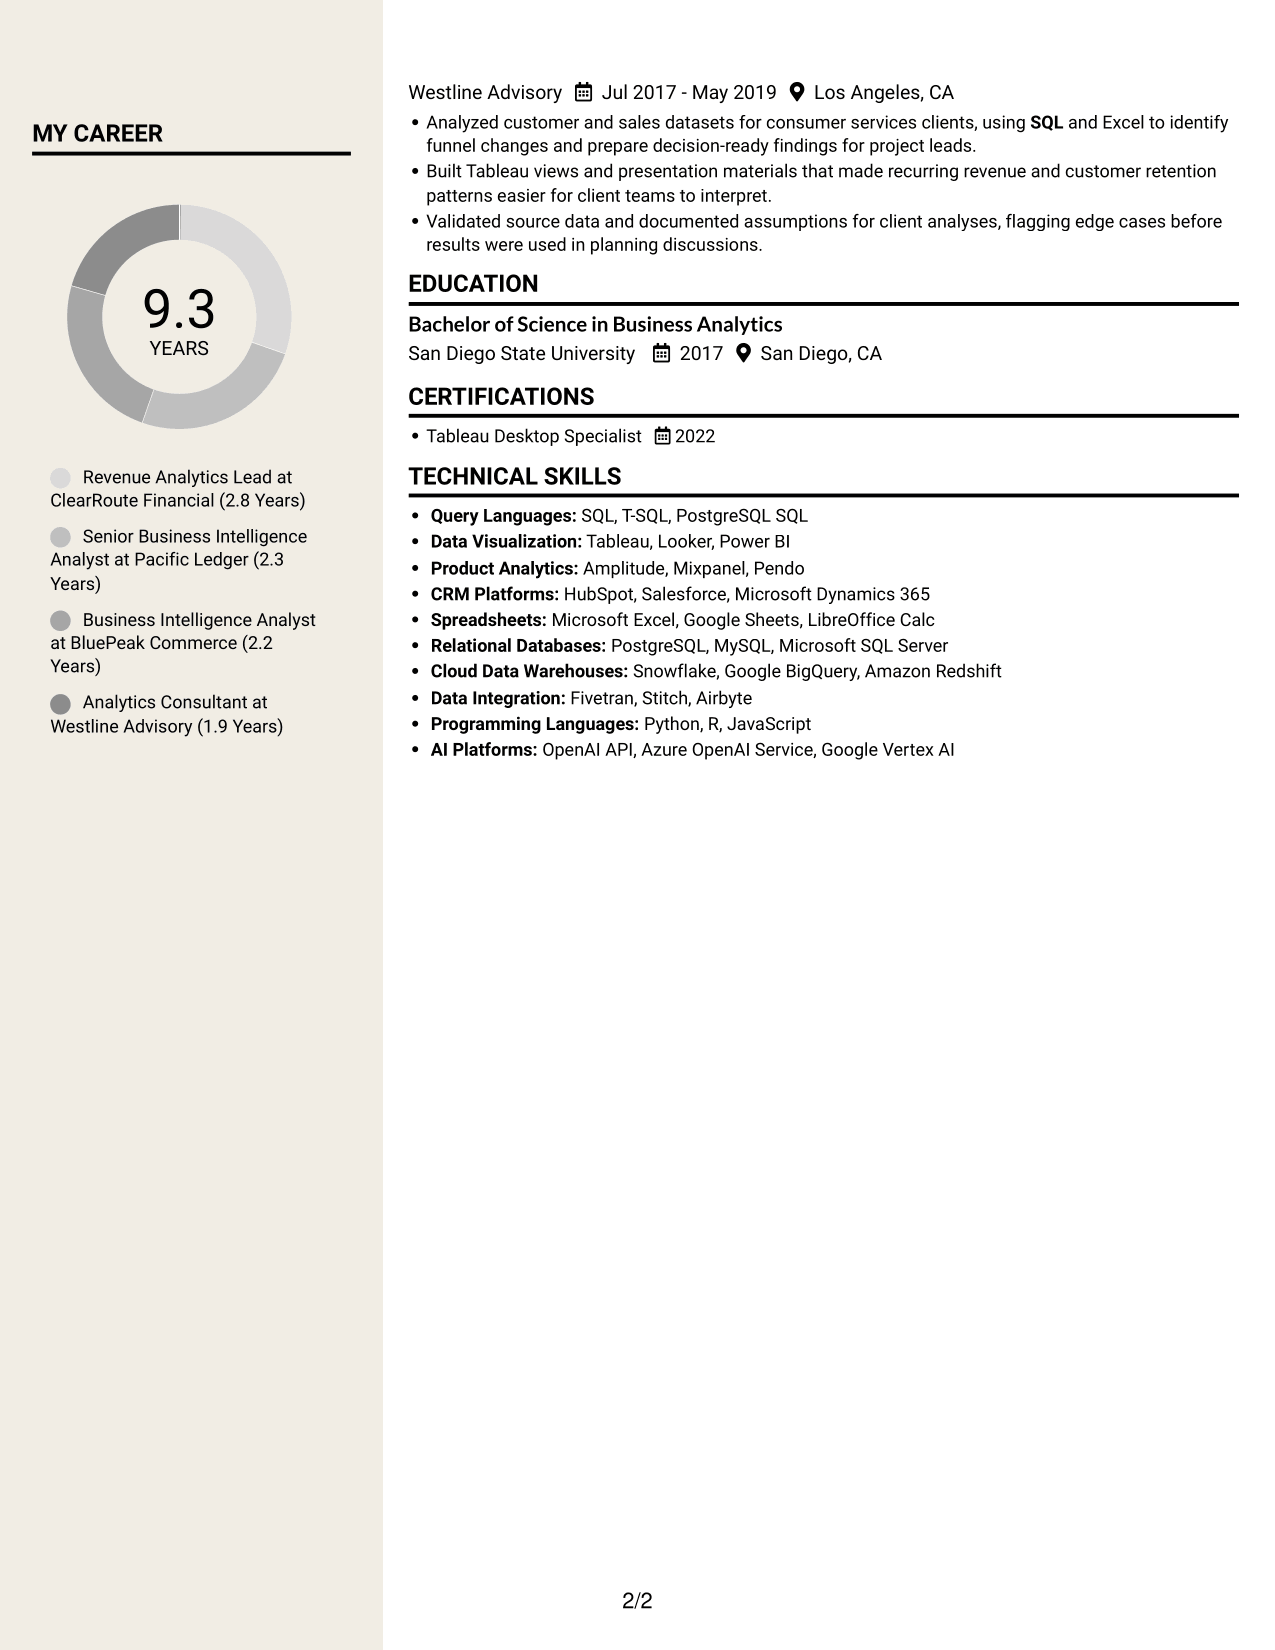
 
Resume example — page 1   Resume example — page 2

Why This Format Works

  • Consistent reading areas help reviewers follow career progression across multiple roles.
  • Skills can be reviewed apart from the detailed achievement bullets.
  • Education and certification details are easy to locate during a targeted scan.

Best For

  • Career progression across multiple roles
  • Skills separated from experience details
  • Targeted review of education and credentials
  • Resume content in parallel sections
  • Recruiter scans across varied information


Why Build Your Revenue Data & Analytics Manager Resume with ResumeInMinutes

ResumeInMinutes helps you organize your experience, skills, and results in a resume that is easy to review and adapt. Use the editor to view or customize an example.

  • Different resume layouts
  • Clear section structure
  • Role-relevant keyword guidance
  • Organized skills and experience
  • PNG image previews
  • Resume customization in the editor

Focus each section on the evidence that matters for revenue analytics, including reliable measures, customer lifecycle findings, and recommendations that support action.


See Also


Frequently Asked Questions

How can I make a Revenue Data & Analytics Manager resume easier for ATS to read?

Use common section headings, simple formatting, and relevant terms such as SQL, data modeling, revenue reporting, customer lifecycle analytics, and unit economics. Describe these skills in context instead of listing keywords without evidence.

Are these separate resume examples?

The page shows one resume example in different layouts. Compare the image previews, then open an example in the editor if you want to view or customize it.

What should a Revenue Data & Analytics Manager resume include?

Include a focused summary, experience, education, skills, and relevant certifications or projects. Use experience bullets to explain metric definitions, data models, dashboards, customer analysis, and business recommendations.

Which resume layout works well for this role?

Choose a layout with clear headings and an easy-to-follow experience section. A simple design helps readers find your measures, tools, and results quickly.

How should I describe revenue analytics achievements?

State the question you analyzed, the data or method you used, and what changed as a result. Add a number when you can support it, and explain the business meaning of the finding.

Which skills and tools should I highlight?

Prioritize skills that match your real experience, such as SQL, data modeling, Tableau, Looker, Power BI, Amplitude, HubSpot, cohort analysis, metric definition, and data quality. Support key skills with examples from your work.

Should I include a photo on my resume?

For most U.S. applications, a resume without a photo is a practical choice. Use the space for relevant skills, experience, and results instead.

ATS Score 96%

How we calculate this score

  • Keywords: 60% of the total. AI extracts keywords from your job description. If you do not provide one, a standard job description for the title matching your resume is used. This is not a match to a specific vacancy.
  • Text-based resume: 20%. The text resume assessed here receives 100 for this part.
  • Resume quality: 20%. We start at 100 and subtract points for issues found by our resume checks, down to a minimum of zero.
  • Keyword coverage = 100 × (confirmed matches + 0.8 × possible matches) ÷ total keywords, rounded and capped at 100. Possible matches still need checking. Saved generation audits use their saved keyword percentage.
  • Final score = 60% of keyword coverage + 20% of the text score + 20% of the quality score, rounded to a whole number. Without keywords, no overall ATS score is available.

What this score means

Our scores are estimates, not employer ratings. They may contain errors and do not guarantee accurate parsing, a ranking, an interview, or a job. Check your document against the employer’s requirements. You are responsible for relying on this score.

Terms and Conditions

Score weights: Keywords 60% · Text based resume 20% · Resume quality 20%

Keywords: 34 matched + 1 possible of 37 (94%) · Resume quality: 100%

Resume quality 100% · Weight 20% · Issues (0)

Details
  • ✓Name present: Daisy Ware
  • ✓Email format: daisy.ware@example.com
  • ✓Phone format: (619) 555-0148
  • ✓Experience 1: Job title: Revenue Analytics Lead
  • ✓Experience 1: Company name: ClearRoute Financial
  • ✓Experience 1: Work location: San Diego, CA
  • ✓Experience 1: Employment dates: Jan 2024 - Present
  • ✓Experience 1: Description or achievements: Present
  • ✓Experience 2: Job title: Senior Business Intelligence Analyst
  • ✓Experience 2: Company name: Pacific Ledger
  • ✓Experience 2: Work location: Irvine, CA
  • ✓Experience 2: Employment dates: Sep 2021 - Dec 2023
  • ✓Experience 2: Description or achievements: Present
  • ✓Experience 3: Job title: Business Intelligence Analyst
  • ✓Experience 3: Company name: BluePeak Commerce
  • ✓Experience 3: Work location: Long Beach, CA
  • ✓Experience 3: Employment dates: Jun 2019 - Aug 2021
  • ✓Experience 3: Description or achievements: Present
  • ✓Experience 4: Job title: Analytics Consultant
  • ✓Experience 4: Company name: Westline Advisory
  • ✓Experience 4: Work location: Los Angeles, CA
  • ✓Experience 4: Employment dates: Jul 2017 - May 2019
  • ✓Experience 4: Description or achievements: Present
  • ✓No placeholder fields
  • ✓No repeated achievement bullets
  • ✓No empty bullets

No issues found by the current checks.

Text Based Resume 100% · Weight 20%

Parsed text
Daisy Ware
Revenue Analytics Lead
(619) 555-0148
daisyware
daisy.ware@example.com
San Diego, CA 92103
STRENGTHS
Metric clarity
When teams read the same revenue scorecard differently, aligned definitions and calculation rules so discussions could focus on decisions.
Commercial analysis
A decline in repeat transfers called for more than a headline number; cohort analysis helped connect customer behavior with practical next steps.
Data judgment
Month-end discrepancies prompted source-level tracing and careful coordination, helping finance and data teams resolve conflicting records.
Executive communication
Quarterly performance narratives paired key drivers with limitations and recommendations, giving senior stakeholders a clear basis for discussion.
Follow-through
After performance reviews, converted findings into named-owner action plans and brought unresolved risks back to functional leaders.
SUMMARY
Revenue analytics leader with nine years of experience translating customer and commercial data into decisions across payments and digital commerce. Build trusted revenue measures and executive reporting, then connect customer lifecycle analysis to practical action. Partner with Product, Sales, Marketing, BI, and finance leaders to investigate performance, test assumptions, and explain findings. Apply careful validation to AI-assisted analysis and reporting automation.
EXPERIENCE
Revenue Analytics Lead
ClearRoute Financial
Jan 2024 - Present
San Diego, CA
Rebuilt the revenue scorecard for a cross-border payments portfolio, aligning SQL models and documented definitions for acquisition, activation, repeat usage, retention, and contribution margin across Product, Sales, and Marketing.
Delivered executive dashboards in Tableau and Looker that connected customer cohorts to transaction activity and unit economics, giving leadership a consistent view for monthly business reviews.
Investigated a decline in repeat transfers by segmenting first-use cohorts and tracing results through product and CRM data; findings informed targeted lifecycle outreach and product onboarding changes.
Since 2025, tested AI-assisted summarization and analysis workflows for recurring reporting, adding source checks and analyst review steps to limit unsupported conclusions and protect decision quality.
Turned quarterly performance findings into owner-based action plans with functional leads, then tracked follow-through and surfaced unresolved risks in leadership updates.
Partnered with BI to scale revenue reporting models for transaction and customer data, defining reusable SQL transformations and validation checks that reduced conflicting monthly totals across dashboard views.
Evaluated agentic tools on a controlled reporting workflow by limiting access to approved metric definitions, validating generated SQL against source queries, and requiring analyst approval before distribution.
Senior Business Intelligence Analyst
Pacific Ledger
Sep 2021 - Dec 2023
Irvine, CA
Developed revenue and customer data models for a digital payments business, resolving differences in transaction status and customer identity rules that had caused reporting discrepancies.
Built Tableau dashboards for sales and product leaders, combining acquisition funnel, product adoption, and retention measures into views used for planning and operating reviews.
Used SQL and Amplitude analyses to locate activation drop-offs across customer cohorts; partnered with Product and Marketing on changes to onboarding communications and measurement.
Prepared concise quarterly narratives explaining performance drivers, data limitations, and recommended next steps for senior stakeholders.
Structured an ambiguous decline in customer value into cohort and product adoption analyses, testing assumptions against transaction records and presenting commercial recommendations that informed quarterly planning.
Business Intelligence Analyst
BluePeak Commerce
Jun 2019 - Aug 2021
Long Beach, CA
Modeled order, payment, and customer activity in SQL for recurring revenue and retention reporting, documenting calculation logic so finance and commercial teams could reconcile results.
Created Looker reporting for channel performance and customer repeat behavior, helping marketing partners distinguish acquisition volume from durable customer value.
Investigated irregular month-end revenue patterns by tracing records across source systems and coordinating corrections with data engineering and finance.
Supported HubSpot reporting improvements by aligning CRM lifecycle stages with analytics definitions and documenting how changes affected funnel comparisons.
Analytics Consultant
Westline Advisory
Jul 2017 - May 2019
Los Angeles, CA
Analyzed customer and sales datasets for consumer services clients, using SQL and Excel to identify funnel changes and prepare decision-ready findings for project leads.
Built Tableau views and presentation materials that made recurring revenue and customer retention patterns easier for client teams to interpret.
Validated source data and documented assumptions for client analyses, flagging edge cases before results were used in planning discussions.
SKILLS
Lifecycle analytics
Metric definitions
HubSpot
Looker
Business intelligence
SQL
Revenue analytics
Power BI
Data quality
Executive dashboards
Data modeling
Unit economics
Cohort analysis
Amplitude
Tableau
LANGUAGES
English
Native
Spanish
Intermediate
MY CAREER
9.3Years
Revenue Analytics Lead at ClearRoute Financial (2.8 Years)
Senior Business Intelligence Analyst at Pacific Ledger (2.3 Years)
Business Intelligence Analyst at BluePeak Commerce (2.2 Years)
Analytics Consultant at Westline Advisory (1.9 Years)
EDUCATION
Bachelor of Science in Business Analytics
San Diego State University
2017
San Diego, CA
CERTIFICATIONS
Tableau Desktop Specialist
2022
TECHNICAL SKILLS
Query Languages: SQL, T-SQL, PostgreSQL SQL
Data Visualization: Tableau, Looker, Power BI
Product Analytics: Amplitude, Mixpanel, Pendo
CRM Platforms: HubSpot, Salesforce, Microsoft Dynamics 365
Spreadsheets: Microsoft Excel, Google Sheets, LibreOffice Calc
Relational Databases: PostgreSQL, MySQL, Microsoft SQL Server
Cloud Data Warehouses: Snowflake, Google BigQuery, Amazon Redshift
Data Integration: Fivetran, Stitch, Airbyte
Programming Languages: Python, R, JavaScript
AI Platforms: OpenAI API, Azure OpenAI Service, Google Vertex AI

Matched keywords (34)

  • SQL
  • Data modeling
  • Rebuilt the revenue scorecard for a cross-border payments portfolio, aligning SQL models and documented definitions for acquisition, activation, repeat usage, retention, and contribution margin across Product, Sales, and Marketing.Original keyword in JD: Revenue Measurement
  • Metric definitions
  • Executive dashboards
  • revenue reporting
  • Business intelligence
  • Investigated a decline in repeat transfers by segmenting first-use cohorts and tracing results through product and CRM data; findings informed targeted lifecycle outreach and product onboarding changes.Original keyword in JD: Revenue Performance Analysis
  • Built Tableau dashboards for sales and product leaders, combining acquisition funnel, product adoption, and retention measures into views used for planning and operating reviews.Original keyword in JD: Customer Lifecycle Analytics
  • Unit economics
  • Used SQL and Amplitude analyses to locate activation drop-offs across customer cohorts; partnered with Product and Marketing on changes to onboarding communications and measurement.Original keyword in JD: Retention Analysis
  • TableauOriginal keyword in JD: Power BI OR Tableau OR Looker
  • cross-border payments
  • Built Tableau dashboards for sales and product leaders, combining acquisition funnel, product adoption, and retention measures into views used for planning and operating reviews.Original keyword in JD: Customer Acquisition Analysis
  • Used SQL and Amplitude analyses to locate activation drop-offs across customer cohorts; partnered with Product and Marketing on changes to onboarding communications and measurement.Original keyword in JD: Customer Activation Analysis
  • Built Tableau dashboards for sales and product leaders, combining acquisition funnel, product adoption, and retention measures into views used for planning and operating reviews.Original keyword in JD: Product Adoption Analysis
  • Investigated a decline in repeat transfers by segmenting first-use cohorts and tracing results through product and CRM data; findings informed targeted lifecycle outreach and product onboarding changes.Original keyword in JD: Customer Engagement Analysis
  • cohort analysis
  • Investigated irregular month-end revenue patterns by tracing records across source systems and coordinating corrections with data engineering and finance.Original keyword in JD: Data Quality Investigation
  • AI-assisted analysis
  • Evaluated agentic tools on a controlled reporting workflow by limiting access to approved metric definitions, validating generated SQL against source queries, and requiring analyst approval before distribution.Original keyword in JD: Agentic Tools Evaluation
  • Partnered with BI to scale revenue reporting models for transaction and customer data, defining reusable SQL transformations and validation checks that reduced conflicting monthly totals across dashboard views.Original keyword in JD: Data Model Scalability
  • Commercial analysis
  • Structured an ambiguous decline in customer value into cohort and product adoption analyses, testing assumptions against transaction records and presenting commercial recommendations that informed quarterly planning.Original keyword in JD: Ambiguous Problem Structuring
  • Structured an ambiguous decline in customer value into cohort and product adoption analyses, testing assumptions against transaction records and presenting commercial recommendations that informed quarterly planning.Original keyword in JD: Assumption Testing
  • Prepared concise quarterly narratives explaining performance drivers, data limitations, and recommended next steps for senior stakeholders.Original keyword in JD: Executive Presentations
  • Prepared concise quarterly narratives explaining performance drivers, data limitations, and recommended next steps for senior stakeholders.Original keyword in JD: Written Performance Narratives
  • Turned quarterly performance findings into owner-based action plans with functional leads, then tracked follow-through and surfaced unresolved risks in leadership updates.Original keyword in JD: Cross-Functional Influence
  • Prepared concise quarterly narratives explaining performance drivers, data limitations, and recommended next steps for senior stakeholders.Original keyword in JD: Senior Stakeholder Communication
  • Turned quarterly performance findings into owner-based action plans with functional leads, then tracked follow-through and surfaced unresolved risks in leadership updates.Original keyword in JD: Action Planning
  • Turned quarterly performance findings into owner-based action plans with functional leads, then tracked follow-through and surfaced unresolved risks in leadership updates.Original keyword in JD: Execution Accountability
  • Since 2025, tested AI-assisted summarization and analysis workflows for recurring reporting, adding source checks and analyst review steps to limit unsupported conclusions and protect decision quality.Original keyword in JD: Analysis Validation
  • financeOriginal keyword in JD: Business Analytics OR Finance OR Statistics OR Mathematics OR Computer Science OR Economics OR Related Quantitative Field
  • Product Analytics: Amplitude

Missing keywords (2)

  • Process Automation
  • Quantitative Analysis

Possible matches (1)

  • CRM Analytics (HubSpot OR Similar Platform)80% credit: 2.16 percentage points of 2.70 possible.
Disclaimer: All names, images, contact information, employment histories, achievements, security clearances, military credentials, and other qualifications shown in this content are fictional and used for illustrative purposes only. Any resemblance to actual persons, living or deceased, is purely coincidental.

Resume and cover-letter examples and recommendations in this article reflect general best practices and professional experience and are provided for guidance only. Results may vary based on role, industry, region, and hiring organization.

Content Accuracy and Verification: To the fullest extent permitted by applicable law, we do not represent or warrant that resume or cover-letter guidance, examples, recommendations, or related information are accurate, complete, current, error-free, or suitable for any particular purpose. You are responsible for independently reviewing and verifying the information before relying on it.

ATS and Cover-Letter Scores: ATS scores are estimates calculated using our own formula, informed by publicly available guidance on resume formatting and keyword matching. They are not scores issued or endorsed by an ATS provider or employer. Cover-letter scores are also our own assessments. Parsing, weighting, screening criteria, and results vary between systems, employers, job descriptions, and document formats. No score guarantees successful parsing, a particular ranking, an interview, or employment. Use scores as general guidance and independently check your documents against the employer’s requirements. To the fullest extent permitted by applicable law, we accept no liability for errors in scores or parsing, or losses arising from reliance on these assessments. Nothing in this notice excludes liability or limits consumer rights that cannot lawfully be excluded or limited.

Terms and Conditions
 
> JP 1 1
PDF Footer and Margins Setup
The margins are applied to the document, and the footer shows up in the preview and the PDF

Footer Font Settings

Are you applying for a specific job
so we can tailor your resume to it?
Are you applying for a specific job
so we can tailor your cover letter to it?

Your data stays private and is never used for training.Privacy Policy

Type your details as text to generate a personalized resume Type your details as text to generate a personalized cover letter
Website link found! Ready to create resume from:

Your data stays private and is never used for training.Privacy Policy

Drag the into the box to verify you're human.
Drop here

My Resumes

Displaying {number_of_files} files (out of {total_of_all_files} total)
Name File Type Last Modified: Description:

Rename File

Filename already exists!

Delete Files

Warning: This action is irreversible. Once you click submit, the files will be permanently deleted.

Heading text
Upload From Computer Upload
Select From Existing
LinkedIn
Drag & Drop files anywhere in this tab, or

Uploaded Files

Delete Name Last Updated Use This File
Select this to use the file for generating your resume and cover letter. Only one source—uploaded file, selected file, or LinkedIn text—can be used.

My Files

Resumes or cover letters you create will appear here. No files available yet.
Delete Name Last Updated Use This File
Select this to use the file for generating your resume and cover letter. Only one source—uploaded file, selected file, or LinkedIn text—can be used.

Add LinkedIn Profile PDF

You can download your LinkedIn profile as a PDF by opening linkedin.com in a web browser, clicking your profile photo, selecting the “More” or “Resources” button, and choosing “Save to PDF.” You can then attach the PDF using the Upload From Computer tab.

Paste Your LinkedIn Profile Text

If you have copied the LinkedIn profile text, paste it below. See how to copy your profile from LinkedIn

Select this to use the LinkedIn profile text for generating your resume and cover letter. Only one source—uploaded file, selected file, or LinkedIn text—can be used.

Try these controls

<
>