Amazon Python Developer Interview Questions & Answers

amazon icon

Questions with Detailed ExplanationsWith Detailed Explanations

(Last Updated: August 28, 2026)

11. Design a metrics monitoring and alerting system.System DesignHardAmazon

Question Details

Design a system that collects service metrics, stores and queries them, evaluates alert conditions, and sends alerts reliably.

Short Interview Answer (30-60 seconds)

At a high level, this system collects service metrics and sends useful alerts. The main challenge is handling many measurements while detecting problems quickly and avoiding repeated alerts. I would explain it in three flows: metric ingestion, metric queries and alert checks, then reliable notification delivery. Sources feed the Metrics Collector, buffered writes reach the Time Series Database, and the Alert Evaluator checks rules plus saved alert state. The Notification Dispatcher sends alerts and retries failures. The trade-off is stronger reliability, but more components to operate.

Detailed Explanation

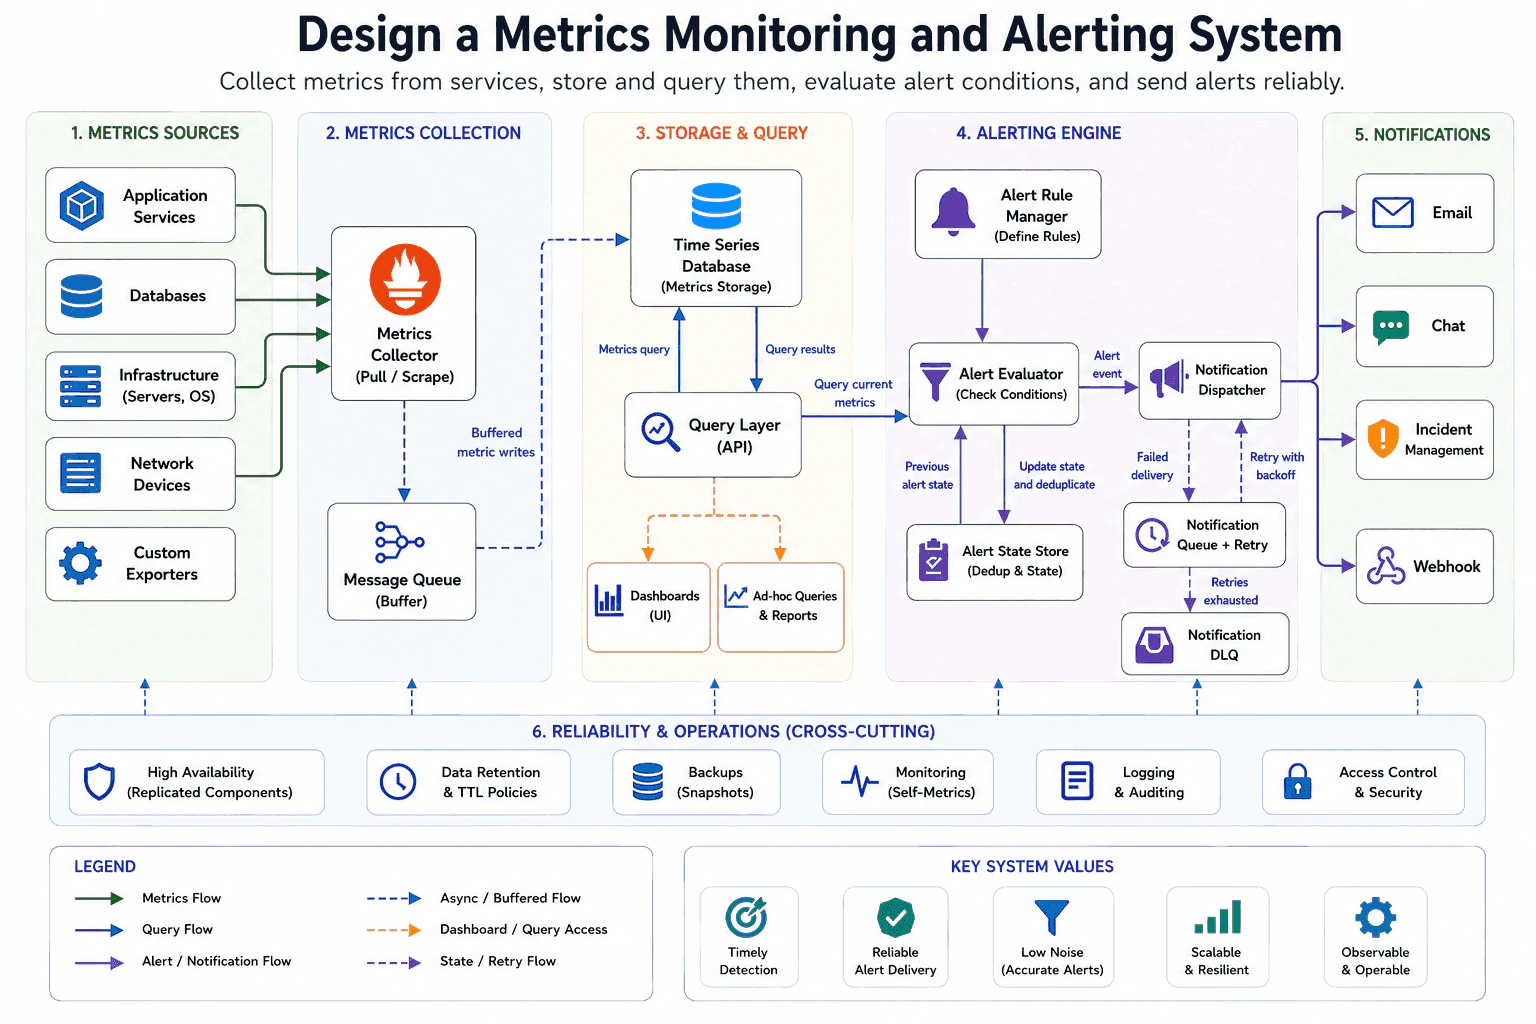
The goal is to collect service metrics, store them for later queries, detect bad conditions, and send alerts reliably. The difficult part is keeping collection steady while queries stay useful and notifications survive failures. The diagram solves this through five stages: metric sources, collection, storage and query, alert evaluation, and notification delivery. Shared reliability and operations controls support every stage.

Useful Questions to Ask the Interviewer
  1. Which user flows and system capabilities are required for the first version?
  2. What traffic, data volume, latency, and availability targets should I design for?
  3. Which consistency, security, geographic, and cost constraints matter most?
Design a metrics monitoring and alerting system. diagram
How to Explain It in an Interview
1. Explain the goal and the main idea

“I would separate metric ingestion, alert evaluation, and notification delivery.” Application Services, Databases, Infrastructure, Network Devices, and Custom Exporters produce the measurements. The system stores those measurements, checks alert rules, and sends useful alerts with low noise. Each stage can keep working without making every other stage wait.

2. Explain the metrics ingestion flow

“For the ingestion path, the Metrics Collector gathers data from every metric source.” The diagram uses a pull or scrape model. This means the collector asks each source for its latest measurements.

The collector sends those measurements to the Message Queue. The queue is a buffer, so it holds data during short bursts. Buffered metric writes then move into the Time Series Database. This database stores metric values over time.

3. Explain storage and query work

“For reads, the Query Layer provides one API for stored metrics.” It sends a Metrics query to the Time Series Database. The database returns Query results.

Dashboards use the Query Layer to show metric charts. Ad-hoc Queries and Reports use it for manual investigation. The Alert Evaluator also asks this layer for current metrics. This keeps human queries and alert checks based on the same stored data.

4. Explain alert evaluation and alert state

“The Alert Rule Manager defines the conditions we want to watch.” It passes those rules to the Alert Evaluator. The evaluator compares each rule with current metrics.

Before deciding, it reads Previous alert state from the Alert State Store. This helps the system know whether an alert is new or already active. After the check, it sends Update state and deduplicate back to the store. Deduplication means repeated copies of one alert become one useful alert.

5. Explain reliable notification delivery

“When a condition matches, the evaluator sends an Alert event to the Notification Dispatcher.” The dispatcher sends it to Email, Chat, Incident Management, or Webhook.

If delivery fails, the dispatcher sends the work to Notification Queue + Retry. That queue retries with backoff, which means it waits between attempts. If every retry fails, the work moves to the Notification DLQ. A DLQ is a dead-letter queue for failed work that needs later review.

6. Explain reliability, operations, and trade-offs

“I would apply the bottom controls across the whole system.” High Availability uses replicated components to reduce service loss. Data Retention and TTL Policies remove old data after its allowed lifetime. Backups keep snapshots for recovery.

Monitoring collects self-metrics about this system. Logging and Auditing record important actions. Access Control and Security limit who can query metrics or change rules. These choices support timely detection, reliable delivery, low noise, and easier operation. The downside is more services, stored state, and failure paths to manage.

Engineering Considerations / Design Trade-offs

The benefit is that each part has one clear job. The Message Queue absorbs short metric bursts. The Notification Queue + Retry protects alert delivery when a destination fails. The Alert State Store reduces repeated alerts. High Availability and Backups help the system recover. The downside is more services to run and watch. Retries may delay a message. Retaining metrics also costs storage, so TTL policies must remove old data. Replicated components and saved alert state add more operating work. We accept this because lost metrics, noisy alerts, and silently dropped notifications are worse.

Why Interviewers Ask This

Interviewers want to see whether you can split a large system into clear flows. They test how you handle metric ingestion, time-based storage, queries, alert state, retries, and dead-letter failures. They also want to hear why each part exists. A strong answer shows good judgment about reliability, low alert noise, retention, security, and the cost of added complexity.

Interviewer may ask next
How would the design handle a sudden increase in metric volume?

I would keep the same architecture and use the existing Message Queue to absorb short bursts. The Metrics Collector would still gather measurements from the same sources. It would place them into the queue before buffered metric writes reach the Time Series Database.

I would watch the system’s self-metrics closely. Monitoring should show queue growth, collector health, database write speed, and query delay. Data Retention and TTL Policies become more important because higher volume fills storage faster. Backups must also finish without blocking normal writes.

Correctness stays the same because metrics still follow one path into the Time Series Database. The Query Layer and Alert Evaluator still read the stored measurements. The main downside is cost. A long queue can also make fresh metrics arrive late, which may delay alert detection.

What happens if an alert destination stays unavailable for a long time?

I would keep the current notification path and let its retry flow handle the failure. The Alert Evaluator still creates one Alert event. The Notification Dispatcher first tries Email, Chat, Incident Management, or Webhook.

When delivery fails, the dispatcher sends the work to Notification Queue + Retry. The queue retries with backoff, so it waits between attempts. The Alert State Store still tracks the alert and helps reduce duplicate notifications.

If every retry fails, the work moves to the Notification DLQ. This keeps failed alerts available for later review instead of losing them silently. Logging and Auditing should record the failure. Monitoring should show retry growth and DLQ entries. The main downside is delayed delivery. Some alerts may require manual handling after they reach the DLQ.

12. Design a collaborative code editor like Google Docs.System DesignHardAmazon

Question Details

Design a collaborative editor that allows multiple users to edit the same document or code file and keeps their changes synchronized.

Short Interview Answer (30-60 seconds)

At a high level, this system lets many users edit one document together. The main challenge is keeping concurrent edits synchronized while updates remain fast. I would explain three flows: opening the document, processing live edits, and saving edit history. Requests pass through access checks before reaching the Collaboration Engine. Its Sync Engine uses OT or CRDT. The Realtime Gateway broadcasts synchronized edits, cursor changes, and presence. The trade-off is greater coordination and storage complexity.

Detailed Explanation

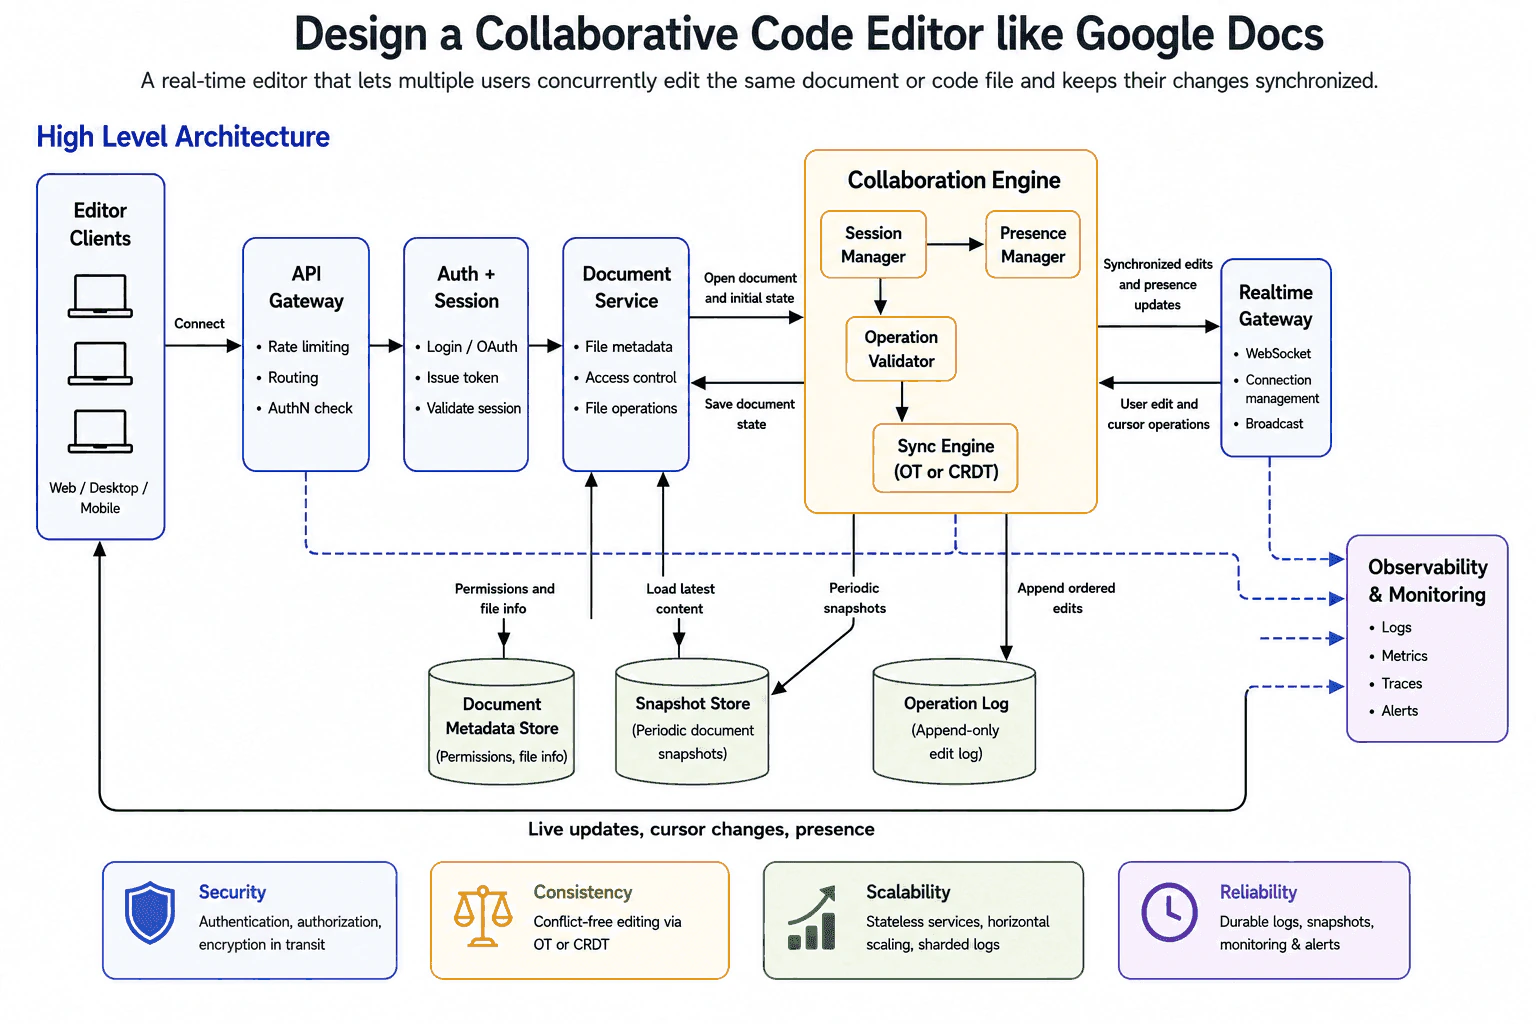
The goal is to let several users edit the same document or code file at once. Every user should quickly see accepted edits, cursor movements, and presence changes. The difficult part is handling operations that arrive at nearly the same time. The diagram separates document access, live collaboration, durable history, and system monitoring.

Useful Questions to Ask the Interviewer
  1. Which user flows and system capabilities are required for the first version?
  2. What traffic, data volume, latency, and availability targets should I design for?
  3. Which consistency, security, geographic, and cost constraints matter most?
Design a collaborative code editor like Google Docs. diagram
How to Explain It in an Interview
1. Explain how a user opens a document

I would begin with the document-opening flow.

Editor Clients may be web, desktop, or mobile applications. They connect through the API Gateway. The gateway handles routing, rate limiting, and authentication checks.

The request then reaches Auth + Session. It handles login, issues a token, and validates the current session. The Document Service checks file metadata, access control, and file operations.

The Document Metadata Store supplies permissions and file information. The Snapshot Store supplies the latest saved document content. The Document Service then sends the open document and initial state to the Collaboration Engine.

2. Explain how live operations enter the system

For live collaboration, the Realtime Gateway receives user edits and cursor operations.

It keeps WebSocket connections open. A WebSocket allows quick messages in both directions. The gateway sends those operations to the Collaboration Engine.

Inside that engine, the Session Manager tracks the active editing session. It also sends session information to the Presence Manager. Presence means which users are connected and where they are working.

The Operation Validator checks each operation before synchronization. Valid operations then move to the Sync Engine.

3. Explain how concurrent edits stay synchronized

The Sync Engine uses OT or CRDT. These are methods for handling edits made by several users at the same time.

The engine produces a consistent result for the shared document. It then sends synchronized edits and presence updates toward the Realtime Gateway.

The Realtime Gateway broadcasts those updates to the Editor Clients. This return path carries live edits, cursor changes, and presence information. Users see changes without reloading the document.

4. Explain how document state and history are saved

The Collaboration Engine can send saved document state back to the Document Service.

The Sync Engine appends ordered edits to the Operation Log. The log is append-only, which means new records are added without replacing earlier records.

The Sync Engine also creates periodic snapshots. A snapshot is a complete saved version of the document at one point in time. The Snapshot Store keeps these versions so later document loads do not need every old edit.

Together, the Document Metadata Store, Snapshot Store, and Operation Log support permissions, loading, and durable edit history.

5. Explain scale, safety, and trade-offs

The design uses stateless services where possible. This means another service instance can handle a later request. Horizontal scaling adds more instances when traffic grows.

The diagram also shows sharded logs. Sharding divides stored history into smaller groups. Security includes authentication, authorization, and encryption while data travels between components.

Observability & Monitoring receives information from the API Gateway, Document Service, Collaboration Engine, and Realtime Gateway. It tracks logs, metrics, traces, and alerts.

The main trade-off is complexity. OT or CRDT improves consistency during concurrent editing, but it is harder to build and test. Durable logs and snapshots improve recovery, but they add storage and maintenance work.

Engineering Considerations / Design Trade-offs

The benefit is fast shared editing with clear handling for concurrent changes. OT or CRDT helps users edit together without simply overwriting each other. The Operation Log keeps ordered history, while snapshots make later document loads faster. Stateless services support horizontal scaling, and monitoring helps the team find problems. The downside is extra complexity. The Sync Engine must process operations carefully. WebSocket connections need active management. Logs, snapshots, and sharding add storage work. We accept these costs because the editor must stay responsive, preserve history, and keep users synchronized.

Why Interviewers Ask This

Interviewers ask this question to test how you divide a large problem into clear flows. They want to see how you handle concurrent edits, live connections, permissions, durable history, scaling, and monitoring. They also want to know whether you can explain OT or CRDT in simple words. The key skill is choosing sensible trade-offs and explaining why each part exists.

Interviewer may ask next
How would this design handle one document with thousands of active editors?

I would keep the same components, but scale the live path more carefully. The Realtime Gateway would need more capacity for WebSocket connections. The Collaboration Engine would also need enough instances to process the larger operation rate.

The important rule is that operations for the same document must still reach the correct collaboration session. The Session Manager would keep that session organized. The Operation Validator and Sync Engine would continue checking and synchronizing edits before broadcast.

Presence updates create many small messages, so I would send them less often when traffic becomes very high. Ordered edits would still go to the Operation Log. Periodic snapshots would help new users load the current document without processing the full history.

Observability & Monitoring would watch connection counts, edit delay, errors, and broadcast speed. The main downside is that one popular document can become a busy point and require more coordination.

What would you do if the Realtime Gateway failed during an editing session?

I would keep the same design and rely on the durable state already shown in the diagram. The Realtime Gateway handles live connections, but it is not the only place that holds document history.

Accepted ordered edits remain in the Operation Log. Periodic document versions remain in the Snapshot Store. When live service returns, the Document Service can load the latest snapshot and file information. The Collaboration Engine can then continue processing new operations.

Observability & Monitoring should detect the failed gateway through logs, metrics, traces, and alerts. Another gateway instance can take new connections because the design supports horizontal scaling and stateless services where possible.

Users may temporarily stop receiving live edits, cursor changes, and presence updates. The durable stores protect saved history, but they do not remove that short interruption. The main downside is reconnect work and a brief delay before every client sees the current state again.

13. Design a high-level payment service.System DesignHardAmazon

Question Details

Design a payment service with emphasis on scalability, fault tolerance, and important architectural tradeoffs.

Short Interview Answer (30-60 seconds)

At a high level, this service must process payments safely and return a clear status. The main challenge is preventing duplicate charges while handling slow or failed payment processors. I would explain three flows: the main payment request, background event processing, and failure recovery. The design uses idempotency, risk checks, processor routing, durable payment records, and a ledger. Settlement, webhooks, checking, and audits run in the background. The trade-off is strict correctness for money data, while background updates may arrive later.

Detailed Explanation

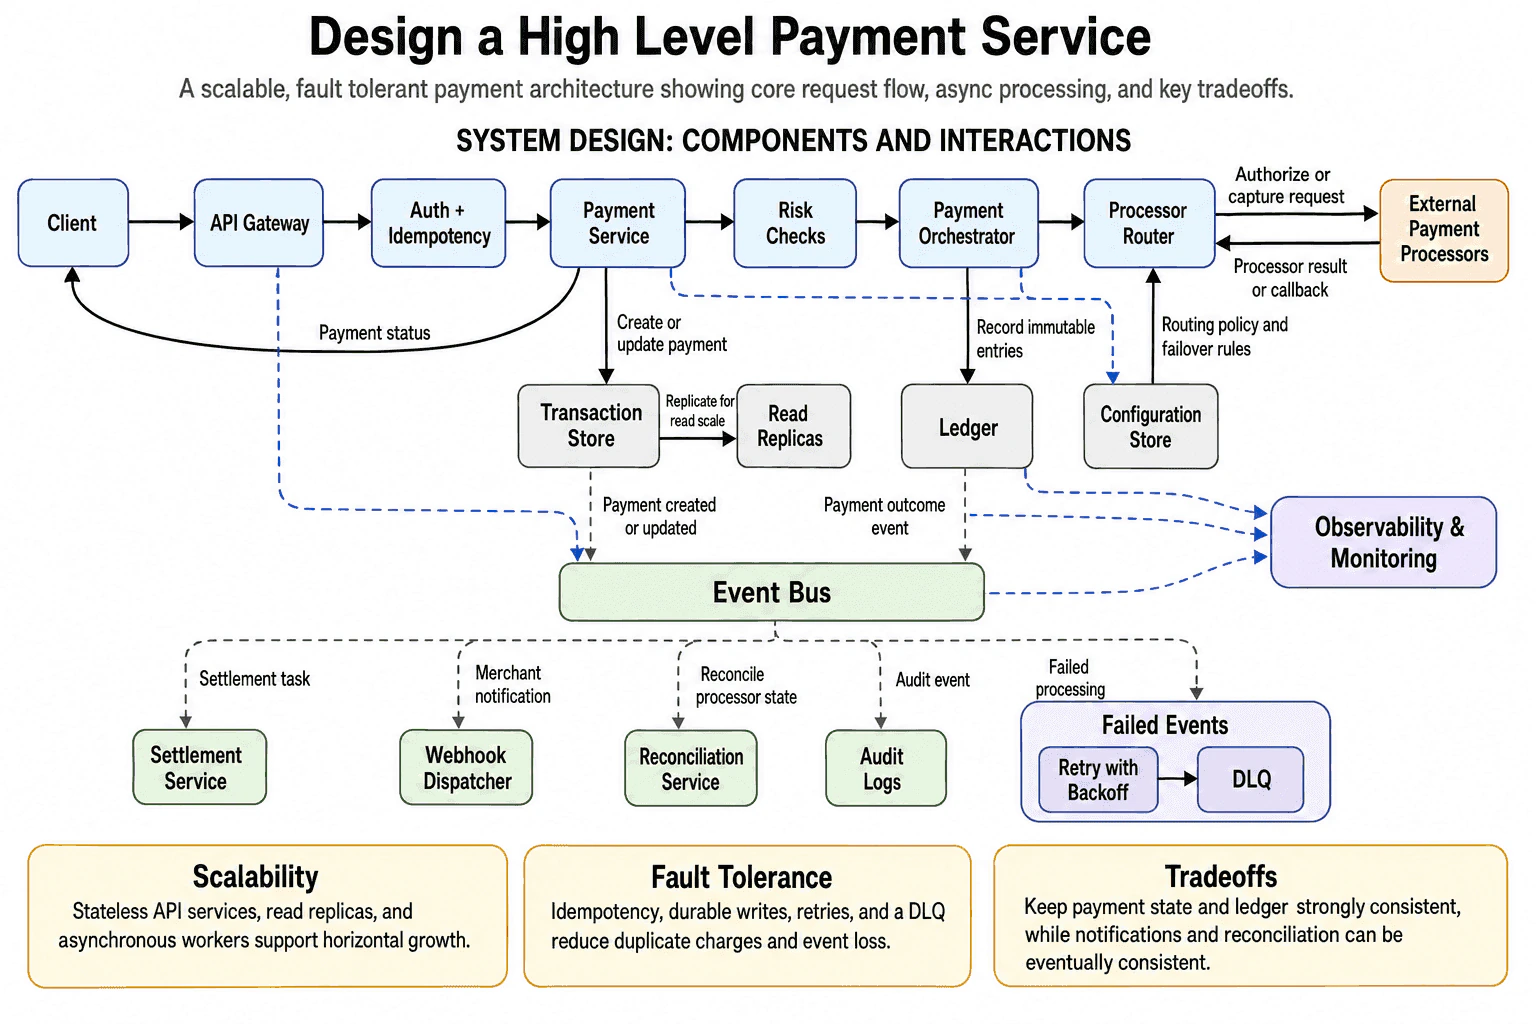
The goal is to accept a payment request, process it safely, and return the current payment status. The difficult part is protecting money when clients retry requests or processors fail. The diagram solves this with a main payment path, safe data writes, background events, and clear failure handling.

Useful Questions to Ask the Interviewer
  1. Which user flows and system capabilities are required for the first version?
  2. What traffic, data volume, latency, and availability targets should I design for?
  3. Which consistency, security, geographic, and cost constraints matter most?
Design a high-level payment service. diagram
How to Explain It in an Interview
1. Explain the goal and the main idea

I would say the service must make each payment safe and traceable. Correctness matters more than saving a few milliseconds.

The design separates the user-facing payment path from background work. The main path handles checks, processor calls, and payment records. The background path handles settlement, merchant notifications, processor checking, and audits.

2. Explain the main payment path

For the payment path, the Client sends the request to the API Gateway. The request then passes through Auth + Idempotency.

Idempotency means the same request can be repeated without charging twice. This protects users when a timeout causes the client to retry.

The Payment Service receives the request next. It creates or updates the payment in the Transaction Store. The store copies data to Read Replicas, which spread read traffic across backup read copies.

The request then passes through Risk Checks. These checks can stop suspicious or unsafe payments before processor work begins.

3. Explain processor routing and money records

The Payment Orchestrator manages the next payment steps. It sends the request to the Processor Router.

The Processor Router reads routing and failover rules from the Configuration Store. It then sends an authorize or capture request to External Payment Processors.

A processor result or callback returns to the Processor Router. The router passes that result back to the Payment Orchestrator.

The Payment Orchestrator records immutable entries in the Ledger. Immutable means old money entries are not changed after they are written.

The latest payment status returns through the API Gateway to the Client.

4. Explain background work

The Payment Service sends a payment created or updated event to the Event Bus. The Payment Orchestrator sends a payment outcome event to the same bus.

The Event Bus lets slower work happen in the background. This keeps settlement and notifications away from the main response path.

The Settlement Service handles settlement tasks. The Webhook Dispatcher sends merchant notifications. The Reconciliation Service checks processor state against the service state. Audit Logs record important actions.

If processing fails, the event goes to Failed Events. Retry with Backoff waits longer between retries. If retries still fail, the event moves to the DLQ for later review.

5. Explain scale, failures, and trade-offs

Stateless API services can scale by adding more service copies. Read Replicas help the system handle more read traffic. Background consumers can also scale separately.

Observability & Monitoring receives signals from the API Gateway, Payment Service, Payment Orchestrator, and Event Bus. This helps the team find slow requests, processor errors, and delayed events.

The main trade-off is consistency. Payment state and Ledger entries should stay strongly correct. Webhooks, settlement, and processor checks may finish later. This is acceptable because a late notification is safer than a duplicate charge.

Engineering Considerations / Design Trade-offs

The benefit is that the main payment path stays focused on safe money movement. Idempotency reduces duplicate charges. Risk Checks stop unsafe requests early. The Ledger gives a clear money history. Read Replicas help with more read traffic. The Event Bus lets settlement, webhooks, checking, and audits scale separately. The downside is more moving parts. Events may be delayed or fail. Retries may also create extra work. We accept this because payment state must stay correct, while background tasks can finish a little later.

Why Interviewers Ask This

The interviewer wants to see how you break a payment system into clear flows. They want to know whether you can prevent duplicate charges, route around processor failures, store money records safely, and move slower work into the background. They also want to hear clear trade-offs. A strong answer shows practical judgment rather than memorized service names.

Interviewer may ask next
How would this design handle one external payment processor becoming unavailable for several minutes?

I would keep the same design and use the failover rules in the Configuration Store. The Processor Router would stop sending new requests to the unhealthy processor. It would choose another supported External Payment Processor when the rules allow it.

The Payment Orchestrator would still control the payment state. It should not mark a payment as successful without a clear processor result. If the first request timed out, Auth + Idempotency would prevent a retry from creating another charge.

Observability & Monitoring would show rising errors and timeouts. Late callbacks would still return through the Processor Router. The Reconciliation Service could later check unclear payments against the processor state.

The main downside is that another processor may charge different fees or behave differently. Some payments may also remain pending while the final result is checked.

What happens if payment events are delayed or repeatedly fail on the Event Bus?

I would keep the main payment path unchanged. The Payment Service would still save payment state in the Transaction Store. The Payment Orchestrator would still record the money entry in the Ledger.

The delay would mainly affect the Settlement Service, Webhook Dispatcher, Reconciliation Service, and Audit Logs. These services would receive their work later, but the core payment record would remain available.

Observability & Monitoring should detect the growing delay. Failed processing would enter the Failed Events path. Retry with Backoff would try again with longer waits. Events that still fail would move to the DLQ for later review.

This stays correct because the Event Bus is not the main payment record. The downside is that merchants may receive webhooks late. Settlement, checking, and audit updates may also appear later than normal.

14. Design a delivery workflow system.System DesignHardAmazon

Question Details

Design a delivery workflow in which a delivery person scans products, updates delivery states, triggers emails, and uses an OTP or pictures for delivery confirmation.

Short Interview Answer (30-60 seconds)

At a high level, this system helps a delivery person scan products, update delivery states, notify the customer, and prove that delivery happened. The main challenge is keeping the state correct while supporting two proof choices. I would explain it in three flows: scan and update, state-change email, and delivery confirmation. The app sends scanned data through the services, while the Confirmation Manager handles OTP or picture proof. The trade-off is a clear workflow with more service-to-service steps.

Detailed Explanation

The system must move a delivery from product scanning to final proof. It must update the delivery state, return useful status to the driver, send a customer email after a state change, and accept either OTP or picture confirmation. The difficult part is keeping these actions in the correct order. The diagram organizes the design into a scan path, a notification path, and a confirmation path.

Useful Questions to Ask the Interviewer
  1. Which user flows and system capabilities are required for the first version?
  2. What traffic, data volume, latency, and availability targets should I design for?
  3. Which consistency, security, geographic, and cost constraints matter most?
Design a delivery workflow system. diagram
How to Explain It in an Interview
1. Explain the goal and the main idea

I would start by saying that the Delivery Person Mobile App begins the workflow. The driver scans products before changing the delivery state. The system then returns the current status to the same app.

A normal scan does not prove that the package reached the customer. Final confirmation therefore uses a separate Confirmation Manager. This component accepts either OTP proof or picture proof.

2. Explain the scan and state-update flow

For the scan path, the Delivery Person Mobile App sends “Scan products” to the Scan Service. The Scan Service passes “Scanned data” to the State Update Service. This service updates the delivery state.

The State Update Service sends “Status returned” back to the mobile app. This gives the driver a clear result. It also sends “State changed” to the State Change Event, which starts the email path.

3. Explain the state-change email flow

The State Change Event sends “Notify” to the Notification Trigger. The trigger sends “Send email” to the Email Service. The Email Service sends the “Delivery email” to the Customer or Recipient.

This path is separate from the status-return arrow. The diagram therefore keeps driver feedback and customer notification as two clear relationships. It does not show a queue, retry worker, or email failure rule, so I would not claim those features.

4. Explain the delivery-confirmation flow

When proof is needed, the State Update Service sends “Request confirmation” to the Confirmation Manager. The manager controls both proof choices.

For OTP, the Confirmation Manager sends the “OTP path” to the OTP Service. The OTP Service returns “OTP verified” to the manager.

For a picture, the manager sends the “Picture path” to the Photo Upload Service. That service saves the picture and returns “Photo saved” to the manager.

After either proof path succeeds, the Confirmation Manager sends “Store proof result” to the Delivery State Store. It then sends “Confirmed delivery” back to the State Update Service. This keeps final state handling with the State Update Service.

5. Explain trade-offs and missing failure rules

The benefit is that each component has one clear job. Scanning, state changes, email, and proof confirmation are easy to follow. The two proof paths also give the workflow more flexibility.

The downside is that final confirmation needs several service calls. The diagram does not define retries, timeouts, duplicate-request handling, or what happens when OTP and picture confirmation both fail. I would call these open design decisions instead of inventing behavior that is not shown.

Engineering Considerations / Design Trade-offs

The benefit is that every major step has a clear owner. The Scan Service handles scans. The State Update Service changes delivery state. The Confirmation Manager handles OTP and picture proof. This makes the workflow easy to explain and change. The downside is that confirmation needs several service calls. A slow proof step can delay the final state update. The email path is separate from the status-return path, which keeps both relationships clear. However, the diagram does not show retries, timeouts, or duplicate protection. Those rules would need separate design decisions.

Why Interviewers Ask This

Interviewers ask this question to see whether you can turn a real delivery process into clear system flows. They want to test how you separate scanning, state updates, customer notification, and proof of delivery. They also look for correct arrow direction, clear ownership, and honest trade-offs. A strong answer follows the diagram without inventing queues, databases, guarantees, or failure behavior that was never defined.

Interviewer may ask next
What would you change if the OTP Service is temporarily unavailable?

I would keep the same design, but I would not mark the delivery as confirmed while the OTP Service is unavailable. The affected path is the arrow from the Confirmation Manager to the OTP Service and the “OTP verified” return arrow.

The driver could use the existing picture path instead. The Confirmation Manager would send “Picture path” to the Photo Upload Service. After the service returns “Photo saved,” the manager would store the proof result in the Delivery State Store. It would then send “Confirmed delivery” to the State Update Service.

This keeps correctness because the final state still requires proof. It does not add a new component or change who owns confirmation. The main downside is that picture proof may take more time and data. The diagram does not show automatic fallback, so the product would need a clear rule telling the driver when to choose the picture path.

How would the design handle the same product scan being sent twice?

I would keep the same component roles and make sure each delivery update is handled as its own workflow. The State Update Service would still receive scanned data, return status to the mobile app, create the State Change Event, and request confirmation when proof is needed.

The important correctness rule is that “Confirmed delivery” must return from the Confirmation Manager before the State Update Service treats the delivery as complete. The proof result must also be sent to the Delivery State Store. Customer email still follows the State Change Event through the Notification Trigger and Email Service.

The diagram does not show duplicate-request protection. If the mobile app sends the same scan twice, the current design does not explain how to avoid two state changes or two emails. That rule would need to be added later. The downside is extra logic, but it prevents repeated updates from creating incorrect results.

15. Design a distributed rate limiter for services with different limits.API DesignHardAmazon

Question Details

Design a rate limiter for a distributed system in which different services can have different rate-limit values.

Short Interview Answer (30-60 seconds)

At a high level, I would place a distributed rate limiter behind the API Gateway. The gateway authenticates the caller, identifies the service and caller key, and asks the limiter for a decision. The limiter reads that service’s policy and atomically updates a shared counter. This supports separate limits, such as 100 requests per minute for Service A and 1,000 for Service C. Allowed requests reach the selected service and return through the gateway. Rejected requests receive HTTP 429 with Retry-After. The trade-off is consistent enforcement with extra storage latency and operational complexity.

Detailed Explanation

The goal is to enforce a different request limit for each backend service. The main challenge is keeping the decision consistent across distributed gateway nodes. I will follow the exact request, decision, response, storage, and logging flows shown.

Useful Questions to Ask the Interviewer
  1. Which clients and core use cases must the API support?
  2. What authentication, authorization, and data-validation rules should I assume?
  3. What scale, error handling, idempotency, and versioning requirements matter?
Design a distributed rate limiter for services with different limits. diagram
How to Explain It in an Interview
1. Start at the API Gateway boundary

I would first place API Gateway / Edge Nodes at the system boundary. Client Applications send an HTTP(S) request to the gateway.

The gateway authenticates the caller using JWT or mTLS. A JWT is a signed token that carries caller identity. mTLS is encrypted transport where both sides verify certificates.

The gateway identifies the caller using a user key or API key. It also extracts the target service and rate-limit key.

This responsibility belongs at the gateway. It can reject excess traffic before that traffic reaches a backend service.

2. Ask the Distributed Rate Limiter

The gateway sends a check-limit request to the Distributed Rate Limiter. The request includes the limit key and target service.

The limiter only evaluates the request. It does not forward business requests or return HTTP responses directly to clients.

The limiter reads the matching configuration from the Rate Limit Policy Store. The diagram shows DynamoDB as one possible store.

That store holds limits by service, plan, or consumer. It returns the limit value and time window to the limiter.

The visible examples use separate service limits. Service A allows 100 requests per minute. Service B allows 500 requests per minute. Service C allows 1,000 requests per minute.

3. Update the shared counter safely

The limiter then sends an atomic read-and-update operation to the Shared Counter Store. The diagram shows a Redis Cluster as one possible implementation.

Atomic means the counter check and update happen as one protected operation. This prevents separate limiter instances from independently consuming the same remaining quota.

The store keeps a counter with a TTL for each key. TTL means the counter expires when its time window ends.

The counter store returns the count and remaining quota. The limiter compares that result with the service’s configured limit.

Using one shared counter store gives distributed limiter instances a common source for quota state.

4. Continue the allowed request

When the request is within its limit, the limiter returns an Allow decision to API Gateway / Edge Nodes.

The gateway forwards the request to the selected backend service. It sends Service A traffic to Service A, Service B traffic to Service B, and Service C traffic to Service C.

The selected service processes the request and sends its response back to the gateway. Each response arrow points from the service toward the gateway.

The gateway then returns the HTTP response to Client Applications.

The Distributed Rate Limiter is not part of this business response path. Its job ends after returning the admission decision.

5. Return the over-limit response

When the configured limit is exceeded, the limiter returns Reject: over limit to the gateway.

The gateway does not forward that request to a backend service. It returns HTTP 429 Too Many Requests to Client Applications.

The response also includes Retry-After. This tells the client when another request may be attempted.

The gateway owns this client-facing error response. The limiter only owns the rate decision.

6. Record metrics and audit logs

The Distributed Rate Limiter emits metrics and logs to Metrics & Audit Logs. The diagram shows CloudWatch or OpenSearch as examples.

The recorded information includes allow and deny decisions, counts, and latency. This helps operators find hot keys, incorrect limits, and slow decisions.

The logging flow is separate from the business response path. Metrics & Audit Logs does not return the service response to the client.

7. Explain scaling and trade-offs

API Gateway / Edge Nodes and Distributed Rate Limiter instances can be distributed across the platform. They still use the same policy and counter stores shown in the diagram.

The benefit is centralized and consistent limit enforcement. Each service can have a different policy without implementing rate-limit logic inside every backend.

The downside is one limiter decision and one shared counter operation for each checked request. This adds latency and makes the shared stores important dependencies.

Local counters would be faster and simpler. However, separate nodes could then allow more total requests than the configured service limit.

Practical Complexity & Trade-offs

The benefit is one shared place for rate-limit decisions. Each backend service can have its own limit without adding this logic inside every service. Atomic counter updates reduce race conditions when requests arrive through many distributed nodes. The shared counter store also gives the limiter instances a common quota view. The downside is extra network and storage work for each request. The policy store and counter store become important dependencies. Redis can provide fast atomic counters, but it adds cluster operations and hot-key risks. DynamoDB can hold durable policies, but it also adds another system to manage. HTTP 429 and Retry-After give clients clear failure behavior. This design is safer and more consistent than local counters, but it costs more latency and operational effort.

Why Interviewers Ask This

Interviewers use this question to test distributed-system judgment rather than memorized definitions. They want clear ownership between the gateway, limiter, policy store, counter store, services, and logging system. They also check request and response directions, atomic counter handling, different service limits, and correct HTTP 429 behavior. A strong candidate explains the consistency, latency, availability, and operational trade-offs without adding unsupported components or guarantees.

Interviewer may ask next
What changes when traffic grows across many gateway and limiter nodes?

I would keep the same request flow and add more API Gateway / Edge Nodes and Distributed Rate Limiter instances. Every gateway still authenticates the caller, extracts the service and caller key, and asks the limiter for a decision. Every limiter still reads the matching policy and performs an atomic operation in the Shared Counter Store. This keeps the quota state shared across all distributed nodes. The keys must include the service and caller identity, so heavy Service C traffic does not consume Service A’s quota. The policy store, counter store, and metrics system must also handle the larger request rate. Allowed requests still reach the selected service. Rejected requests still return HTTP 429 with Retry-After through the gateway. The main downside is higher pressure on the Shared Counter Store. Popular callers or services can create hot keys. Scaling the compute nodes is simple, but scaling atomic shared state is harder and may increase latency.

How would you change Service B’s limit without affecting the other services?

I would change only Service B’s entry in the Rate Limit Policy Store. Service A and Service C would keep their existing policy values. The rest of the flow would remain unchanged. API Gateway / Edge Nodes would still extract the target service and caller key. The Distributed Rate Limiter would use that service value to read the matching policy. It would then atomically read and update the corresponding key in the Shared Counter Store. Authentication, request forwarding, backend responses, HTTP 429 handling, Retry-After, and metrics logging would remain the same. Correct separation depends on using the service as part of both the policy lookup and counter key. That prevents Service B’s configuration or usage from changing another service’s quota. The main downside is configuration management. A wrong policy value could block valid traffic or allow too much traffic. Policy changes therefore need validation, controlled access, and monitoring through the existing metrics and audit flow.

16. Design an API that takes and organizes order events from a web store.API DesignMediumAmazon

Question Details

Design an API that receives order events from a web store and organizes them for downstream processing.

Short Interview Answer (30-60 seconds)

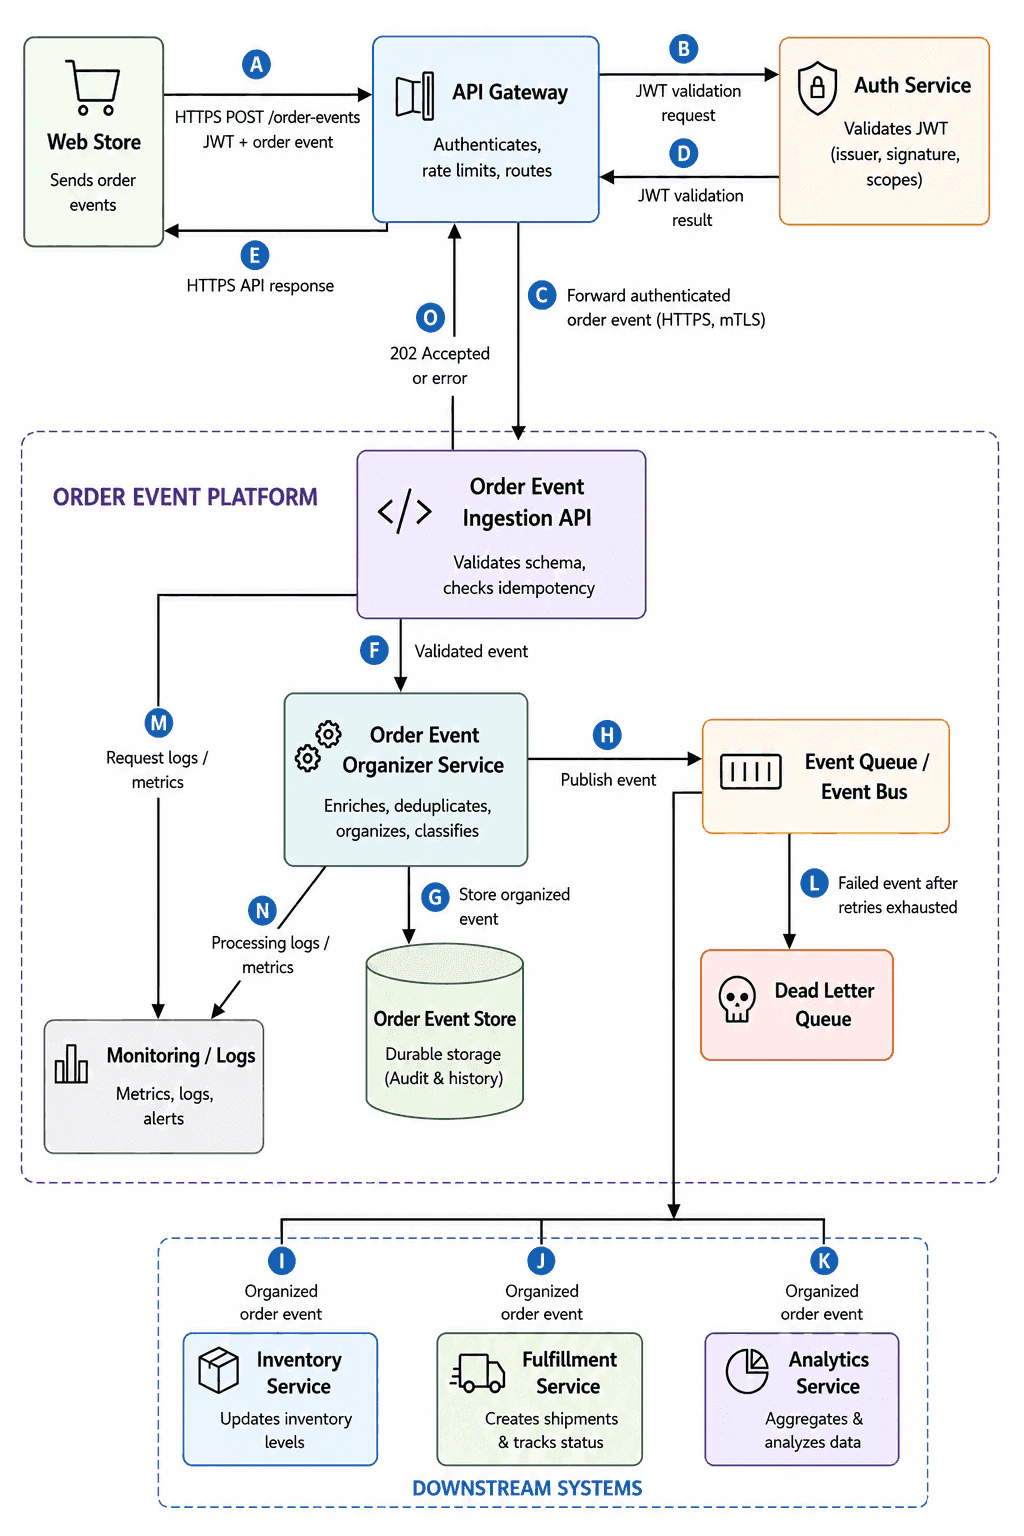
At a high level, I would build one secure API for receiving and organizing order events. The Web Store sends HTTPS POST /order-events with a JWT and an order event to the API Gateway. The gateway checks the JWT through the Auth Service, applies rate limits, and forwards the authenticated event using HTTPS and mTLS. The Ingestion API validates the schema and checks idempotency. The Organizer Service enriches, deduplicates, classifies, stores, and publishes the event. The API returns 202 Accepted or an error. The trade-off is fast acceptance, but downstream work finishes later.

Detailed Explanation

The goal is to receive order events safely and prepare them for downstream systems. The main challenge is accepting events quickly without losing validation or organization. I will explain the design by following the exact request, response, storage, and event flows.

Useful Questions to Ask the Interviewer
  1. Which clients and core use cases must the API support?
  2. What authentication, authorization, and data-validation rules should I assume?
  3. What scale, error handling, idempotency, and versioning requirements matter?
Design an API that takes and organizes order events from a web store. diagram
How to Explain It in an Interview
1. Define the API boundary

I would begin with the request entering the platform. The Web Store sends an HTTPS POST request to /order-events. The request contains a JWT and an order event. A JWT is a signed token that represents the caller. HTTPS encrypts the request while it travels across the network.

The API Gateway is the public entry point. It authenticates requests, applies rate limits, and routes traffic. Rate limiting controls how many requests a caller may send. This protects the platform from excessive traffic.

2. Validate the JWT

The API Gateway sends a JWT validation request to the Auth Service. This is separate from the order-event request. The Auth Service checks the token issuer, signature, and scopes. The issuer identifies who created the token. The signature shows that the token was not changed. The scopes describe the allowed access.

The Auth Service returns the JWT validation result to the API Gateway. The gateway forwards the order event only after successful validation. This keeps token checking at the edge of the platform.

3. Forward and validate the event

The API Gateway forwards the authenticated order event to the Order Event Ingestion API. This internal call uses HTTPS and mTLS. mTLS means both services verify each other using certificates. It also encrypts traffic between the services.

The Ingestion API validates the event schema. A schema defines required fields and expected data types. The API also checks idempotency. Idempotency prevents a repeated submission from creating an unwanted repeated result.

After successful validation, the Ingestion API sends a validated event to the Order Event Organizer Service. It also sends request logs and metrics to Monitoring / Logs.

4. Organize and store the event

The Order Event Organizer Service enriches the validated event. It adds useful context needed by downstream systems. It also deduplicates, organizes, and classifies the event.

The Organizer Service stores the organized event in the Order Event Store. The store provides durable audit and history data. Durable storage means the record remains available after a service restarts.

The Organizer Service sends processing logs and metrics to Monitoring / Logs. These records help operators understand processing health and failures.

5. Publish the event asynchronously

The Organizer Service publishes the event to the Event Queue / Event Bus. This separates API acceptance from downstream processing. The Web Store does not wait for every consumer to finish.

The Event Queue / Event Bus sends organized order events to three consumers. Inventory Service updates inventory levels. Fulfillment Service creates shipments and tracks status. Analytics Service aggregates and analyzes the event data.

If an event still fails after retries are exhausted, it moves to the Dead Letter Queue. The failed event is separated from the normal downstream flow.

6. Return the API response

The Order Event Ingestion API returns 202 Accepted or an error to the API Gateway. The API Gateway then returns the HTTPS API response to the Web Store.

A 202 Accepted response means the platform accepted the order event. It does not mean inventory, fulfillment, or analytics processing has finished.

The benefit is a fast and decoupled API. Each downstream service can process events at its own pace. The downside is delayed completion and more operational work. We accept this trade-off because the Web Store should not wait for all downstream actions.

Practical Complexity & Trade-offs

The benefit is a clear split between receiving events and processing them. The API Gateway handles authentication, rate limits, and routing. The Auth Service validates the JWT. The Ingestion API checks the schema and idempotency. These checks reduce invalid and repeated submissions. HTTPS and mTLS protect the internal request, but certificate management adds work. The Event Queue / Event Bus lets downstream services work independently. This improves speed and scaling, but 202 Accepted does not mean processing is complete. The Dead Letter Queue separates events that still fail after retries. Monitoring helps teams find request and processing problems. The downside is more services, more logs, and more operational effort. We accept this complexity for safer and more reliable event processing.

Why Interviewers Ask This

Interviewers use this question to test API boundaries and engineering judgment. They want correct request and response directions. They also check whether the candidate separates authentication, validation, organization, storage, asynchronous delivery, and monitoring. A strong answer explains JWT validation, mTLS, idempotency, rate limiting, durable storage, retries, and dead-letter handling without mixing component ownership. The interviewer also expects a clear explanation of why 202 Accepted improves response speed but does not confirm completed downstream work.

Interviewer may ask next
How would this design handle a large traffic spike from the Web Store?

I would keep the same request flow and scale the existing processing components. The Web Store would continue sending HTTPS POST /order-events requests to the API Gateway. The gateway would keep validating callers and applying rate limits. Rate limits protect the platform when incoming traffic exceeds an allowed level.

The Order Event Ingestion API could use more instances to perform schema and idempotency checks in parallel. The Order Event Organizer Service could also scale to handle more enrichment, deduplication, organization, and classification work.

The Event Queue / Event Bus would buffer organized events when downstream consumers are slower. Inventory Service, Fulfillment Service, and Analytics Service could process that backlog at their own rates. The Order Event Store would continue keeping durable audit and history records. Monitoring / Logs would show request volume and processing delay.

The security and correctness rules would not change. JWT validation, mTLS, schema validation, and idempotency would still apply. The main downside is that a large backlog increases downstream delay. A 202 Accepted response may return long before all downstream work finishes.

What happens when a downstream service keeps failing to process an event?

The Event Queue / Event Bus would continue the retry behavior shown in the design. When retries are exhausted, the failed event moves to the Dead Letter Queue. It no longer stays in the normal delivery flow. Other organized order events can still reach Inventory Service, Fulfillment Service, and Analytics Service.

The original API request path remains unchanged. The Web Store still sends HTTPS POST /order-events through the API Gateway. The JWT is still validated by the Auth Service. The Ingestion API still checks the schema and idempotency. The Organizer Service still enriches, deduplicates, stores, and publishes the event.

The earlier 202 Accepted response confirms only that the platform accepted the event. It does not guarantee successful downstream processing. Monitoring / Logs records request and processing information. The Order Event Store keeps the durable audit and history record.

The main downside is delayed recovery for the failed downstream action. The dead-letter event needs later investigation or handling outside the normal flow.

17. Design customer reviews for products on Amazon.API DesignMediumAmazon

Question Details

Create the low-level design for a feature that stores and serves customer reviews for Amazon products.

Short Interview Answer (30-60 seconds)

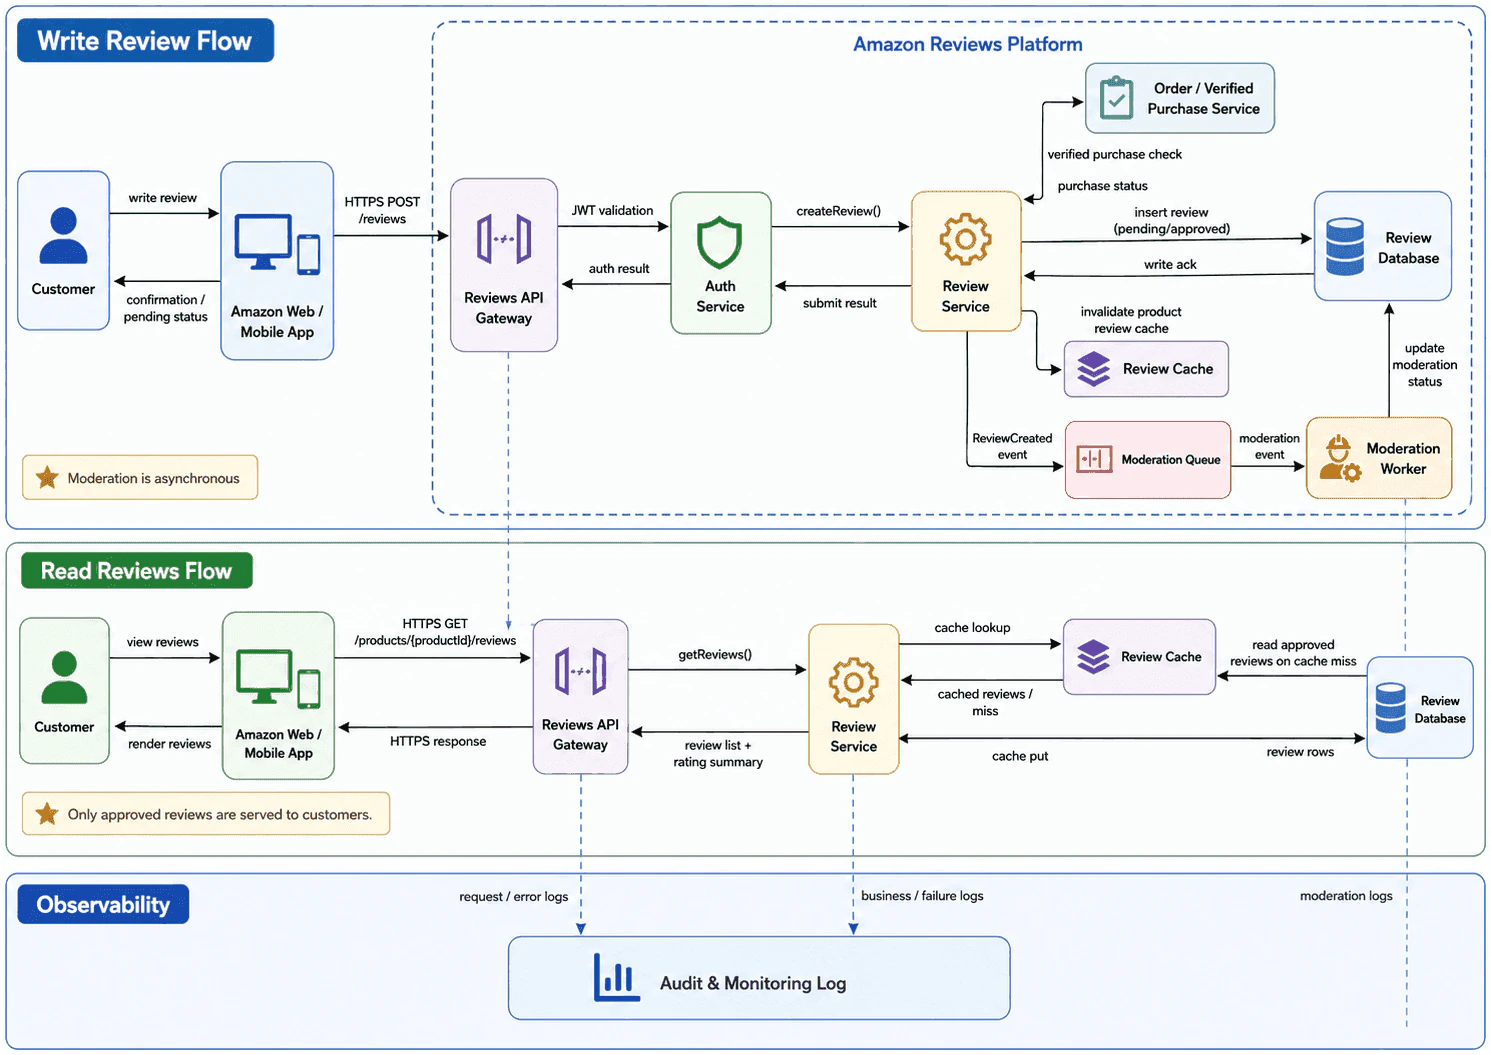
At a high level, I would separate the design into a write flow, a read flow, and observability. A customer submits a review through the Amazon web or mobile app. The Reviews API Gateway sends the JWT for validation, then the Review Service checks the purchase, stores the review, clears the product cache, and sends a moderation event. Reads use GET /products/{productId}/reviews, check the review cache first, and fall back to the database. Only approved reviews are returned. The trade-off is extra moderation and caching complexity for safer and faster reads.

Detailed Explanation

The goal is to store product reviews and serve approved reviews quickly. The main challenge is balancing write safety, moderation, and fast reads. I will follow the write, read, and logging flows shown in the diagram.

Useful Questions to Ask the Interviewer
  1. Which clients and core use cases must the API support?
  2. What authentication, authorization, and data-validation rules should I assume?
  3. What scale, error handling, idempotency, and versioning requirements matter?
Design customer reviews for products on Amazon. diagram
How to Explain It in an Interview
1. Define the API boundary

I would begin with the Amazon Reviews Platform boundary. The customer uses the Amazon Web or Mobile App. The Reviews API Gateway is the public backend entry point. The Review Service owns the main review logic. The platform also contains authentication, purchase verification, cache, database, moderation, and monitoring components. This separation keeps each responsibility easy to explain.

2. Submit a review

The customer first writes a review in the Amazon app. The app sends HTTPS POST /reviews to the Reviews API Gateway. The gateway sends the JWT to the Auth Service for validation. A JWT is a signed token that carries the caller identity. The Auth Service returns the authentication result. The request then reaches the Review Service through createReview(). The Review Service checks the Order or Verified Purchase Service. That service returns the purchase status. This lets the platform mark a review as linked to a verified purchase.

3. Store the review and return the result

The Review Service inserts the review into the Review Database. The diagram shows the review stored as pending or approved. The database returns a write acknowledgement. The Review Service also invalidates the product review cache. Invalidation removes old cached review data for that product. The Review Service returns the submit result. The gateway sends the response back to the app. The app then shows a confirmation or pending status to the customer.

4. Moderate reviews asynchronously

Moderation runs outside the main write response. The Review Service publishes a ReviewCreated event to the Moderation Queue. The queue sends the moderation event to the Moderation Worker. The worker checks the review and updates its moderation status in the Review Database. This is asynchronous, which means the customer does not wait for moderation. The benefit is a faster submit response. The downside is that a new review may stay pending for some time.

5. Read approved reviews

To view reviews, the app sends HTTPS GET /products/{productId}/reviews. The Reviews API Gateway calls getReviews() on the Review Service. The Review Service checks the Review Cache first. The cache returns either cached reviews or a miss. On a miss, the service reads approved reviews from the Review Database. The database returns the review rows. The service then places the result in the Review Cache. It returns the review list and rating summary to the gateway. The gateway sends the HTTPS response to the app. The app renders the reviews for the customer. Only approved reviews are served.

6. Record logs and explain the trade-off

The Reviews API Gateway sends request and error logs to the Audit and Monitoring Log. The Review Service sends business and failure logs there. The Moderation Worker sends moderation logs there. These logs support troubleshooting and audit work. The main trade-off is extra system complexity. The cache improves read speed, while moderation protects review quality. We accept more components because the customer experience becomes safer and faster.

Practical Complexity & Trade-offs

The benefit of this design is clear ownership. The API Gateway receives requests. The Auth Service checks the JWT. The Review Service owns review logic. The purchase service confirms whether the customer bought the product. The cache makes repeated reads faster. The downside is that cached data must be invalidated after writes. Moderation is safer, but it delays when a review becomes visible. The queue keeps moderation outside the request path, so review submission stays fast. The database remains the main source of stored review data. Logs help find failures, but they add storage and operational work. We accept this complexity because only approved reviews should be shown, and popular product pages need quick responses.

Why Interviewers Ask This

Interviewers use this question to test API boundaries, request and response flow, authentication, caching, asynchronous work, and data ownership. They want to see whether the candidate separates submission from moderation and reads from writes. They also evaluate cache-miss handling, verified-purchase checks, observability, and trade-off communication. A strong answer explains why every component exists without adding unsupported endpoints or guarantees.

Interviewer may ask next
How would this design handle a very popular product with heavy review traffic?

I would keep the same read flow and rely more heavily on the Review Cache. The affected endpoint is GET /products/{productId}/reviews. The Review Service still checks the cache first. A cache hit returns the review list without reading the database. On a cache miss, the service reads approved review rows from the Review Database and then performs a cache put. The write flow stays unchanged. When a new review is stored, the Review Service invalidates that product's cached review data. Only approved reviews are returned, so moderation rules do not change. The gateway, service, and worker continue sending their existing logs. The main downside is that cache invalidation becomes more important under heavy traffic. A stale cache could briefly show old review data until the new value is loaded.

What happens if moderation is slow or temporarily unavailable?

I would keep review submission available because moderation is already asynchronous. The affected flow starts when the Review Service sends the ReviewCreated event to the Moderation Queue. If the Moderation Worker is slow, the review remains pending in the Review Database. The write response still returns through the Reviews API Gateway to the app. The customer may continue to see a pending status. The read flow remains safe because only approved reviews are served. The worker updates the moderation status when it later processes the event. Moderation logs continue to go to the Audit and Monitoring Log. The main downside is delayed review visibility. The diagram does not show retries or a fallback worker, so I would not claim those behaviors.

18. Design a URL shortener.API DesignHardAmazon

Question Details

Design a URL-shortening service and discuss its services, database schema, cache, CDN, scheduled work, and data archival.

Short Interview Answer (30-60 seconds)

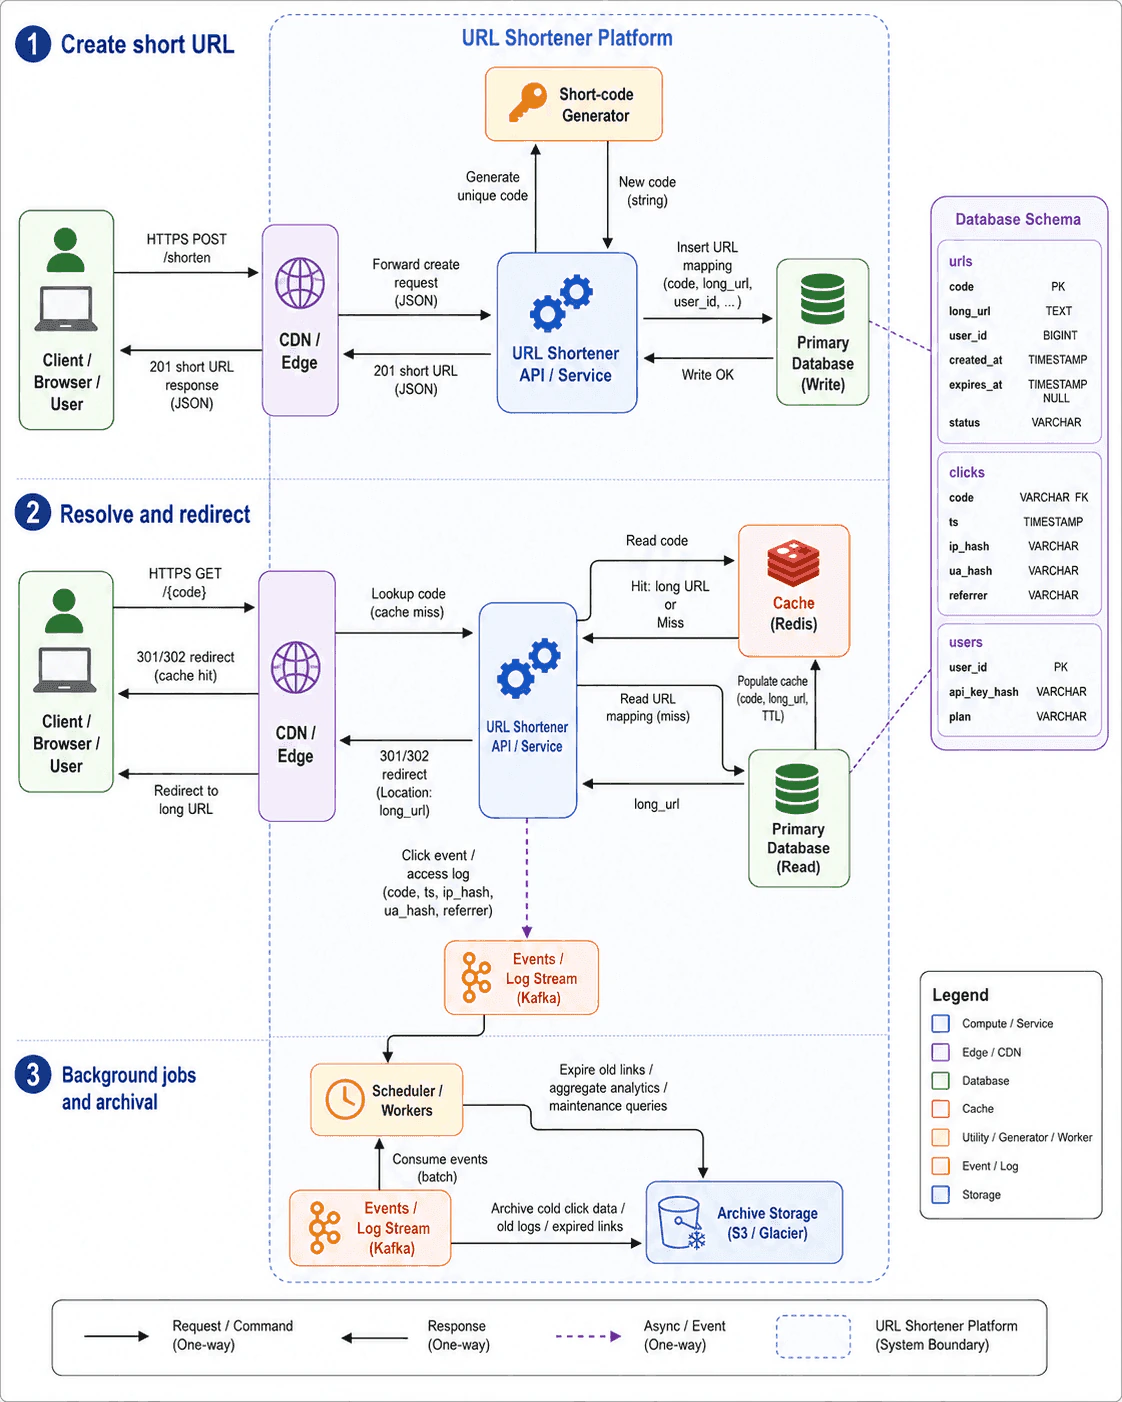
At a high level, I would place a CDN before a URL Shortener API. The client sends HTTPS POST /shorten. The CDN forwards the JSON request, and the service generates a unique code, stores the mapping, and returns a 201 short URL response. For HTTPS GET /{code}, the CDN serves a cached 301 or 302 redirect when possible. A miss reaches the service, Redis, and the primary database. Click events go to Kafka, while workers expire links, aggregate analytics, and archive old data. The trade-off is more operational complexity for faster redirects.

Detailed Explanation

The goal is to create short links and redirect users quickly. The main challenge is keeping lookups fast while storing correct mappings. I will follow the create, redirect, data, and background paths shown in the diagram.

Useful Questions to Ask the Interviewer
  1. Which clients and core use cases must the API support?
  2. What authentication, authorization, and data-validation rules should I assume?
  3. What scale, error handling, idempotency, and versioning requirements matter?
Design a URL shortener. diagram
How to Explain It in an Interview
1. Start with the platform boundary

I would place a CDN or Edge layer before the URL Shortener API. The client sends HTTPS requests to this public edge. The CDN forwards create requests and can return cached redirects. The URL Shortener API owns the main application workflow. The dashed boundary marks the internal URL Shortener Platform.

2. Create a short URL

The client sends HTTPS POST /shorten to the CDN or Edge. The CDN forwards the create request as JSON to the URL Shortener API. The service asks the Short-code Generator to create a unique code. The generator returns the new code as a string.

The service then inserts the URL mapping into the Primary Database. The diagram shows code, long_url, and user_id in this write. The database returns Write OK to the service. The service sends a 201 short URL JSON response to the CDN. The CDN returns the 201 short URL response to the client. The request and response use separate one-way arrows.

3. Resolve and redirect a short URL

The client sends HTTPS GET /{code} to the CDN or Edge. For a cache hit, the CDN returns a 301 or 302 redirect directly. This is the shortest path because it avoids the core service.

For a cache miss, the CDN sends Lookup code to the URL Shortener API. The service sends Read code to Redis. A cache hit returns the long URL to the service. A miss makes the service read the URL mapping from the Primary Database. The database returns long_url. The service then populates Redis with the code, long URL, and TTL.

The service returns a 301 or 302 redirect to the CDN. The response carries Location: long_url. The CDN sends the redirect back to the client. The client then visits the original long URL.

4. Model the database schema

The urls table stores code as the primary key. It also stores long_url, user_id, created_at, expires_at, and status. The clicks table stores code, timestamp, hashed IP, hashed user agent, and referrer. The users table stores user_id, api_key_hash, and plan.

This schema separates URL ownership from click history. The Primary Database is the source of truth for URL mappings. It supports writes during creation and reads after cache misses.

5. Keep click logging asynchronous

The URL Shortener API sends click events and access logs to Kafka. The event contains code, timestamp, IP hash, user-agent hash, and referrer. This flow is asynchronous, so it does not block the redirect response. That keeps the user-facing path fast.

6. Run scheduled work and archival

The Events or Log Stream supplies event batches to the scheduled worker flow. The Scheduler or Workers expire old links, aggregate analytics, and run maintenance queries. Cold click data, old logs, and expired links move to Archive Storage. The diagram shows S3 or Glacier as examples.

This keeps old data outside the main request path. It also reduces pressure on the Primary Database.

7. Explain the main trade-off

The benefit is fast redirects and fewer database reads. The CDN and Redis handle hot lookups. Kafka and workers keep analytics work outside the response path. The downside is more components to operate. The team must manage cache entries, event batches, background jobs, and archival storage.

Practical Complexity & Trade-offs

The API is simple because it uses two visible routes: HTTPS POST /shorten and HTTPS GET /{code}. The benefit is a clear client contract. The CDN and Redis reduce repeated database reads and speed up redirects. The downside is stale cache risk and more operational work. The Primary Database remains the source of truth for URL mappings. Kafka keeps click logging outside the response path. This improves response time, but analytics may arrive later. Scheduled workers expire links and aggregate analytics. Archive Storage keeps cold click data, old logs, and expired links away from the main database. This lowers storage pressure, but old data is slower to access. We accept these trade-offs because redirect speed is the main goal.

Why Interviewers Ask This

Interviewers ask this question to test system-design judgment rather than memorization. They check whether the candidate can model create and redirect flows correctly. They also look for clear request and response directions, sensible component ownership, a useful database schema, and correct cache fallback behavior. A strong answer explains asynchronous logging, scheduled work, archival, scaling choices, and operational trade-offs without inventing unsupported endpoints, failures, or guarantees.

Interviewer may ask next
How would this design handle a very popular short URL?

I would keep the same HTTPS GET /{code} flow and rely more on the existing cache layers. The CDN should return the 301 or 302 redirect directly when its edge cache has the code. That avoids the URL Shortener API, Redis, and Primary Database.

If the CDN misses, the request still reaches the URL Shortener API. The service checks Redis before reading the Primary Database. A Redis hit returns the long URL quickly. A database read happens only when both cache layers miss. The service then populates Redis for later requests.

The click event still goes to Kafka. Workers process those events later, so the redirect response stays fast. The main downside is more cache pressure and more copies of the same mapping. The Primary Database remains the source of truth. This keeps the existing correctness model while allowing the hot path to scale.

How would you handle expired links and old click data?

I would use the existing background-job and archival flow. The Scheduler or Workers would use expires_at and status from the urls table when expiring old links. They would also run the maintenance and analytics work shown in the diagram.

The redirect path remains unchanged. The CDN still receives HTTPS GET /{code}, and a cache miss still reaches the service. The service reads Redis and then the Primary Database when needed. An expired mapping should no longer be treated as an active redirect. The diagram does not show a specific error response, so I would not invent one.

Workers also consume event batches from Kafka. Cold click data, old logs, and expired links move to S3 or Glacier. The main downside is delayed cleanup because scheduled work is not immediate. We accept that delay because background processing keeps the user request path fast.

19. Design autocomplete and search recommendations for Amazon Search.API DesignHardAmazon

Question Details

Design autocomplete or search recommendations for Amazon Search when a ranking algorithm is already provided.

Short Interview Answer (30-60 seconds)

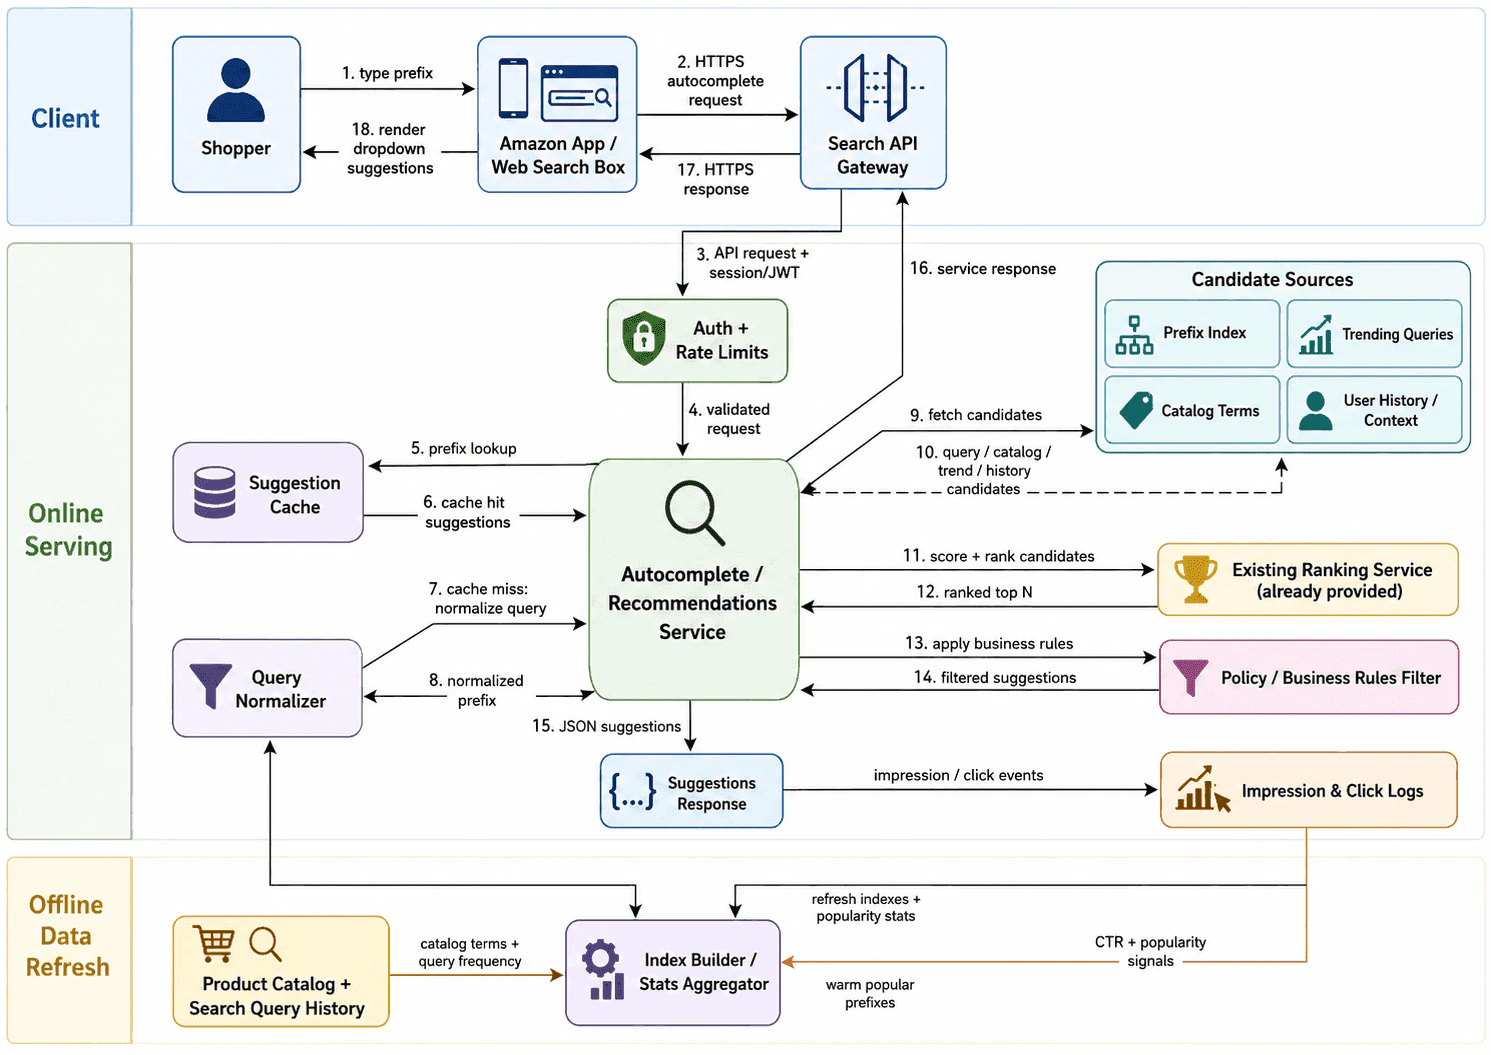
At a high level, I would place a low-latency autocomplete service behind the Amazon search box. The request passes through the Search API Gateway, then Auth plus Rate Limits. The service checks the Suggestion Cache first. On a miss, it normalizes the prefix and collects candidates from prefix, trend, catalog, and user-context sources. The provided ranking service orders them, and business rules filter the result. The JSON response returns through the gateway. Offline logs refresh indexes and popularity data. The main trade-off is faster cached answers versus slightly older suggestions.

Detailed Explanation

The goal is to return useful suggestions while the shopper is still typing. The main challenge is balancing low response time with fresh and relevant results. I will follow the numbered online flow, then explain the offline refresh path.

Useful Questions to Ask the Interviewer
  1. Which clients and core use cases must the API support?
  2. What authentication, authorization, and data-validation rules should I assume?
  3. What scale, error handling, idempotency, and versioning requirements matter?
Design autocomplete and search recommendations for Amazon Search. diagram
How to Explain It in an Interview
1. Receive and validate the request

I would start when the shopper types a prefix. The Amazon App or Web Search Box sends an HTTPS autocomplete request to the Search API Gateway.

The gateway forwards the API request with the session or JWT to Auth plus Rate Limits. A JWT is a signed token that can describe the current session. This component checks the request and limits excessive traffic.

After validation, it sends the validated request to the Autocomplete or Recommendations Service. The diagram does not define a literal route, HTTP method, response code, or request body, so I would not invent them.

2. Check the suggestion cache

The service first sends a prefix lookup to the Suggestion Cache. This is the fastest path for common prefixes.

When the cache contains a result, it returns cache hit suggestions to the service. The service can then continue toward the response path without collecting and ranking a new candidate set.

When the cache misses, the service sends the input to the Query Normalizer. The label says "cache miss: normalize query." The normalizer returns a normalized prefix.

Normalization makes equivalent input easier to process consistently. The diagram does not specify the exact normalization rules.

3. Collect candidate suggestions

The service sends a fetch candidates request to Candidate Sources. That group contains the Prefix Index, Trending Queries, Catalog Terms, and User History or Context.

The Prefix Index supports direct prefix matches. Trending Queries add currently popular searches. Catalog Terms add product-related words. User History or Context adds signals related to the current shopper or session.

Candidate Sources returns query, catalog, trend, and history candidates to the service. These are possible suggestions. They are not yet the final ordered list.

4. Rank and apply business rules

The service sends the candidates to the Existing Ranking Service with the contract "score + rank candidates." The ranking algorithm is already provided, so this design treats it as a separate dependency.

The ranking service returns the ranked top N candidates. The service then sends them to the Policy or Business Rules Filter.

That filter applies business rules and returns filtered suggestions. This separation is useful because ranking quality and business policy can change independently.

If ranking is unavailable, the diagram shows a dashed fallback to popular prefix results from Candidate Sources. This keeps suggestions available, but the ordering may be less relevant.

5. Return the response

The service produces JSON suggestions and passes them through the Suggestions Response component. JSON is a text format for structured data.

The Suggestions Response sends the service response to the Search API Gateway. The gateway sends the HTTPS response back to the Amazon App or Web Search Box.

The search box renders the dropdown suggestions for the shopper. Request and response remain separate flows, so each direction is easy to trace.

6. Record events and refresh data offline

The design records impression and click events in Impression and Click Logs. An impression means a suggestion was shown. A click means the shopper selected it.

Product Catalog plus Search Query History sends catalog terms and query frequency into the Index Builder or Stats Aggregator. The logs also provide click-through rate and popularity signals.

The builder refreshes indexes and popularity statistics in Candidate Sources. It also warms the Suggestion Cache with popular prefixes.

This work happens outside the direct request path. That keeps heavy aggregation away from the shopper-facing response.

7. State the trade-offs

Caching reduces response time and protects downstream services. Its downside is that cached suggestions may be slightly stale.

Using several candidate sources improves coverage and relevance. It also increases data and operational complexity.

The fallback improves availability during ranking failure. However, popular prefix results may be less personalized and less accurately ordered.

Practical Complexity & Trade-offs

The benefit of the cache is speed. Common prefixes can return without running the full candidate and ranking flow. The downside is freshness because cached suggestions may be older. Several Candidate Sources improve coverage. They also require more data updates and careful coordination. The provided ranking service keeps ranking separate from the API service. This makes ownership clear, but it adds a dependency. The business-rules filter gives policy control after ranking. It also adds another processing step. Auth plus Rate Limits protects the service from invalid or excessive requests. Offline aggregation keeps heavy work away from shoppers. The fallback to popular prefixes improves availability when ranking fails. The downside is lower relevance. We accept these costs because autocomplete must remain fast and dependable.

Why Interviewers Ask This

Interviewers use this question to test API boundaries and low-latency design judgment. They want correct request and response directions. They also check whether the candidate separates caching, normalization, candidate generation, ranking, policy filtering, logging, and offline updates. A strong answer explains the fallback without inventing unsupported behavior. It also shows practical thinking about speed, freshness, availability, rate limiting, and operational complexity.

Interviewer may ask next
What should the system do when the existing ranking service is unavailable?

I would use the fallback already shown in the diagram. The Autocomplete or Recommendations Service would still perform the cache lookup, normalize the prefix when needed, and fetch candidates from Candidate Sources. If the Existing Ranking Service cannot return ranked top N results, the service would use popular prefix results instead. The Policy or Business Rules Filter would still process those fallback suggestions before the response is returned. The JSON response would then travel through the same Suggestions Response and Search API Gateway path. Impression and click activity would still be recorded so the offline system can continue learning from user behavior. The main benefit is availability. Shoppers still receive useful suggestions during a ranking outage. The main downside is lower quality. Popular results may ignore some user context, and their ordering may be weaker than the normal ranked list. All other parts of the design remain unchanged.

How would this design handle a traffic spike for a very popular prefix?

I would keep the same architecture and rely on the Suggestion Cache plus Auth and Rate Limits. A popular prefix should usually have cached suggestions because the Index Builder or Stats Aggregator warms popular prefixes offline. The Autocomplete or Recommendations Service first performs the normal prefix lookup. On a cache hit, it avoids query normalization, candidate collection, and the ranking call. This reduces load on Candidate Sources and the Existing Ranking Service. Auth plus Rate Limits continues controlling excessive request volume before traffic reaches the service. The response still returns through Suggestions Response, the Search API Gateway, and the Amazon search box. Impression and click events continue feeding the offline data path. The main downside is freshness. A heavily cached prefix may not show the newest trend immediately. We accept that small delay because fast and stable autocomplete is more important during a traffic spike.

20. How would you test a computer's temperature?TestingMediumAmazon

Question Details

Describe how you would test a computer temperature-reading feature or system, including relevant test scenarios and follow-up considerations.

Short Interview Answer (30-60 seconds)

I would test the Python temperature monitoring logic with controlled sensor values, then run integration tests with a real sensor adapter and approved test hardware. I would compare each sensor with a trusted sensor or test tool. I would cover idle load, heavy load, rapid changes, cooling problems, cold start, sleep, wake, reboot, invalid readings, exact warning boundaries, short spikes, and sustained overheating. I would assert the reading, unit, update interval, warning state, fan request, shutdown request, recovery, and error handling. The main tradeoff is that controlled tests are fast and deterministic, but only real hardware tests can confirm sensor accuracy, driver behavior, and the complete cooling path.

Detailed Explanation

I would begin by defining the exact behavior and test boundary. The main system under test is the Python component that reads computer temperature data, validates the value, converts the unit when required, stores or publishes the latest reading, and decides whether to do nothing, increase cooling, show a warning, or request a safe shutdown. The physical sensor, operating system sensor interface, fan controller, and shutdown service are outside the unit test boundary.

Useful Questions to Ask the Interviewer
  1. What behavior and test boundary should I cover?
  2. Which dependencies, environments, and test tools should I assume?
  3. Which failures, edge cases, and quality risks are most important?

I would first confirm what temperature is being measured. A computer can expose separate CPU, GPU, motherboard, storage, and battery sensors. Each sensor should be tested separately because one correct reading does not prove that every sensor is mapped correctly. I would also confirm whether the feature uses Celsius, Fahrenheit, or both.

For Python unit tests, I would replace the sensor reader with a stub that returns controlled values. A stub is a small replacement that gives known data. I would replace the clock when the behavior depends on an update interval or on how long the temperature stays above a limit. I would use small function scoped pytest fixtures so every test receives a fresh monitor, fresh sensor stub, controlled clock, and fresh action recorders. This prevents one test from leaking alert or timing state into another test.

I would start with normal behavior. An idle case should return a stable normal reading and no warning. A heavy load sequence should rise smoothly and request faster cooling when the specification requires it. When the feature supports both units, I would verify correct Celsius and Fahrenheit conversion. I would also verify that the value updates at the expected interval and that a new valid reading replaces the previous reading.

I would test different physical conditions. These include a normal fan, a slow fan, a stopped fan, and a blocked cooling path. The temperature should rise in a believable direction under poor cooling. After cooling is restored, the readings should fall and the warning state should recover according to the approved rules. The test should not report successful cooling if the fan action failed.

I would test lifecycle events such as cold start, sleep, wake, and reboot. After each event, the correct sensors should be discovered again, readings should resume, stale values should not be presented as current values, and the program should not crash or lose required state.

Boundary tests are essential. I would send values just below, exactly at, and just above each warning and shutdown limit. This catches incorrect comparison rules. The expected result at the exact limit must come from the product specification. I would not invent whether the rule uses greater than or greater than or equal to.

I would test a short temperature spike with controlled time. The spike should be recorded, but it should not cause an unsafe false shutdown when the approved rule requires the value to remain high for a set duration. I would then test sustained overheating. A value that remains above the safe limit for the required time should create the correct warning and then request safe shutdown.

I would test rapid changes by sending a clear sequence that rises, falls, and rises again. I would assert that the readings follow the sequence without unexplained false jumps. I would avoid fixed sleep calls. Instead, I would advance a controlled clock by exact amounts so the result is deterministic.

Failure cases should include missing data, a nonnumeric value, an impossible low value, an impossible high value, a stale timestamp, and a sensor exception. The system should reject invalid readings, expose a clear sensor error, avoid crashing, and avoid silently treating an invalid value as safe. Keeping the last trusted reading is acceptable only when the product specification requires it, and the interface should still show that the current sensor data is unavailable.

I would assert visible behavior and required interactions. The assertions can include the accepted reading, sensor identity, unit, timestamp, update interval, warning state, cooling request, shutdown request, recovery state, and error result. I would use a mock when I need to verify an interaction, such as confirming that the fan controller was called once with the expected level. I would patch the dependency where the monitoring module looks up that dependency.

Each test should clean up its state. Pytest fixtures and monkeypatch can restore replaced functions, clocks, environment values, and temporary files. Hardware tests should return the computer or test device to a safe temperature and normal cooling state after execution.

Unit tests do not prove that the real hardware works. I would add integration tests using the real sensor adapter on a controlled machine, hardware simulator, or approved lab device. These tests should confirm that Python receives the correct sensor values, identifies CPU, GPU, and board sensors correctly, handles operating system permissions, and sends the correct command to the real or controlled cooling and shutdown interface.

I would compare real readings with a trusted external sensor or approved test tool. This checks sensor accuracy and calibration. A software stub cannot validate physical calibration.

In CI, the fast unit suite should run on every change. Hardware integration tests can run on a dedicated runner or scheduled lab job because they may require exclusive device access, controlled load generation, and safe cleanup. Results should be based on observable conditions and controlled time rather than real waiting.

I would not test private implementation details that are not part of the required behavior. I would also not claim that high code coverage proves correct thermal safety behavior. Correct boundaries, reliable sensor integration, failure cases, and safe actions matter more.
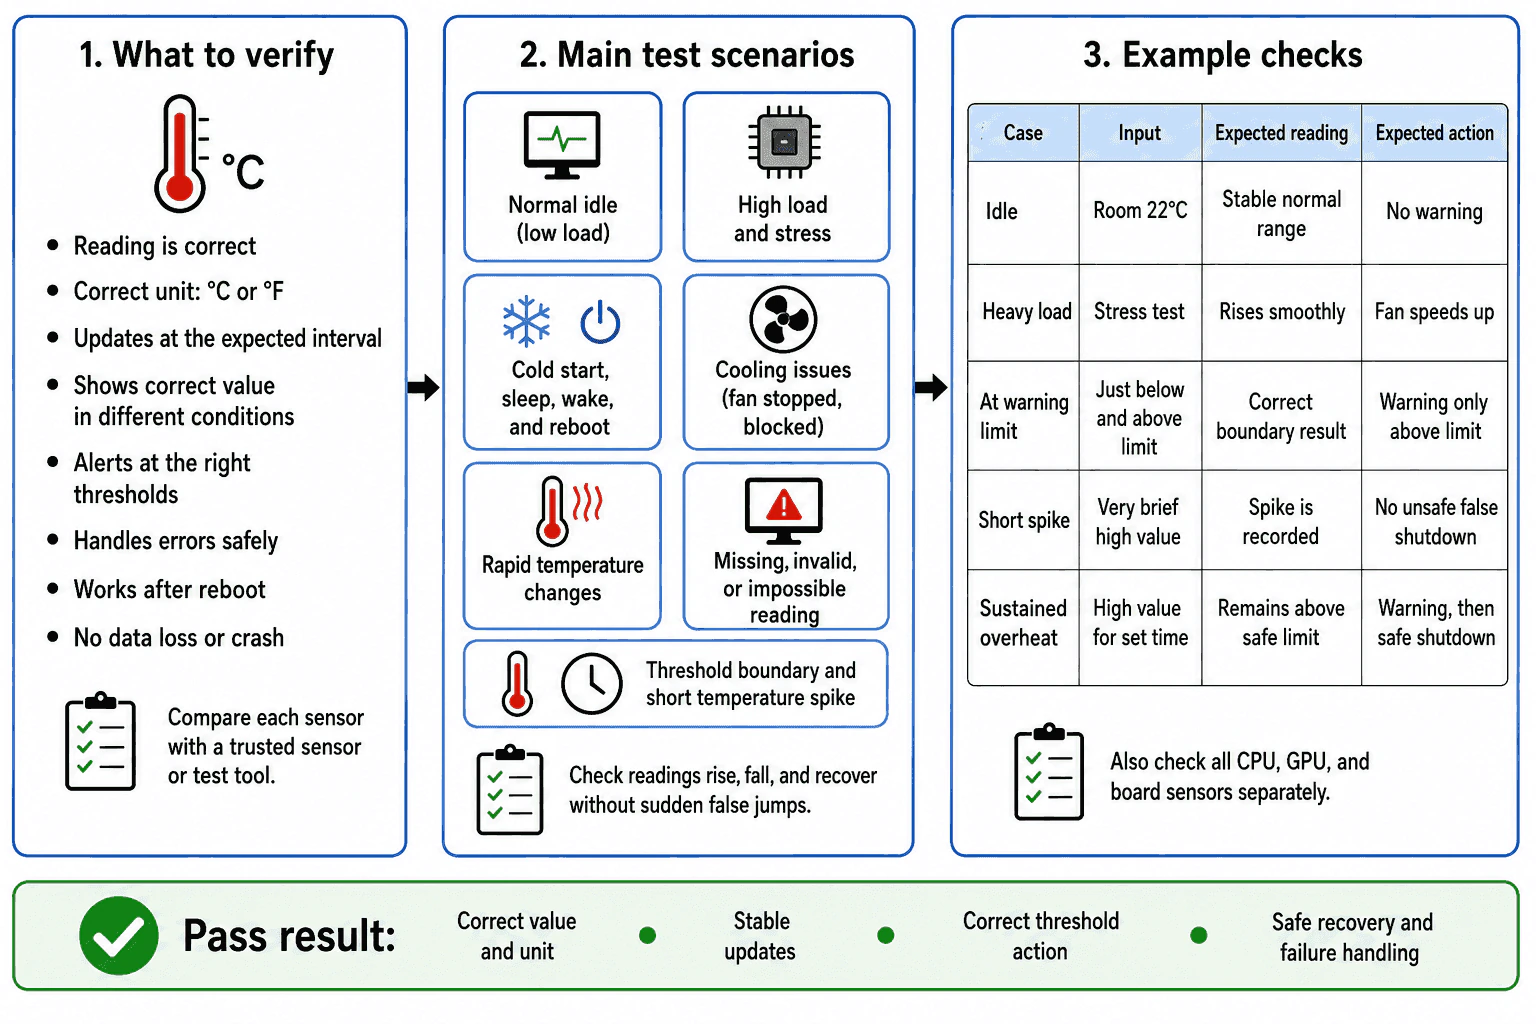
How would you test a computer's temperature? diagram
Technical Approach
  1. Identify every supported sensor, unit, update interval, warning limit, shutdown limit, and required duration above each limit.
  2. Define the Python monitoring logic as the unit test boundary.
  3. Use integration tests for the real sensor adapter, operating system interface, cooling controller, and shutdown path.
  4. Create function scoped fixtures for a fresh monitor, sensor stub, controlled clock, and action recorders.
  5. Compare real sensor readings with a trusted sensor or approved test tool.
  6. Test idle load, heavy load, rapid changes, normal cooling, slow cooling, blocked cooling, and stopped cooling.
  7. Test cold start, sleep, wake, and reboot behavior.
  8. Test correct units and the expected update interval.
  9. Test values just below, exactly at, and just above every warning and shutdown boundary.
  10. Test a short spike and sustained overheating with controlled time.
  11. Test missing, invalid, impossible, stale, and exception producing sensor results.
  12. Assert the reading, sensor identity, unit, timestamp, warning, fan action, shutdown action, recovery, and error result.
  13. Restore all patched dependencies and return hardware to a safe state.
  14. Run unit tests on every CI change and hardware integration tests on a controlled runner.
Practical Complexity & Trade-offs

Algorithmic complexity is not the main concern because each test usually processes a small sequence of readings. Unit tests have low runtime and memory cost. The main cost comes from the number of sensors, units, boundaries, timing cases, and failure combinations. A controlled clock keeps time based tests fast because the test does not wait in real time. Hardware integration tests cost more because they require a device, load generation, trusted measurement equipment, exclusive access, safe cooling, cleanup, and longer CI execution. They also need maintenance when operating system drivers or hardware models change.

Where it is used

This testing approach is used in desktop monitoring tools, server health agents, laptop thermal control software, data center node monitors, gaming utilities, embedded controllers, hardware diagnostic tools, and device management systems. It is useful whenever Python reads CPU, GPU, motherboard, storage, battery, or other sensor data and decides whether to display a value, increase cooling, show a warning, record an event, or request safe shutdown.

Why Interviewers Ask This

Interviewers ask this question to see whether the candidate can turn a physical system into a complete and safe test plan. They are evaluating test boundary selection, choice of test level, hardware dependency control, boundary analysis, deterministic time testing, failure handling, and production awareness. A strong answer should distinguish fast Python logic tests from real sensor and hardware validation.

Common interview mistakes

Common mistakes include testing only one normal value, treating every sensor as the same sensor, ignoring Celsius and Fahrenheit conversion, and skipping the exact warning boundary. Another mistake is using fixed sleep calls for spike and sustained heat tests, which can make the suite flaky. Candidates may mock every layer and then claim the real sensor integration works. They may patch the sensor dependency in its original module instead of where the monitoring module looks it up. Shared mutable fixtures can leak alert, timing, or last reading state between tests. Weak assertions may check only that no exception occurred while missing an incorrect unit, stale timestamp, wrong sensor identity, missing fan action, or unsafe shutdown. Other mistakes include accepting impossible values, hiding missing data behind an old reading, ignoring failed cooling actions, forgetting recovery after cooling, leaving test hardware hot, using production machines without safeguards, and treating coverage as proof of thermal safety.

Interview tip

Start by separating Python logic tests from real hardware integration tests. Then explain one idle case, one heavy load case, one exact boundary case, one short spike, one sustained overheat case, and one sensor failure. Mention multiple sensors, trusted sensor comparison, controlled time, cleanup, and the limits of mocked tests.
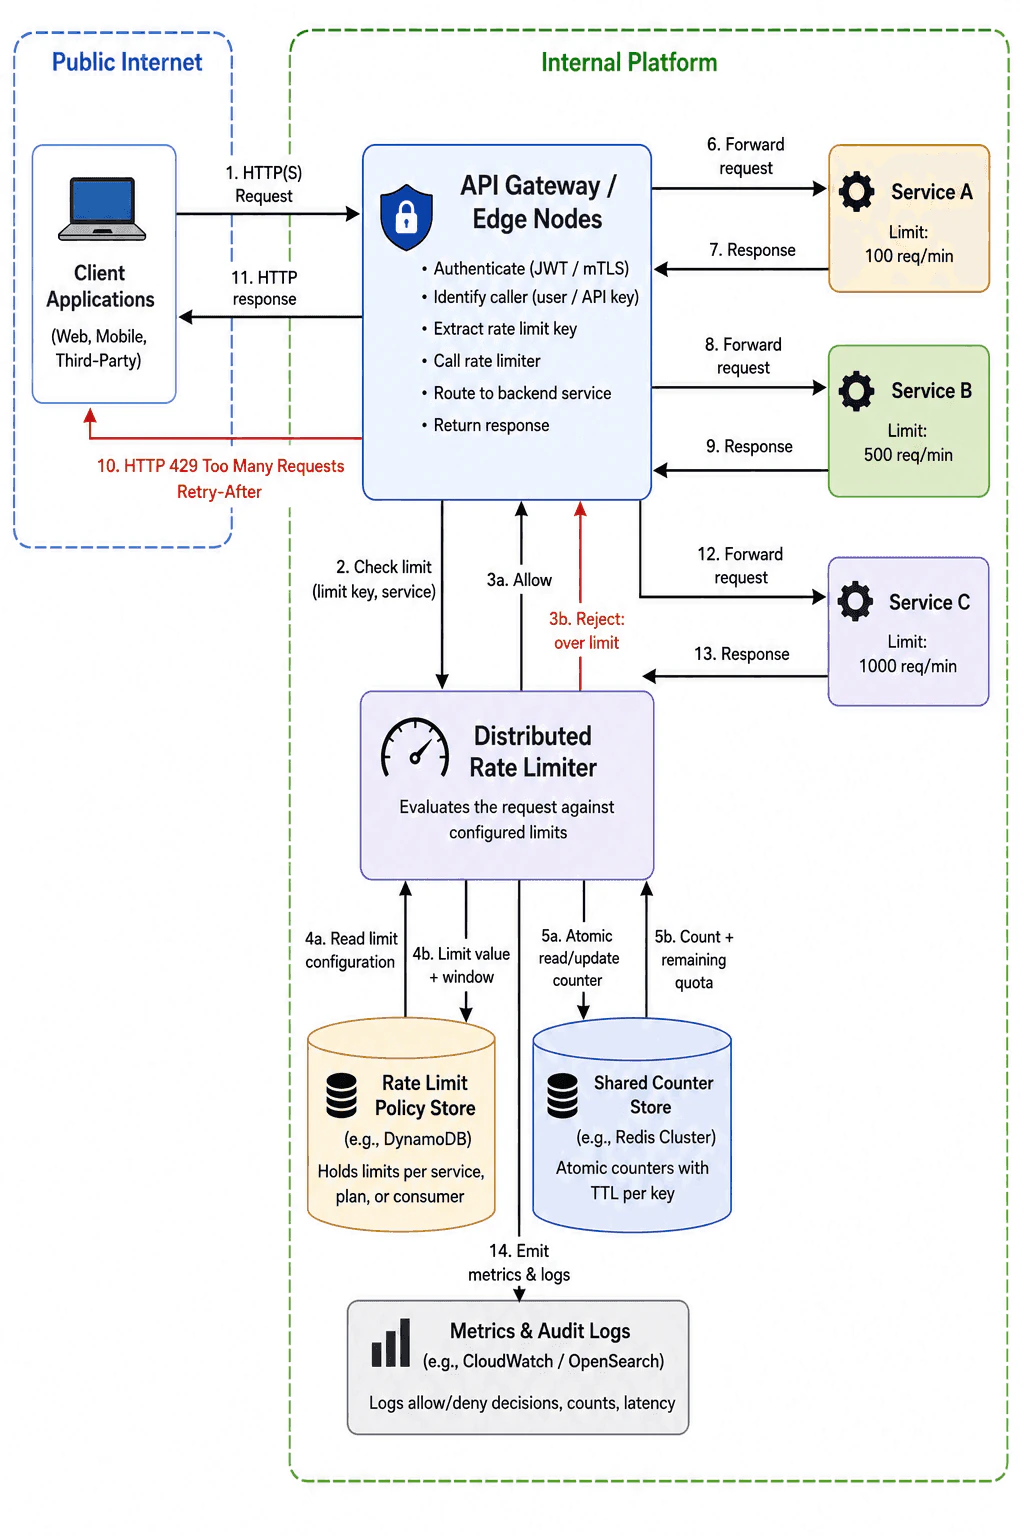
Interviewer may ask next
How would you prevent a short temperature spike from causing a flaky shutdown test?

I would keep the Python duration logic inside the unit test boundary and replace both the sensor reader and clock with controlled test doubles. I would provide a value above the shutdown limit for less than the required duration, advance the clock by exact amounts, and assert that the spike is recorded but no shutdown request occurs. This matters because real sleep calls and scheduler timing can produce inconsistent results. The tradeoff is that this proves the duration decision logic, but an integration test is still required to confirm real sampling timing and operating system behavior.

When should the temperature test use real hardware instead of only stubs and mocks?

I would expand the boundary to an integration test when I need to verify the real sensor adapter, sensor identity, operating system permissions, update timing, fan controller, shutdown interface, or physical calibration. The test should run on a controlled machine, simulator, or approved lab device and compare readings with a trusted sensor or test tool. This matters because stubs cannot prove driver compatibility, correct CPU or GPU mapping, real cooling behavior, or measurement accuracy. The tradeoff is slower execution, higher setup cost, limited parallelism, special safety controls, and more CI maintenance.

More questions load as you scroll

Disclaimer: This interview guide is for educational and informational purposes only. It is designed to help readers prepare, but it does not guarantee any interview result, hiring decision, offer, or outcome. Interview questions, hiring criteria, and preferred answers can vary by employer, interviewer, industry, location, and time. The examples and explanations reflect the authors' research and judgment, are provided without warranties of any kind, and should not be treated as the only correct approach. Diagrams are simplified illustrations intended to highlight the main components and their interactions; actual systems and implementations may be more complex. Alternative approaches may be equally valid or better suited to a particular question, context, or interviewer. To the fullest extent permitted by applicable law, the author, contributors, and publisher are not liable for decisions made, actions taken, or losses incurred based on this guide.

Company Notice: This guide is an independent educational resource and is not affiliated with, endorsed by, sponsored by, or approved by the company named in this guide. Company names are used only to identify interview experiences commonly reported by candidates. Interview practices can change without notice, and inclusion of company-specific content does not mean these questions are official, complete, or guaranteed to be asked. To the fullest extent permitted by law, the author, contributors, and publisher are not responsible for outcomes related to use of this material.