This interview guide is for educational and informational purposes only. It is designed to help readers prepare, but it does not guarantee any interview result, hiring decision, offer, or outcome. Interview questions, hiring criteria, and preferred answers can vary by employer, interviewer, industry, location, and time. All answers, examples, and explanations in this guide are suggested examples for interview preparation, not definitive answers or instructions for professional practice. They are based on research and judgment, are provided without warranties of any kind, and should be adapted to the question, role, and applicable laws and professional requirements. Diagrams are simplified illustrations intended to highlight the main concepts and their relationships; actual situations, systems, and practices may be more complex. Alternative approaches may be equally valid or better suited to a particular question, context, or interviewer. To the fullest extent permitted by applicable law, the contributors and publisher are not liable for decisions made, actions taken, or losses incurred based on this guide.
State Laws and Professional Responsibilities
Laws and requirements governing an occupation vary by state and jurisdiction. You are responsible for checking the current laws, licensing requirements, and scope-of-practice rules that apply to your location and role, and for ensuring that your answers and actions comply with them. Adapt examples in this guide to those requirements. This guide is not legal advice.
Identity, Image, and Privacy Notice
To respect individual privacy, some names, profile photographs, avatars, biographical details, and other identifying information displayed in this guide may be replaced with pseudonyms, licensed stock images, illustrative avatars, composite images, or representative descriptions. Unless a person is expressly identified as an actual contributor, a displayed name, image, or profile should not be understood as depicting or identifying a specific candidate, interviewer, employee, or other real individual. These representations are provided for editorial and illustrative purposes only and do not imply endorsement, employment, participation, or affiliation with this guide or any company mentioned in it. Any resemblance to an actual person is coincidental.
Company Notice
This guide is an independent educational resource and is not affiliated with, endorsed by, sponsored by, or approved by the company named in this guide. Company names identify reported interview experiences or the employer context of clearly labeled original practice exercises. Interview practices can change without notice, and inclusion of company-specific content does not mean these questions are official, complete, or guaranteed to be asked. To the fullest extent permitted by law, the author, contributors, and publisher are not responsible for outcomes related to use of this material.
Content Accuracy and Verification
To the fullest extent permitted by applicable law, we do not represent or warrant that interview guides, questions, answers, examples, or diagrams are accurate, complete, current, error-free, or suitable for any particular purpose. You are responsible for independently reviewing and verifying the information before relying on it.
Questions or comments?
Contact us for general questions, or share feedback, technical corrections, and comments with the community.
71. How do unit, integration, and end-to-end frontend tests differ?TestingEasy
i Question Details
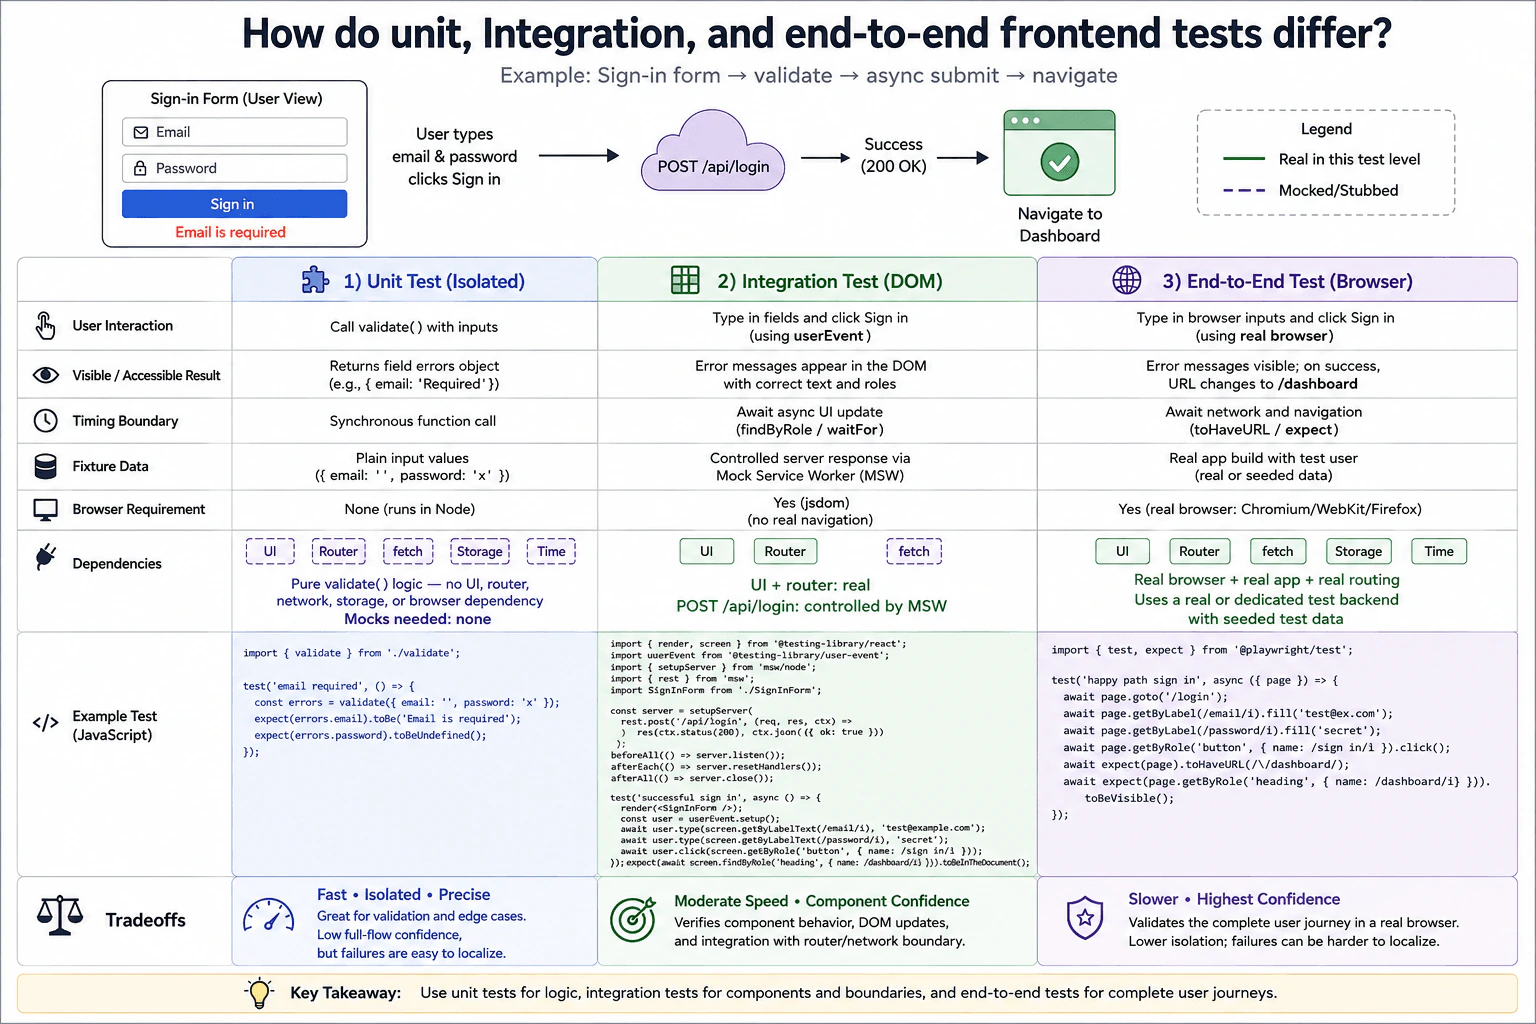
Use a sign-in form that renders email and password fields, validates input, submits asynchronously, and navigates after success. Compare what one unit test, one DOM integration test, and one browser end-to-end test should verify. For each level, name the user interaction, visible or accessible result, timing boundary, fixture data, browser requirement, and which dependencies are real versus mocked. Explain the tradeoff among speed, isolation, confidence, and diagnostic value.
Short Interview Answer (30-60 seconds)
I would use a unit test for isolated validation logic, a DOM integration test for the real sign in component working with routing and a controlled network response, and an end to end test for the complete journey in a real browser. Unit tests are fastest and easiest to diagnose. Integration tests give stronger component confidence. End to end tests give the highest confidence in the complete user journey, but they are slower, less isolated, and failures can be harder to localize.
Detailed Explanation
A sign in form has several kinds of behavior, so I would not check everything with one large test. First, I would check the small input rules by themselves. Next, I would check what a person sees after typing into the form and pressing Sign in. Finally, I would check the whole successful journey in a real browser, from entering the details to reaching the dashboard. Each level gives more confidence about the complete experience, but it also needs more setup, takes more time, and depends on more moving parts.
Useful Questions to Ask the Interviewer
Should the successful browser test use a dedicated test environment with seeded users?
Should form validation finish before the sign in request is sent?
Should the DOM integration test include real application routing behavior?
How to Explain It in an Interview
The unit test checks only the validation function. It calls validate with plain JavaScript values, such as an empty email and a password value. The expected result is an email field error. The call is synchronous, no browser is required, and there is no UI, router, network, storage, or browser dependency inside this test boundary. Because those dependencies are not used by the validation function, no mocks are needed. This test is very fast, highly isolated, and easy to diagnose. Its limitation is that it does not prove the form, request, routing, or real browser journey works.
The DOM integration test renders the real SignInForm and interacts with it the way a user would. The user types into the email and password fields and clicks the Sign in button with Testing Library userEvent. The UI and routing behavior remain real within the frontend test environment. The POST request to /api/login is controlled with Mock Service Worker so the response is deterministic and does not depend on a remote production system. The test checks accessible visible results, such as an email validation message or the dashboard state after a successful request. Asynchronous changes are awaited with findByRole, findByText, waitFor, or another bounded Testing Library utility. There are no fixed sleep calls and no fake timers because timer behavior is not part of this example. The test runs with a simulated DOM such as jsdom, so it gives useful component confidence but does not prove real browser navigation or browser compatibility.
The end to end test runs the real application in a real browser. The user opens the sign in page, fills the email and password fields, and clicks Sign in. The test waits for the application to complete the request and navigation, then checks that the URL is /dashboard and that the dashboard heading is visible. The browser, application, and routing are real. The test uses a real or dedicated test backend with seeded test data rather than production user data. This gives the highest confidence in the complete user journey. The tradeoff is that the test is slower, has lower isolation, needs more environment setup, and a failure can be harder to localize because more parts are involved.
The practical balance is to use many fast unit tests for small logic, DOM integration tests for important component behavior and controlled boundaries, and a smaller number of end to end tests for critical user journeys. That gives fast feedback while still checking that the complete sign in flow works in a real browser.
Technical Approach
Define the behavior. The sign in form renders email and password fields, validates input, submits asynchronously, and navigates after success.
Choose the smallest useful boundary for each behavior.
For the unit test, call validate directly with plain values and assert the returned field errors.
For the DOM integration test, render the real SignInForm, keep the frontend behavior real, control POST /api/login with Mock Service Worker, interact through accessible controls, and wait for visible results.
For the end to end test, open the real application in a real browser, fill the form, submit it, and wait for the dashboard URL and visible dashboard content.
Keep fixture data explicit. Use plain values for the unit test, a controlled network response for the DOM test, and a seeded test user for the browser test.
Reset network handlers and other changed test state so tests remain independent.
Run the fast focused tests often and keep the slower browser suite focused on critical journeys in CI.
Practical Insights
Traditional algorithmic complexity does not meaningfully apply here. The important cost is test runtime, setup, maintenance, and CI time. The unit test is fastest because it calls one function with plain values and no browser. The DOM integration test has a moderate cost because it renders the component, processes realistic user events, and waits for a controlled network response and DOM update. The end to end test is slowest because it drives a real browser, runs the application, uses seeded test data, performs network work, and waits for navigation. Large browser suites therefore cost more to run and maintain.
Why Interviewers Ask This
Interviewers ask this question to see whether I can choose the right test boundary for different kinds of frontend behavior. They want to know whether I understand isolation, realistic user interaction, asynchronous behavior, controlled dependencies, browser confidence, and useful failure diagnosis. They also want to see whether I know when a fast focused test is enough and when a complete real browser journey is worth the extra runtime, setup, and maintenance cost.
Common interview mistakes
Common mistakes include testing the complete sign in journey at every level, mocking dependencies that the isolated validation function does not use, replacing too much of the real component in the DOM integration test, calling production services from tests, using production user data, using fixed sleep calls for asynchronous work, adding fake timers when no timer behavior is being tested, checking private component state instead of visible behavior, sharing mutable fixture state between tests, forgetting to reset Mock Service Worker handlers, depending on test execution order, and treating a simulated DOM test as proof that the real browser journey works.
Interview tip
Explain the boundaries from smallest to largest. For each level, say what the user does, what result you assert, what data you use, what environment is required, what stays real, what is controlled, and what the test cannot prove. Finish with the tradeoff: unit tests give fast isolation, DOM integration tests give component confidence, and a smaller number of end to end tests give confidence in critical real browser journeys.
Interviewer may ask next
How would you test a failed sign in request without making the test depend on a real remote service?
I would keep the DOM integration boundary and change the Mock Service Worker handler for POST /api/login to return the supported failure response. The real SignInForm and frontend routing behavior would stay in the test. I would submit the form with userEvent and wait for the visible accessible error result. This matters because the test checks the frontend failure behavior with a deterministic network boundary. I would reset the handler afterward so that this failure fixture cannot affect another test.
Why not put every sign in test in the real browser if end to end tests give the highest confidence?
I would keep the three level strategy because each boundary has a different job. The end to end boundary is best for the complete browser journey, but it is slower, less isolated, and harder to diagnose when something fails. Validation logic is faster and clearer in the unit boundary. Component behavior and controlled request handling are cheaper to verify in the DOM integration boundary. I would therefore keep only the most important complete journeys in the browser suite so CI gets strong confidence without making every feedback cycle depend on the full application environment.
72. Why should frontend tests prefer observable behavior over implementation details?TestingEasy
i Question Details
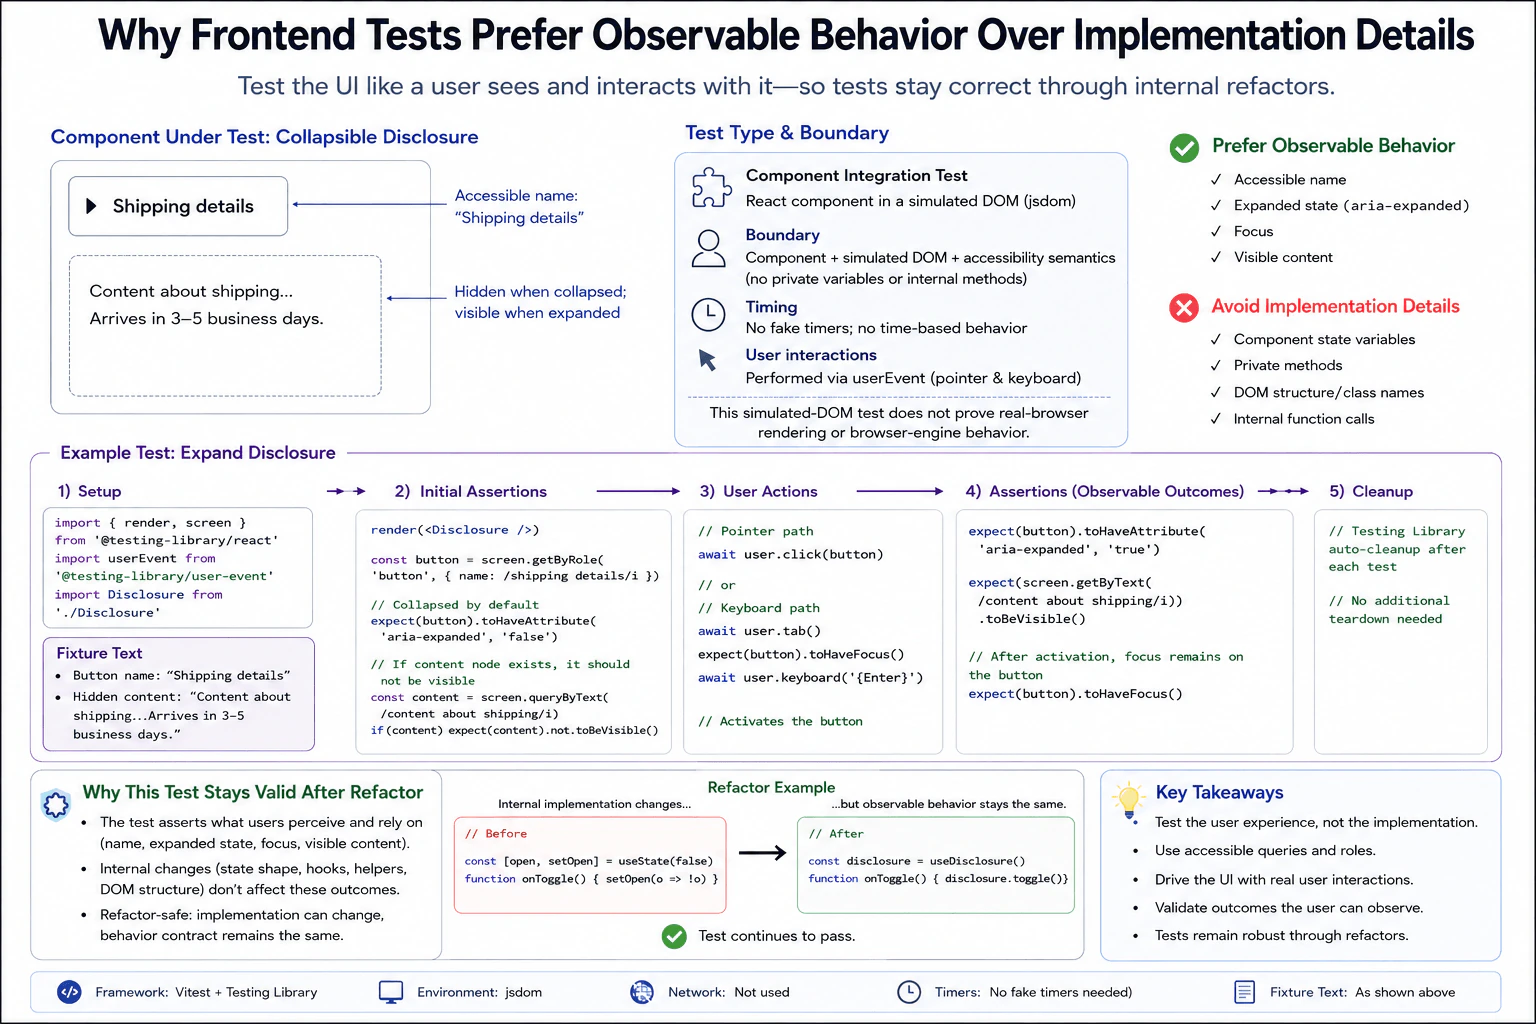
Consider a collapsible disclosure that renders a button and a hidden content region, then reveals the region when activated. Describe assertions based on accessible name, expanded state, focus, and visible content rather than private variables or internal method calls. State the unit or integration boundary, how keyboard and pointer interactions are performed, whether any timer is real, what fixture text is used, and why the test should remain valid after an internal refactor.
Short Interview Answer (30-60 seconds)
I would test what the user can observe. For this disclosure, I render the real component in a simulated DOM and find its button by accessible name. I activate it through pointer or keyboard input, then check its expanded state, focus, and visible content. I do not inspect private state or call internal methods. No fake timers are needed because there is no time based behavior. This gives strong component behavior confidence and stays useful after internal code changes, but it does not prove real browser rendering or browser engine behavior.
A strong test checks what a person can actually see and do. In this example, the page has a button called Shipping details. The shipping message starts hidden and appears after the button is used. The test should behave like a person by clicking the button or reaching it with the keyboard. It should check the button name, whether the section is open, whether the button still has keyboard attention, and whether the shipping message can be seen. It should not depend on hidden program details that a user never sees.
Useful Questions to Ask the Interviewer
Should the disclosure keep its hidden content in the page or remove it until opened?
Do you want both pointer and keyboard activation covered in this component test?
Is a simulated DOM enough for this question, or is separate real browser coverage expected?
How to Explain It in an Interview
The behavior under test is the public contract of the disclosure. A user can find a button named Shipping details, activate it, observe whether it is expanded, keep focus on the button, and see the shipping message. Those are stable outcomes even if the component changes its hooks, helper functions, state shape, or markup structure.
The chosen boundary is a component integration test. I render the real Disclosure component with Testing Library in jsdom. jsdom provides a simulated DOM. It is not a real browser. I do not replace the component, network, clock, or browser APIs because this example does not need those boundaries. There is no network request and no time based behavior, so no fake timers or Mock Service Worker handlers are needed.
The fixture is small and explicit. The accessible button name is Shipping details. The hidden content says that it contains shipping information and that delivery arrives in 3 to 5 business days. The test finds the button with getByRole and its accessible name instead of relying on a class name, element nesting, private variable, hook, or internal method.
For the pointer path, I create a userEvent instance and await user.click on the button. For the keyboard path, I start from a fresh render, use user.tab to move focus to the button, assert that the button has focus, and then await user.keyboard with Enter. These are separate activation paths, so one path does not depend on state created by the other.
Before activation, I assert that the button has aria expanded set to false. The content may either be missing from the DOM or present but hidden. If the content node exists, it must not be visible. This keeps the assertion focused on what the user experiences instead of requiring one rendering strategy.
After activation, I assert that the button has aria expanded set to true. I find the shipping text and assert that it is visible. I also assert that focus remains on the button after activation. These checks describe the behavior contract without depending on a private state variable or internal toggle function.
Testing Library cleanup removes the rendered DOM after each test in the environment shown by the diagram, so no additional teardown is needed. There are no fake timers, network handlers, storage overrides, or global mocks to restore.
Useful failure cases are observable failures. The button might stay collapsed after a click. Pressing Enter might fail to expand it. The shipping text might remain hidden. The button might report the wrong expanded state. Keyboard focus might not reach or remain on the button. Each failure points to behavior that a user can experience.
This test is reliable in continuous integration because it has no remote service, shared mutable fixture, random value, timer dependency, or fixed sleep. Each activation path gets a fresh render. The important limitation is that jsdom does not prove real browser rendering or browser engine behavior. If layout, browser compatibility, or browser specific focus behavior matters, I would add a real browser test rather than claim this component test provides that confidence.
The main tradeoff is intentional. A behavior focused test knows less about the internal implementation. That makes it less useful for checking private functions directly, but much more stable when those private details change. As long as the user visible contract remains the same, the test should continue to pass after an internal refactor.
Key Insight / Why This Solution Works
Define the behavior. The disclosure button is named Shipping details. It starts collapsed and reveals the shipping content after activation.
Choose the boundary. Render the real component with Testing Library in jsdom as a component integration test.
Arrange the fixture. Use the explicit button name and shipping content. Do not add mocks, network handlers, or fake timers because this component does not need them.
Assert the starting behavior. Check that the button reports a collapsed state. If the content node already exists, check that it is not visible.
Run the pointer path in its own test. Await a user click on the button.
Assert the observable result. Check the expanded state, visible shipping content, and focus on the button.
Run the keyboard path in a separate test with a fresh render. Tab to the button, confirm focus, press Enter, and assert the same observable result.
Let Testing Library cleanup remove the rendered DOM after each test in the configured environment.
Run each test independently in continuous integration. Do not depend on test order or shared mutable state.
Code
import { describe, expect, it } from'vitest';
import { render, screen } from'@testing-library/react';
import userEvent from'@testing-library/user-event';
import'@testing-library/jest-dom/vitest';
importDisclosurefrom'./Disclosure';
const buttonName = /shipping details/i;
const contentText = 'Content about shipping... Arrives in 3–5 business days.';
functionrenderDisclosure() {
// Render the real component. No mock or fake dependency is needed for this behavior.render(<Disclosure />);
// Query the control through its role and accessible name, which are observable to users.const button = screen.getByRole('button', { name: buttonName });
return { button };
}
functionexpectCollapsed(button) {
// Assert the public expanded state instead of reading private component state.expect(button).toHaveAttribute('aria-expanded', 'false');
// Allow either valid implementation: the content can be absent or mounted but hidden.const content = screen.queryByText(contentText);
if (content) {
expect(content).not.toBeVisible();
}
}
functionexpectExpanded(button) {
// Assert the accessible expanded state after activation.expect(button).toHaveAttribute('aria-expanded', 'true');
// Assert the exact fixture content is visible to the user.expect(screen.getByText(contentText)).toBeVisible();
// The approved behavior keeps focus on the disclosure button after activation.expect(button).toHaveFocus();
}
describe('Disclosure observable behavior', () => {
it('expands through pointer activation', async () => {
// Create realistic pointer interaction behavior.const user = userEvent.setup();
const { button } = renderDisclosure();
// Verify the initial observable state.expectCollapsed(button);
// Activate the disclosure through the pointer path.await user.click(button);
// Verify only outcomes that the user can observe.expectExpanded(button);
});
it('expands through keyboard activation', async () => {
// Use a fresh render so this path is independent of the pointer test.const user = userEvent.setup();
const { button } = renderDisclosure();
// Move focus through normal keyboard navigation before activation.await user.tab();
expect(button).toHaveFocus();
// Activate the focused disclosure button with Enter.await user.keyboard('{Enter}');
// Verify the same observable behavior contract as the pointer path.expectExpanded(button);
});
});
Why Interviewers Ask This
Interviewers ask this to see whether I can test the behavior a user depends on instead of coupling tests to private code. They want to see whether I choose the right test boundary, use realistic user actions, make useful accessibility assertions, and understand why a test should survive an internal refactor. It also shows whether I understand the confidence and limitations of a simulated DOM test.
Common interview mistakes
A common mistake is checking a private state variable such as open instead of checking the expanded state users can observe. Another is spying on an internal toggle function or hook. That makes the test fail after a refactor even when the user experience is unchanged. Tests also become fragile when they assert class names, exact element nesting, or other incidental DOM structure. Another mistake is forcing collapsed content to be absent from the DOM when a valid implementation may keep it mounted but hidden. Keyboard tests should move focus naturally before pressing Enter. Fixed sleeps, unnecessary fake timers, and unnecessary mocks add complexity without helping this example.
Interview tip
Explain the behavior contract first. Say what the user can find, do, and observe. Then name the component integration boundary, explain that jsdom is simulated rather than a real browser, and show how pointer and keyboard paths produce the same visible result. Finish by explaining that private state and internal methods can change without breaking the test.
Interviewer may ask next
What would you change if the keyboard test sometimes failed because the button did not receive focus?
I would first keep the same component integration boundary and inspect the keyboard path. The test should use user.tab to move focus naturally, then assert that the Shipping details button has focus before pressing Enter. If focus does not reach the button, that is observable behavior to investigate rather than something to bypass with a private method call. I would not add a fixed sleep. If the failure depends on real browser focus behavior that jsdom cannot model reliably, I would add a focused real browser test while keeping the component test for the basic contract.
When would you move this disclosure test from jsdom to a real browser?
I would add a real browser boundary when the behavior depends on browser rendering, browser engine focus behavior, layout, browser compatibility, or a complete user journey. The existing component integration test should still cover the basic accessible contract because it is fast and easy to run in continuous integration. The tradeoff is that a real browser gives stronger browser confidence but costs more runtime and setup. I would use each level for the confidence it can actually provide.
73. How should a test choose DOM elements by role and accessible name?TestingEasy
i Question Details
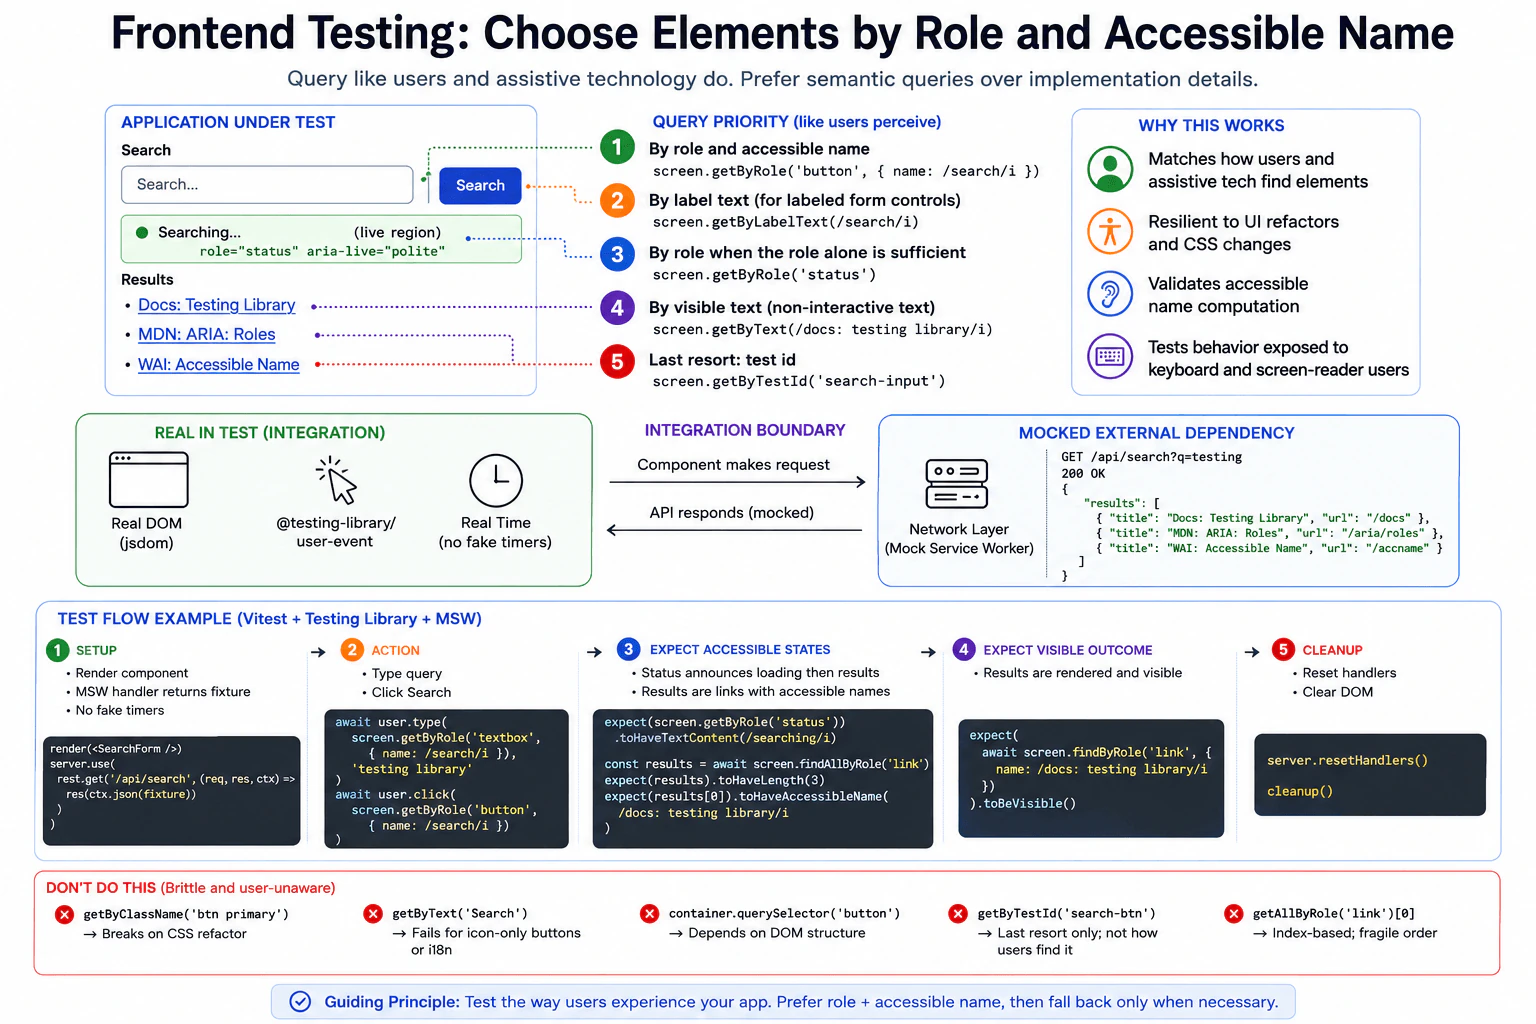
A form renders a labeled search field, a Search button, a live status message, and result links after an asynchronous request. Explain a query priority that reflects how users and assistive technology identify these elements. Specify the integration boundary, typed interaction, expected accessible and visible states, response fixture, real DOM environment, and mocked network boundary. Contrast semantic queries with brittle class-name or DOM-position selectors.
Short Interview Answer (30-60 seconds)
I would choose elements the way users and assistive technology identify them. For interactive controls, I prefer role plus accessible name. For a labeled form control, label text is also a strong query. A role alone is fine when that role already identifies the element clearly, such as a status message. I would render the real component in a DOM test environment, type and click with userEvent, mock only the HTTP boundary with Mock Service Worker, and assert the visible status and async result link. Test ids, classes, and DOM positions are last resort choices because they are more tied to implementation.
The test should find each part of the search page in the same way a person would. The search field should be identified from its label or accessible name. The Search button should be identified from its role and name. The loading message should be identified from its status role. The result links should be identified from their visible names. The test should type, click, wait for the result, and check what appears. The outside network reply should be controlled so the test stays repeatable and does not depend on a live service.
Useful Questions to Ask the Interviewer
Should this test cover only the successful search flow, or also empty and failed responses?
Is this component expected to run in a DOM test environment with Mock Service Worker, with separate real browser coverage for complete journeys?
How to Explain It in an Interview
The goal is to test the search form through behavior a user can observe. This is a component integration test. The real SearchForm, rendered DOM tree, event handling, request code, and DOM updates stay real. The HTTP boundary is replaced with Mock Service Worker so the response is deterministic.
For the Search button, I would use screen.getByRole('button', { name: /search/i }). The role tells us what the element does, and the accessible name tells us which button it is. For the labeled search field, screen.getByLabelText(/search/i) is a good choice. If the textbox has the accessible name Search, screen.getByRole('textbox', { name: /search/i }) is also appropriate. For the live message, screen.getByRole('status') works because the element has role status. For an async result link, screen.findByRole('link', { name: /docs: testing library/i }) waits for that user visible result to appear.
The query order should reflect user meaning, not private markup. Role plus accessible name is the preferred choice for interactive elements. Label text is strong for labeled form controls. A role alone is useful when that role is already sufficient to identify the element, such as a single status region. Visible text can be used for noninteractive content. A test id is a last resort when there is no useful user facing way to identify the element.
The test renders SearchForm in the configured DOM environment. Testing Library userEvent types testing library into the search field and clicks Search. Mock Service Worker intercepts GET /api/search and returns the fixed response fixture shown in the diagram. That fixture contains the result links Docs: Testing Library, MDN: ARIA: Roles, and WAI: Accessible Name. No fake timers or fixed sleeps are needed.
After the click, the test checks the status element for the visible Searching message. It then awaits the result link with findByRole and verifies that the link is visible. After each test, Mock Service Worker handlers and the rendered DOM are reset so later tests do not inherit state.
This approach is more resilient than selecting .btn primary, using container.querySelector('button'), or choosing getAllByRole('link')[0]. Those selectors depend on CSS, DOM structure, or ordering instead of user meaning. A test id can still be useful when no semantic query can identify the element clearly, but it should not be the first choice here.
The limitation is important. This test gives confidence that the component behaves correctly with a controlled HTTP response. It does not prove that the real remote service is available, that the real service contract has not changed, or that a complete real browser journey works. Those concerns need separate contract or browser tests when they matter.
Technical Approach
Define the behavior. A user enters a search, presses Search, sees a live status message, and then sees result links.
Choose the test level. Use a component integration test because DOM behavior, user interaction, and the network boundary matter.
Keep the component real. Render SearchForm in the configured DOM environment.
Control only the network boundary. Use Mock Service Worker for GET /api/search and return the fixed result fixture.
Find controls semantically. Prefer role plus accessible name for the button and textbox, label text for the labeled field, and role alone for the status element when it is sufficient.
Act like the user. Type with userEvent and click the Search button.
Assert the accessible state. Check screen.getByRole('status') for the Searching message.
Assert the async visible result. Await screen.findByRole('link', { name: /docs: testing library/i }) and verify that it is visible.
Clean up. Reset the network handlers and rendered DOM.
Keep the test isolated. Do not use a production service, fixed sleeps, shared mutable state, class selectors, or DOM position selectors.
Practical Insights
Algorithmic Big O complexity is not very useful for this test. The practical cost comes from rendering the component, simulating the user action, intercepting the request, and waiting for the DOM update. The fixture is small, so memory and setup cost are low. This kind of DOM integration test is usually faster and cheaper in CI than a complete real browser journey. Its main maintenance cost is keeping the fixture and accessible expectations aligned with intended behavior.
Code
import { afterAll, afterEach, beforeAll, describe, expect, it } from'vitest';
import'@testing-library/jest-dom/vitest';
import { cleanup, render, screen } from'@testing-library/react';
import userEvent from'@testing-library/user-event';
import { rest } from'msw';
import { setupServer } from'msw/node';
import { SearchForm } from'./SearchForm';
// Use one small deterministic response fixture for every run.const fixture = {
results: [
{ title: 'Docs: Testing Library', url: '/docs' },
{ title: 'MDN: ARIA: Roles', url: '/aria/roles' },
{ title: 'WAI: Accessible Name', url: '/accname' },
],
};
// Replace only the HTTP boundary. The component and DOM behavior stay real.const server = setupServer(
rest.get('/api/search', (_req, res, ctx) => {
returnres(ctx.status(200), ctx.json(fixture));
})
);
beforeAll(() => {
// Start request interception before any component test runs.
server.listen({ onUnhandledRequest: 'error' });
});
afterEach(() => {
// Reset network overrides and the rendered DOM so tests remain isolated.
server.resetHandlers();
cleanup();
});
afterAll(() => {
// Stop the mock network server when this test suite finishes.
server.close();
});
describe('SearchForm', () => {
it('finds controls semantically and shows accessible search results', async () => {
// userEvent performs the same typed and click interactions a user makes.const user = userEvent.setup();
// Render the real component in the configured DOM test environment.render(<SearchForm />);
// Find the textbox by role and accessible name instead of class or position.await user.type(screen.getByRole('textbox', { name: /search/i }), 'testing library');
// Find the button by its semantic role and accessible name.await user.click(screen.getByRole('button', { name: /search/i }));
// Assert the live accessible status while the request is in progress.expect(screen.getByRole('status')).toHaveTextContent(/searching/i);
// Await the async result by link role and accessible name, then check visibility.expect(
await screen.findByRole('link', {
name: /docs: testing library/i,
})
).toBeVisible();
});
});
Why Interviewers Ask This
Interviewers ask this to see whether a candidate tests behavior that users and assistive technology can observe instead of depending on private page structure. They also want to see good judgment about semantic queries, async behavior, network isolation, and the confidence provided by a component integration test.
Common interview mistakes
A common mistake is choosing elements by class name, CSS selector, DOM position, or array index when the user already has a meaningful role, label, or visible name. Another mistake is querying a Search button only by its text when role plus accessible name expresses the intent more clearly. Tests also become weak when they mock the component itself, call a production service, use fixed sleeps for async work, forget to reset Mock Service Worker handlers, or treat a mocked HTTP test as proof that the real remote integration works.
Interview tip
Start with one rule: query the page the way users and assistive technology identify it. Then walk through the exact search flow. Keep the component and DOM behavior real, use userEvent for typing and clicking, mock only the HTTP boundary with Mock Service Worker, assert the status and async result link, and clean up afterward. End by explaining that semantic queries survive many harmless markup changes while class and DOM position selectors are brittle.
Interviewer may ask next
How would you test a failed search request without making this test flaky?
I would keep the same component integration boundary and replace only the Mock Service Worker handler for that test so GET /api/search returns the intended failure response. I would perform the same userEvent actions and then await the user visible error state through its semantic role or accessible text. The handler would be reset after the test. This matters because the failure stays controlled and repeatable while the real component and DOM behavior still run. The tradeoff is that the test still does not prove how the real remote service behaves.
When should this check also run as a real browser test?
I would keep this DOM component integration test for fast semantic behavior checks and add a real browser test when the risk depends on browser behavior such as focus, keyboard navigation, routing, layout, browser compatibility, service workers, or a complete user journey. The boundary then changes from a DOM test environment with a mocked HTTP response to a real browser environment. That gives broader confidence, but it costs more CI time and is usually slower to debug.
74. When should a frontend test wait for an asynchronous UI state?TestingEasy
i Question Details
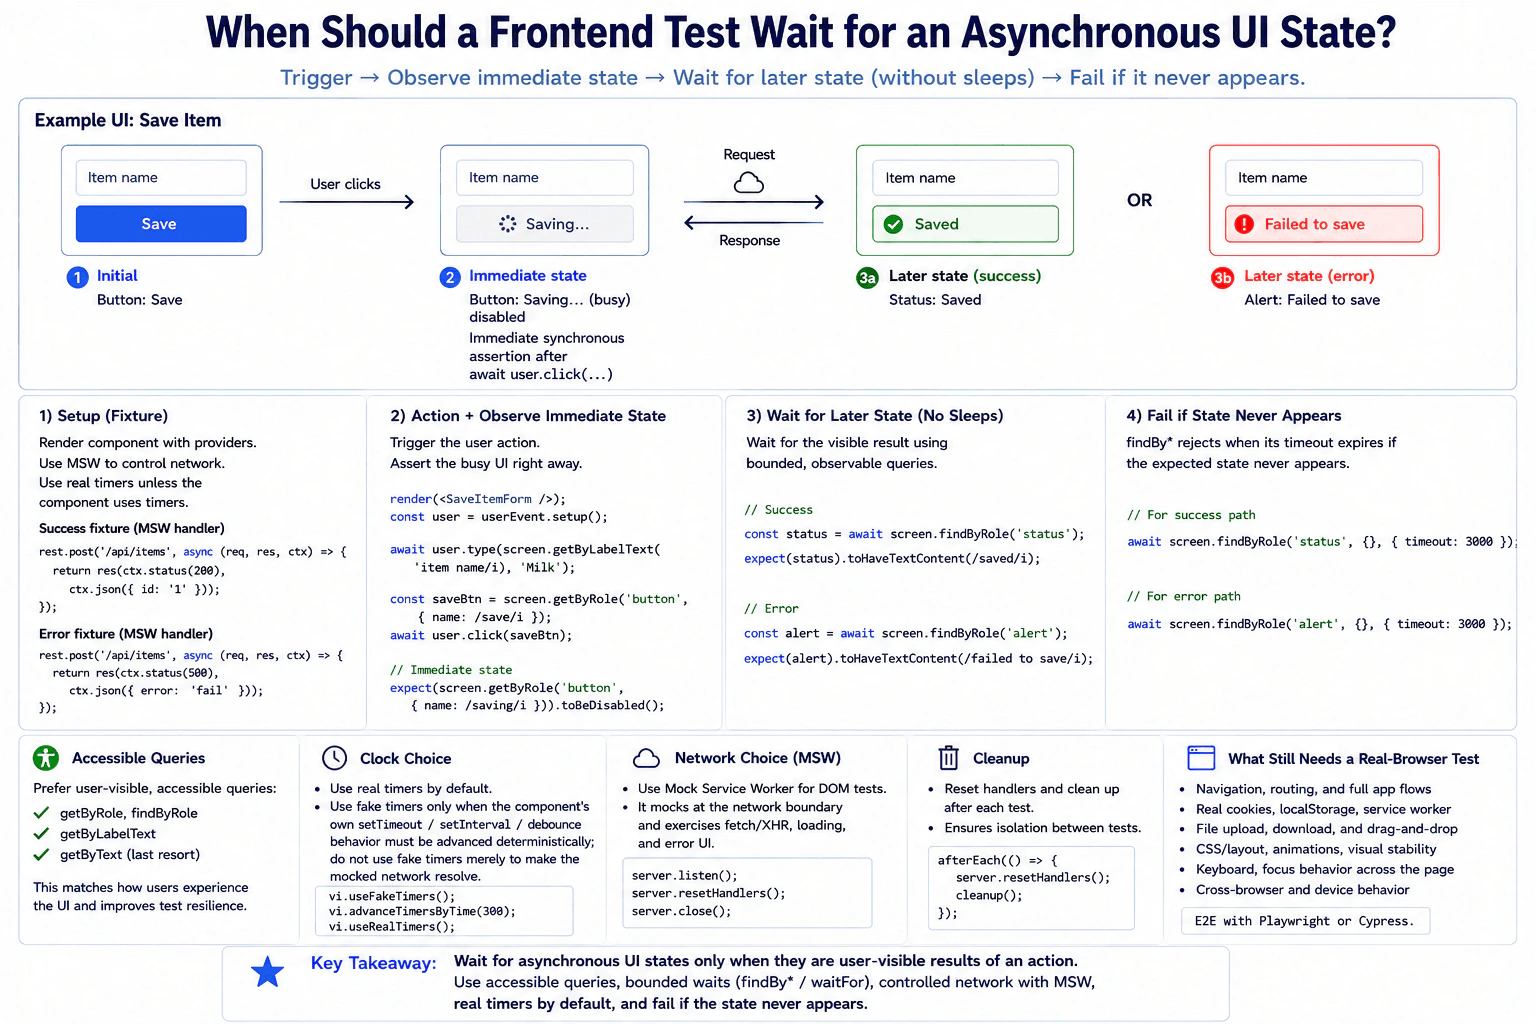
A save button changes to Saving…, sends a request, then displays either Saved or an alert. Describe how a DOM integration test should trigger the action, observe the immediate state, wait for the later state without arbitrary sleep delays, and fail if the state never appears. Include accessible naming, a success and error fixture, real versus mocked clock and network choices, cleanup, and what still requires a real-browser test.
Short Interview Answer (30-60 seconds)
I wait only when the UI result is expected to appear after asynchronous work. For this save flow, I await the user click, check the disabled Saving button immediately, then use a bounded findBy query for the later Saved status or error alert. I control the request with Mock Service Worker and use real timers by default. Fake timers are only useful when the component itself has timer behavior. If the expected UI never appears, the bounded query fails the test.
The test should copy what a user sees after pressing Save. First, the button should quickly show Saving and become unavailable. Then the request finishes. The page should show either Saved or a clear error message. The test should wait for that later message instead of waiting for a fixed amount of time. It should check both a successful request and a failed request. If the expected result never appears, the test should fail instead of continuing silently.
Useful Questions to Ask the Interviewer
Should the save request be controlled inside the test instead of calling a real service?
Does the component use timer behavior such as debounce?
Should both the success state and the error alert be covered by this test?
How to Explain It in an Interview
I would use a DOM integration test because the important behavior is visible component behavior plus a controlled network boundary. I would render the real SaveItemForm and use Testing Library userEvent to interact with it through the same button a user sees.
The network is replaced only at the request boundary with Mock Service Worker. One handler returns a successful response. Another handler returns an error response. This keeps the test deterministic while still exercising the component request code and response handling.
After await user.click(...), I check the immediate state synchronously. The button should have the accessible name Saving and be disabled. I do not add a sleep because this state should already be visible after the awaited user action completes.
For the later state, I use a bounded findByRole query. On success, I wait for the status element and then check that its text contains Saved. On failure, I wait for the alert element and then check that its text contains Failed to save. I do not query the status or alert with { name: ... } unless that element truly has an accessible name. Visible status or alert text is not automatically the accessible name of that role.
A findBy query waits only until its timeout. If the expected status or alert never appears, the returned Promise rejects and the test fails. This is better than a fixed sleep because the test waits for the actual user visible condition and can finish as soon as that condition appears.
I use real timers by default. Fake timers are appropriate only when the component itself uses setTimeout, setInterval, or debounce behavior that the test must advance in a controlled way. Fake timers should not be used merely to make the mocked request resolve.
Each test starts with known network handlers. After each test, I reset handlers that were changed and clean up the rendered DOM. After the suite, I close the Mock Service Worker server. If fake timers were enabled for a timer specific test, I would restore real timers as part of cleanup. This prevents one test from changing another test.
This DOM integration test gives confidence in the component behavior, accessible interaction, request handling, immediate Saving state, later success state, and later error state. It does not prove real browser navigation, real cookies or storage behavior, service worker behavior, downloads, native dialogs, permissions, visual layout, animation, full page keyboard and focus behavior, or browser compatibility. Those areas still need a real browser test.
Technical Approach
Define the visible behavior. The button starts as Save, changes to Saving after the click, and later reaches either Saved or an error alert.
Choose a DOM integration test. Render the real component and keep the user interaction real inside the simulated DOM.
Control only the network boundary with Mock Service Worker. Provide one success fixture and one error fixture.
Create a user with userEvent and find the Save button by its accessible role and name.
Await the user click because userEvent can perform asynchronous work.
Immediately assert that the button now has the accessible name Saving and is disabled.
For success, wait with findByRole('status'), then assert that the status text contains Saved.
For failure, replace the network handler with the error fixture, wait with findByRole('alert'), then assert that the alert text contains Failed to save.
Do not use a fixed sleep. Let the bounded query reject if the expected state does not appear before its timeout.
Use real timers unless the component itself contains timer behavior that must be advanced deterministically.
Reset changed network handlers and clean up the DOM after every test. Close the test server after the suite.
Keep real browser checks for behavior that the simulated DOM cannot prove.
Practical Insights
Algorithmic time and space complexity are not important for this test. The practical cost comes from rendering the component, running user events, handling controlled requests, and waiting for observable UI results. A DOM integration test is usually faster and cheaper than a complete real browser journey. Mock Service Worker adds some setup and fixture maintenance, but it makes success and error behavior deterministic. A bounded wait can add time when a test fails because the query waits until its timeout. Small fixtures and isolated tests help the suite remain fast and predictable in continuous integration.
Code
importReactfrom'react';
import { afterAll, afterEach, beforeAll, describe, expect, test } from'vitest';
import { cleanup, render, screen } from'@testing-library/react';
import userEvent from'@testing-library/user-event';
import { rest } from'msw';
import { setupServer } from'msw/node';
importSaveItemFormfrom'./SaveItemForm';
// The default network fixture represents a successful save request.const server = setupServer(
rest.post('/api/items', async (req, res, ctx) => {
returnres(ctx.status(200), ctx.json({ id: '1' }));
})
);
// Start the controlled network boundary before this test suite runs.beforeAll(() => {
server.listen({ onUnhandledRequest: 'error' });
});
// Reset changed handlers and remove rendered DOM after each test so tests stay isolated.afterEach(() => {
server.resetHandlers();
cleanup();
});
// Close the Mock Service Worker server after all tests finish.afterAll(() => {
server.close();
});
describe('SaveItemForm', () => {
test('shows Saving immediately and Saved after a successful request', async () => {
// Render the real component and create a realistic user interaction helper.render(<SaveItemForm />);
const user = userEvent.setup();
// Query the button by the accessible role and name that a user experiences.const saveButton = screen.getByRole('button', { name: /save/i });
// Await the user action because userEvent can perform asynchronous work.await user.click(saveButton);
// Check the immediate observable loading state without any arbitrary sleep.expect(screen.getByRole('button', { name: /saving/i })).toBeDisabled();
// Wait for the later success role. The bounded query rejects if it never appears.const status = await screen.findByRole('status', {}, { timeout: 3000 });
// Check the visible success text separately from the role query.expect(status).toHaveTextContent(/saved/i);
});
test('shows Saving immediately and an alert after a failed request', async () => {
// Replace only the network boundary for this test with the error fixture.
server.use(
rest.post('/api/items', async (req, res, ctx) => {
returnres(ctx.status(500), ctx.json({ error: 'fail' }));
})
);
// Render a fresh component instance so the failure test is independent.render(<SaveItemForm />);
const user = userEvent.setup();
// Trigger the same accessible user action used in the success test.await user.click(screen.getByRole('button', { name: /save/i }));
// Check the immediate loading state without adding an arbitrary sleep.expect(screen.getByRole('button', { name: /saving/i })).toBeDisabled();
// Wait for the later alert role. The bounded query rejects if it never appears.const alert = await screen.findByRole('alert', {}, { timeout: 3000 });
// Check the visible error text separately from the role query.expect(alert).toHaveTextContent(/failed to save/i);
});
});
Why Interviewers Ask This
Interviewers want to see whether I can separate an immediate UI change from a later asynchronous result. They also want to know whether I can choose the right DOM integration boundary, control the network without hiding real component behavior, use accessible queries, avoid unreliable sleep calls, and clean up test state. This shows whether I can write tests that stay predictable in continuous integration and are easy to debug when they fail.
Common interview mistakes
A common mistake is using setTimeout or another fixed sleep before checking the final UI. That makes the test slower and can still be flaky. Another mistake is checking internal component state instead of the visible Saving, Saved, or alert behavior. It is also incorrect to assume that visible text inside a status or alert automatically becomes that element's accessible name. Other mistakes include mocking the whole component or request logic, using fake timers when no timer behavior needs control, calling a real production service, sharing changed handlers between tests, forgetting cleanup, testing only success, or using selectors that do not reflect accessible user behavior.
Interview tip
Explain the states in time order. Say what should be visible immediately after the click, what appears only after the request finishes, and which assertion must wait. Then explain that the network is controlled with Mock Service Worker, real timers stay real unless timer behavior matters, and a bounded query fails naturally if the expected UI never appears. Finish by naming what still needs a real browser test.
Interviewer may ask next
What would you do if this test sometimes passes and sometimes times out in continuous integration?
I would keep the same DOM integration boundary and first find which observable state is unstable. I would confirm that every request is handled by Mock Service Worker, each test resets changed handlers, the rendered DOM is cleaned up, and no shared state leaks between tests. I would not add a fixed sleep. If the component truly needs more time, I can adjust the bounded query timeout with a clear reason, but I would first remove the source of nondeterminism. This matters because a flaky test reduces trust in the whole suite.
When would you add a real browser test for this save scenario?
I would add a real browser test when the confidence boundary expands beyond the component and controlled request behavior. Examples include navigation, browser storage, service workers, downloads, native dialogs, permissions, visual layout, animation, focus across the page, or browser compatibility. I would keep the DOM integration test because it is faster and gives focused feedback. The main tradeoff is that the real browser test gives broader confidence but costs more runtime and maintenance in continuous integration.
75. What are mocks, stubs, and spies used for in frontend tests?TestingEasy
i Question Details
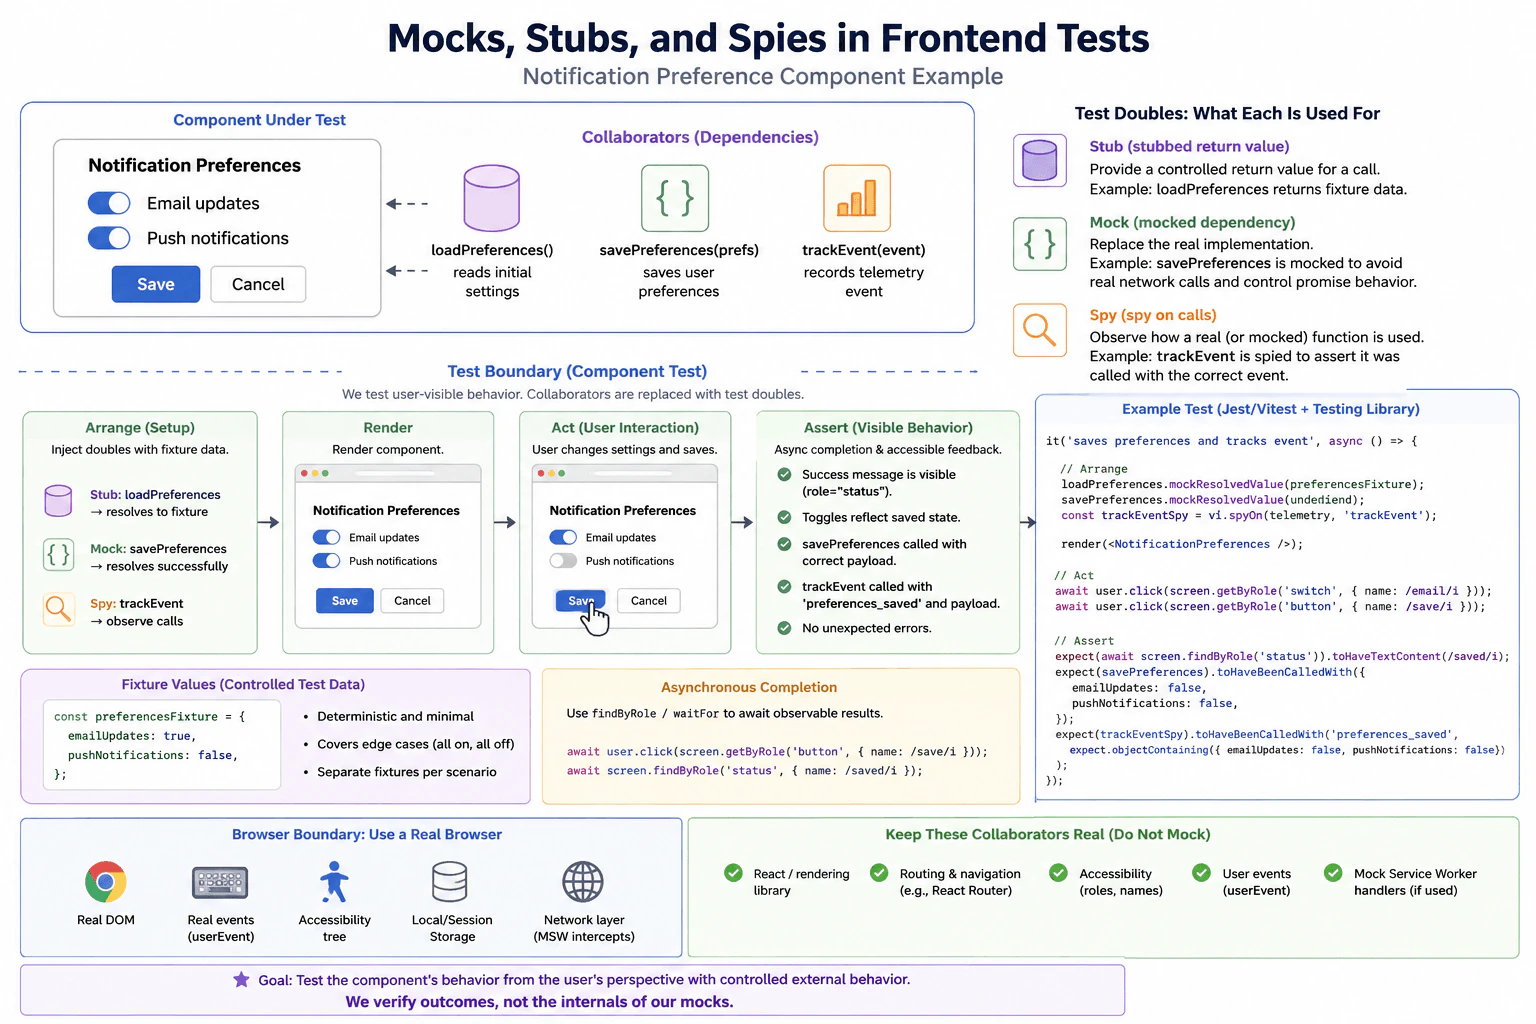
Use a notification preference component that reads initial settings, calls a save dependency, and records a telemetry event. Explain how a stubbed return value, a mocked dependency, and a spy on calls differ. Define the rendered behavior and DOM interaction under test, asynchronous completion, accessible feedback, fixture values, browser boundary, and which collaborators should remain real so the test does not only verify its own mocks.
Short Interview Answer (30-60 seconds)
I would use a component test and keep the real component, DOM behavior, accessible queries, and user events. I would stub loadPreferences so the component starts with known settings, mock savePreferences so I can control the save result without a real external call, and spy on trackEvent so I can verify the telemetry event and payload. I would await the user actions and the visible success message. This gives fast and reliable component confidence, but it does not prove the real network, telemetry service, or complete browser journey works.
This question asks how to test a notification settings screen without depending on outside systems. The screen first shows saved choices, lets a person change them, saves the new choices, and records that the save happened. A good test should start from known values, perform the same clicks a person would make, wait until saving finishes, and check the message the person can see. It should also check that the right information reached the save and tracking helpers, while keeping the real screen behavior, controls, and user interaction inside the test.
Useful Questions to Ask the Interviewer
Should the component test cover only a successful save, or does the real component also define a visible save error state?
Are loadPreferences and savePreferences imported functions, component props, or values supplied through context in the real project?
Should browser specific behavior such as focus, storage, or navigation be covered by this test or by separate browser integration tests?
How to Explain It in an Interview
The main goal is to test the behavior that the user can observe in Notification Preferences. I would render the real component and keep its state updates, DOM behavior, accessible controls, and user interaction real. I would replace only the collaborators outside the component boundary.
A stub gives controlled data back to the code under test. In this example, loadPreferences is stubbed to resolve with a small fixture. The fixture has emailUpdates set to true and pushNotifications set to false. This makes the starting screen predictable and lets the test verify that the component renders known settings.
A mock replaces a dependency whose behavior the test needs to control. Here, savePreferences is mocked. For the success test it resolves successfully instead of performing a real external save. The test can then verify that it received the exact preference values produced by the user action. A separate failure test could make this mock reject if the real component defines visible error behavior.
A spy records calls to a function. Here, vi.spyOn watches telemetry.trackEvent. The test does not need telemetry to perform a real analytics operation. It needs to verify that the component records the preferences_saved event with the correct payload after a successful save.
The test flow follows the diagram. First, arrange the controlled collaborators and fixture. Next, render Notification Preferences. Then use userEvent to change the Push notifications switch and click the Save button through accessible queries. Await each user action because userEvent can perform asynchronous work.
After saving, wait for an observable result instead of sleeping for a fixed amount of time. findByRole can wait for the status element. Then verify that its text says Preferences saved. The test should also verify that the switch reflects the changed state, savePreferences received the expected values, and telemetry.trackEvent received the expected event and payload.
The fixture should stay small and explicit. Each test should begin with fresh values so tests do not depend on execution order or shared mutable state. Mocks and spies should be reset or restored after each test. Timers, storage, network handlers, or other global browser state should also be restored whenever a test changes them.
The confidence boundary is important. This component test proves that the real component behaves correctly when its external collaborators behave in controlled ways. It does not prove that the real save service, telemetry transport, or browser integration works. When actual browser behavior such as focus, navigation, storage, compatibility, service workers, or a complete user journey matters, add browser integration or end to end coverage in a real browser.
The important collaborators inside this component test should remain real. Do not mock React rendering, Testing Library queries, userEvent, accessible DOM behavior, or the component state logic. Routing, context, storage, and network behavior should also remain real when they are part of the behavior being tested. If the test intentionally moves the network boundary outward, Mock Service Worker can control requests at that boundary instead of mocking fetch directly.
The practical tradeoff is speed against integration confidence. Stubs, mocks, and spies make component tests fast, deterministic, and easy to debug. Too many replacements can create a test that only verifies its own test doubles. That is why I would replace only clear external boundaries and use separate browser or integration tests for risks that the component test cannot prove.
Key Insight / Why This Solution Works
Define the behavior. Notification Preferences should load known settings, let the user change a switch, save the new values, record telemetry, and show accessible success feedback.
Choose the test level. Use a component test because the main confidence needed is rendered behavior and DOM interaction.
Arrange the boundary. Keep the component, DOM behavior, accessible queries, and user events real. Stub loadPreferences, mock savePreferences, and spy on telemetry.trackEvent.
Create fresh fixture data. Start with emailUpdates true and pushNotifications false.
Render the component and wait for the initial settings to appear.
Use userEvent to click the Push notifications switch and then the Save button.
Await asynchronous completion with findByRole or waitFor. Do not use a fixed sleep.
Assert the visible success message and final switch state.
Assert that savePreferences received the expected preference object and trackEvent received preferences_saved with the expected payload.
Reset or restore test doubles and any changed global state so the next test starts cleanly.
Code
importReact, { useEffect, useState } from'react';
import { afterEach, describe, expect, it, vi } from'vitest';
import { render, screen } from'@testing-library/react';
import userEvent from'@testing-library/user-event';
import'@testing-library/jest-dom/vitest';
// These functions represent the external collaborators shown in the diagram.const loadPreferences = vi.fn();
const savePreferences = vi.fn();
const telemetry = {
trackEvent() {},
};
functionNotificationPreferences() {
const [preferences, setPreferences] = useState(null);
const [saved, setSaved] = useState(false);
useEffect(() => {
// Read the initial settings from the controlled load dependency.loadPreferences().then(setPreferences);
}, []);
if (!preferences) {
return<p>Loading</p>;
}
asyncfunctionhandleSave() {
// Wait until the mocked save dependency completes successfully.awaitsavePreferences(preferences);
// Record telemetry only after the save has completed.
telemetry.trackEvent('preferences_saved', preferences);
setSaved(true);
}
return (
<div><label>
Email updates
<inputtype="checkbox"role="switch"checked={preferences.emailUpdates}onChange={(event) =>
setPreferences((current) => ({
...current,
emailUpdates: event.target.checked,
}))
}
/>
</label><label>
Push notifications
<inputtype="checkbox"role="switch"checked={preferences.pushNotifications}onChange={(event) =>
setPreferences((current) => ({
...current,
pushNotifications: event.target.checked,
}))
}
/>
</label><buttontype="button"onClick={handleSave}>
Save
</button>
{saved ? <prole="status">Preferences saved</p> : null}
</div>
);
}
afterEach(() => {
// Restore spies and reset standalone mocks so tests stay independent.
vi.restoreAllMocks();
vi.resetAllMocks();
});
describe('NotificationPreferences', () => {
it('saves changed preferences and records telemetry', async () => {
// Use a small explicit fixture so the initial UI is deterministic.const preferencesFixture = {
emailUpdates: true,
pushNotifications: false,
};
// Stub the load return value with the controlled fixture.
loadPreferences.mockResolvedValue(preferencesFixture);
// Mock the save dependency so this test performs no real external save.
savePreferences.mockResolvedValue(undefined);
// Spy on telemetry because the important behavior is the call and payload.const trackEventSpy = vi.spyOn(telemetry, 'trackEvent');
// Render the real component while controlling only its external collaborators.render(<NotificationPreferences />);
const user = userEvent.setup();
// Wait for the loaded fixture, then change the Push notifications setting.const pushSwitch = await screen.findByRole('switch', {
name: /push notifications/i,
});
await user.click(pushSwitch);
// Use the same accessible Save action a user would use.await user.click(screen.getByRole('button', { name: /save/i }));
// Wait for observable asynchronous feedback instead of using a fixed sleep.const status = await screen.findByRole('status');
expect(status).toHaveTextContent(/preferences saved/i);
// Verify the visible control reflects the saved user choice.expect(pushSwitch).toBeChecked();
// Verify the stubbed load dependency was used for the initial settings.expect(loadPreferences).toHaveBeenCalledTimes(1);
// Verify the mocked save dependency received the exact changed values.expect(savePreferences).toHaveBeenCalledWith({
emailUpdates: true,
pushNotifications: true,
});
// Verify the telemetry spy recorded the expected event and payload.expect(trackEventSpy).toHaveBeenCalledWith('preferences_saved', {
emailUpdates: true,
pushNotifications: true,
});
});
});
Why Interviewers Ask This
Interviewers ask this to see whether I understand how to isolate a frontend component without replacing everything around it. They want to know whether I can choose the right test double, keep user visible behavior real, control external effects, verify important calls, handle asynchronous work correctly, and understand what a mocked component test can and cannot prove.
Common interview mistakes
Common mistakes include mocking the component itself, replacing every collaborator, asserting private component state instead of visible behavior, using a fixed sleep for asynchronous work, sharing mutable fixtures between tests, depending on test order, forgetting to reset mocks or restore spies, and checking only that a function was called without checking the important payload. Another mistake is treating stubs, mocks, and spies as identical. A stub mainly supplies controlled data. A mock controls a dependency and supports interaction expectations. A spy observes how a callable function was used. A mocked component test also must not be presented as proof that the real network or remote service works.
Interview tip
Use the notification component as one simple story. Say that the stub gives known starting data, the mock controls the save dependency, and the spy records the telemetry call. Then explain the user action, the awaited success message, the payload assertions, and cleanup. Finish by stating that the test proves component behavior with controlled boundaries, not the real external systems.
Interviewer may ask next
How would you test the component if saving fails?
I would keep the same component test boundary and change only the savePreferences mock so it rejects, but only if the real component defines visible error behavior. I would perform the same accessible user action, await the error feedback, verify that success feedback is not shown, and verify that telemetry is not recorded if telemetry is supposed to run only after a successful save. This matters because the rejected dependency is still inside the controlled save boundary. The limitation is that this tests the component response to rejection, not a real network failure.
When should this test move to a real browser or a wider integration boundary?
I would keep this component test for the normal rendered behavior and add a real browser test when confidence depends on actual browser behavior such as focus, navigation, storage, compatibility, service workers, or a complete user journey. The boundary then expands beyond the isolated component and its controlled collaborators. This matters because mocks cannot prove those integrations. The tradeoff is that real browser tests usually take longer to run, require more setup, and can add more CI maintenance.
76. Design an accessibility regression strategy beyond automated rule checks.TestingHard
i Question Details
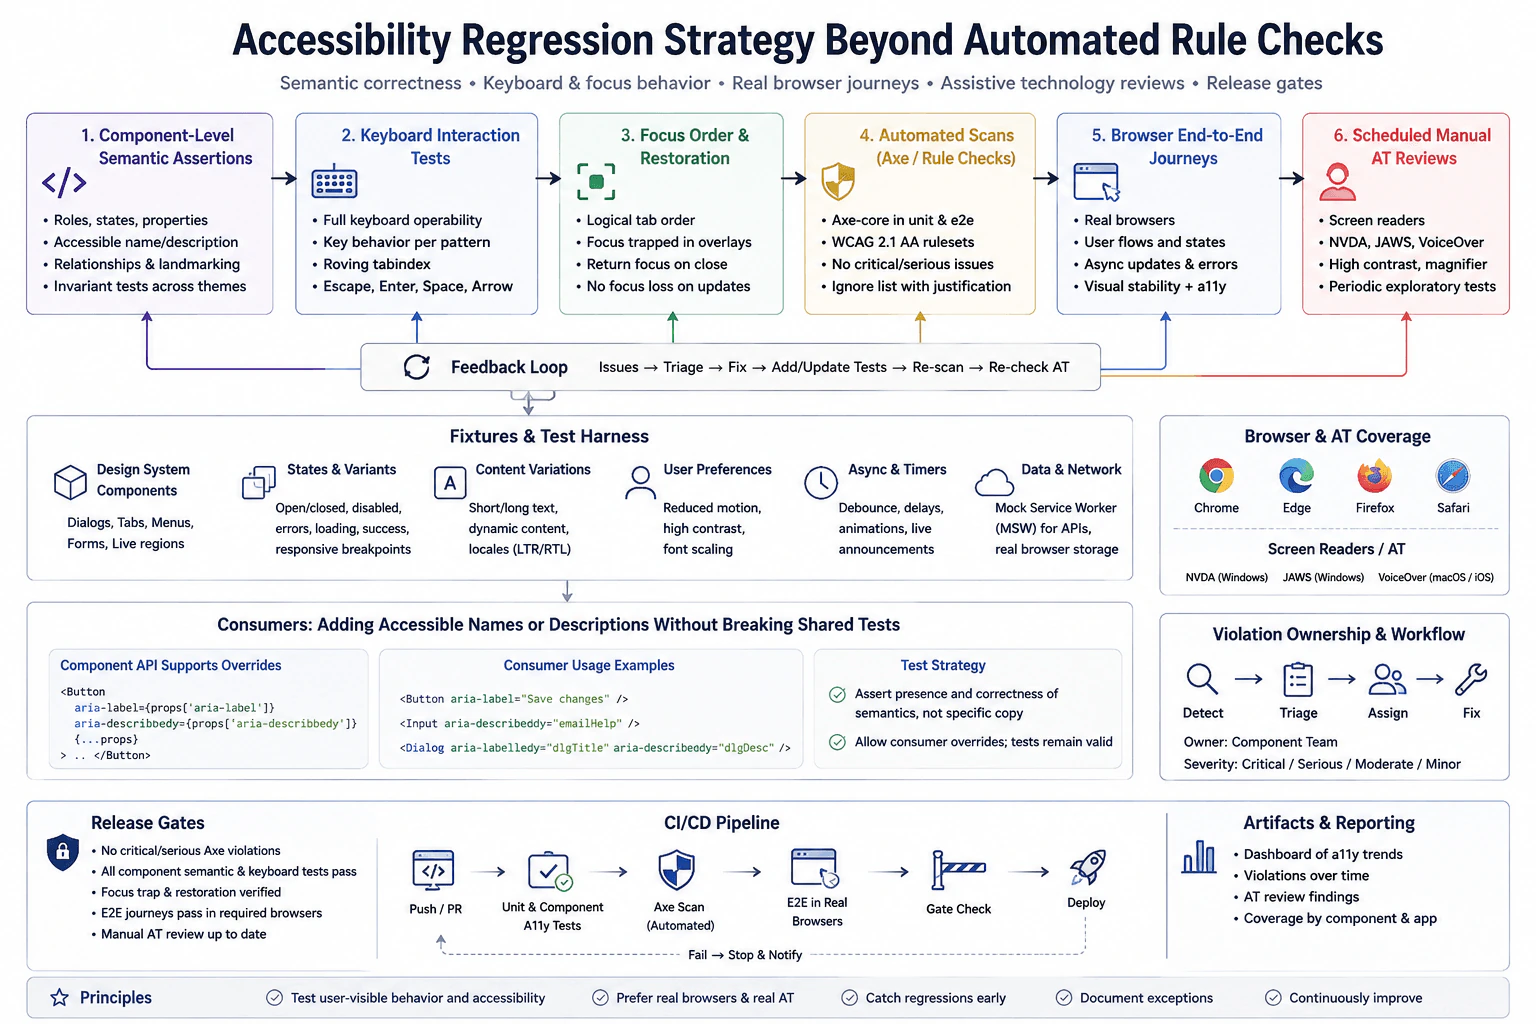
A design system supplies dialogs, tabs, menus, forms, and live notifications to many applications. Define component-level semantic assertions, keyboard interaction tests, focus-order and restoration checks, automated scans, browser end-to-end journeys, and scheduled manual assistive-technology reviews. Specify fixtures, asynchronous state changes, browser and screen-reader coverage, real versus mocked dependencies, violation ownership, and release gates. Explain how consumers can add accessible names or descriptions without invalidating shared tests.
Short Interview Answer (30-60 seconds)
I would use several confidence layers because an automated accessibility scan cannot prove that a component works well for a real keyboard or screen reader user. At the component level, I would test roles, names, descriptions, states, keyboard behavior, logical focus order, and focus restoration. I would run axe scans as a safety net, then verify important journeys in real browsers and schedule manual assistive technology reviews. I would keep network and timing behavior controlled where useful, but keep the real component, DOM, rendering, and focus behavior in browser tests. Releases would be blocked for serious violations, broken keyboard behavior, lost focus, or missing announcements. Shared tests would check required semantic behavior instead of exact accessible text so consumers can safely provide their own names and descriptions.
Detailed Explanation
The goal is to stop changes that make a shared user interface harder or impossible to use. One automatic tool is not enough because it can find some problems but cannot tell whether every real interaction works correctly. I would check each shared control by itself, then check complete user journeys in real browsers, and finally review important flows with assistive tools used by people. I would also define stable test data, clear ownership, and release rules so problems are found early, assigned quickly, and do not silently reach many applications.
Useful Questions to Ask the Interviewer
Which browsers and screen readers must the design system officially support?
Which components and user journeys are important enough to require manual assistive technology review before a major release?
Which accessibility severity levels should block a release?
Are consumer applications allowed to replace accessible names and descriptions through component properties or content slots?
How to Explain It in an Interview
I would begin with the accessibility contract for each design system component. A dialog, tab, menu, form control, or live notification should expose the correct role, accessible name, description when needed, state, and relationships. Shared component tests should assert these required semantics across important themes and variants. They should not depend on incidental DOM structure or exact consumer text.
Next I would test keyboard behavior using realistic user actions. Dialogs should keep focus inside while open and return focus to the trigger when they close. Tabs and menus should follow the keyboard behavior expected by their pattern, including arrow keys, Enter, Space, and Escape where applicable. Focus order should remain logical. Dynamic updates should not unexpectedly lose focus.
I would use deterministic fixtures for component states such as open, closed, disabled, loading, error, success, and responsive variants. Content fixtures should include short text, long text, dynamic content, different locales, and left to right or right to left layouts when the system supports them. User preference fixtures can cover reduced motion, high contrast, font scaling, and other supported preferences when those states affect behavior.
Asynchronous behavior must also be controlled. If a component waits for a delay, animation, debounce, or live announcement, I would wait for an observable result instead of using a fixed sleep. Fake timers are useful only when timer behavior itself needs control, and they must be restored after the test. For data requests, Mock Service Worker can provide stable loading, success, empty, and error responses without depending on production services.
I would run automated accessibility scans such as axe at the component and browser journey levels. The ruleset should match the accessibility standard supported by the product, such as WCAG 2.1 AA when that is the project requirement. These scans catch many rule based problems and provide fast feedback in continuous integration. They are a safety net, not the whole strategy. A passing scan does not prove correct keyboard order, useful announcements, correct focus restoration, or good screen reader interaction.
For browser end to end coverage, I would use real browsers because layout, focus, rendering, keyboard navigation, and browser behavior matter. Important flows would include dialogs, tabs, menus, forms, and live notifications in realistic application journeys. I would cover the browsers the product officially supports. The approved diagram shows Chrome, Edge, Firefox, and Safari as the browser matrix, with NVDA and JAWS on Windows and VoiceOver on macOS and iOS as the main screen reader coverage.
Manual assistive technology review is the final confidence layer for important components and journeys. A scheduled review should include screen reader navigation, keyboard use, announcements, focus changes, high contrast behavior, magnification where relevant, and other supported assistive technology needs. The review should happen periodically and before major releases when the risk justifies it. Human testing catches usability problems that automated rule engines cannot understand.
Real and replaced dependencies should be chosen carefully. I would keep the real component, DOM, rendering, CSS, browser focus behavior, and browser interaction real in browser tests. I would replace unstable external boundaries such as network responses or controlled timing when doing so makes the test deterministic. A mocked network response proves that the component handles that response correctly. It does not prove that a production service or the real network works.
Every violation needs an owner. Component defects belong to the design system component team. Consumer specific problems belong to the consuming application team. Findings should be triaged by severity such as critical, serious, moderate, or minor, then assigned, fixed, and followed by a new or updated regression test when practical. Exceptions should require a written reason so ignored findings do not become invisible debt.
Release gates should reflect risk. A release should stop when new critical or serious axe violations are introduced, when required component semantic or keyboard tests fail, when focus trapping or restoration breaks, when important announcements disappear, or when required browser journeys fail. Manual assistive technology reviews should also remain current according to the agreed release policy.
Consumers must be able to add accessible names and descriptions without breaking shared tests. The component API can allow supported properties such as ariaLabel and ariaDescribedBy or well defined content slots. Shared tests should assert that the component has a valid role, an accessible name when required, correct relationships, and other minimum semantics. They should not assert one exact name such as Save changes unless that wording is part of the component contract. This lets consumers localize or customize accessible text while the design system still guarantees the minimum accessibility contract.
The complete strategy forms a feedback loop. Tests and reviews find an issue. The team triages it, assigns it, fixes it, adds or updates coverage, runs scans again, and repeats manual assistive technology checks when needed. This gives fast automated feedback while still testing the parts of accessibility that require a real browser and human judgment.
Technical Approach
Define the accessibility contract for each shared component. Specify required roles, names, descriptions, states, relationships, keyboard behavior, focus behavior, and announcements.
Build deterministic fixtures for component states, content variants, user preferences, locale, responsive layouts, asynchronous changes, and controlled data responses.
Run component tests with accessible queries and realistic keyboard actions. Assert semantic behavior, focus order, focus containment, focus restoration, and visible or announced state changes.
Run axe scans as an automated safety net. Track new violations separately from approved exceptions and assign each finding to an owner.
Run important user journeys in real supported browsers. Keep DOM, rendering, CSS, focus, and browser interaction real while controlling unstable external data when useful.
Schedule manual reviews with the supported screen readers and other assistive technology for important components and release milestones.
Apply release gates for new critical or serious axe violations, failed semantic tests, keyboard failures, focus failures, missing announcements, required browser journey failures, or overdue manual reviews.
Let consumers provide accessible names and descriptions through supported component inputs or slots. Test the required semantic contract rather than exact consumer wording.
When a defect is found, triage it, assign it, fix it, add or update regression coverage, rerun automated checks, and repeat manual review when the change affects assistive technology behavior.
Practical Insights
Traditional algorithmic complexity does not meaningfully apply here. The main costs are test runtime, browser startup, fixture maintenance, assistive technology coverage, and human review time. Component tests and axe scans are relatively fast, so they can run often in continuous integration. Real browser journeys are slower and should focus on important flows. Manual screen reader testing is the most expensive layer because a person must perform it, so it is usually scheduled for important components, risky changes, and major releases. A larger browser and screen reader matrix gives more confidence but also increases continuous integration time and maintenance work.
Why Interviewers Ask This
Interviewers ask this question to see whether I understand that accessibility quality needs several kinds of evidence. They want to know if I can choose the right boundary for component tests, browser tests, automated scans, and manual assistive technology reviews. They also evaluate whether I can control fixtures and asynchronous behavior, keep tests reliable, assign ownership for violations, and create release rules that prevent serious accessibility regressions from reaching users.
Common interview mistakes
A common mistake is treating a passing axe scan as proof that the interface is accessible. Automated rules cannot fully validate keyboard behavior, focus order, focus restoration, announcements, or screen reader usability. Another mistake is testing private DOM structure instead of the semantic contract that users experience. Teams also make tests brittle by asserting one exact accessible name when consumers are allowed to customize or localize it. Other mistakes include mocking browser behavior that should be tested in a real browser, using production services for end to end tests, using fixed sleep calls for asynchronous updates, sharing mutable fixtures between tests, forgetting to restore timers or handlers, ignoring loading and error states, leaving violations without an owner, and allowing exceptions without a documented reason.
Interview tip
Explain the strategy as confidence layers. Start with semantic and keyboard behavior in component tests, add automated scans for fast rule checking, use real browsers for complete journeys, and finish with scheduled human assistive technology review. Then explain ownership and release gates. Make it clear that each layer catches a different class of accessibility regression and that shared tests protect the semantic contract without blocking consumer supplied names or descriptions.
Interviewer may ask next
How would you prevent an accessibility test for a live notification from becoming flaky when the announcement appears asynchronously?
I would control the asynchronous boundary and wait for an observable accessibility result instead of sleeping for a fixed amount of time. At the component boundary, I would render the real live notification component, trigger the user action, and wait until the live region contains the expected announcement or accessible state. If a timer controls the delay, I can use fake timers and restore them after the test. If data comes from a request, Mock Service Worker can return a deterministic response. This matters because fixed sleeps make tests slow and unreliable. The tradeoff is that controlled timing proves the component handles the expected sequence, but it does not replace a real browser journey or manual screen reader review.
How would you keep this accessibility strategy practical when the design system supports many browsers, screen readers, and consumer applications?
I would keep broad and fast coverage at the component boundary, then use a smaller risk based matrix for expensive browser and manual assistive technology testing. Component semantic tests, keyboard tests, and axe scans can run for every change. Critical user journeys can run in the required real browsers. Manual NVDA, JAWS, VoiceOver, or other supported assistive technology reviews can focus on important components, risky changes, and scheduled release milestones. This matters because running every possible combination on every change would be too slow and expensive. The tradeoff is less exhaustive coverage on each commit, so the team needs a documented support matrix, severity based release gates, ownership, and scheduled deeper reviews.
77. Design consumer-contract testing that detects frontend API drift before release.TestingHard
i Question Details
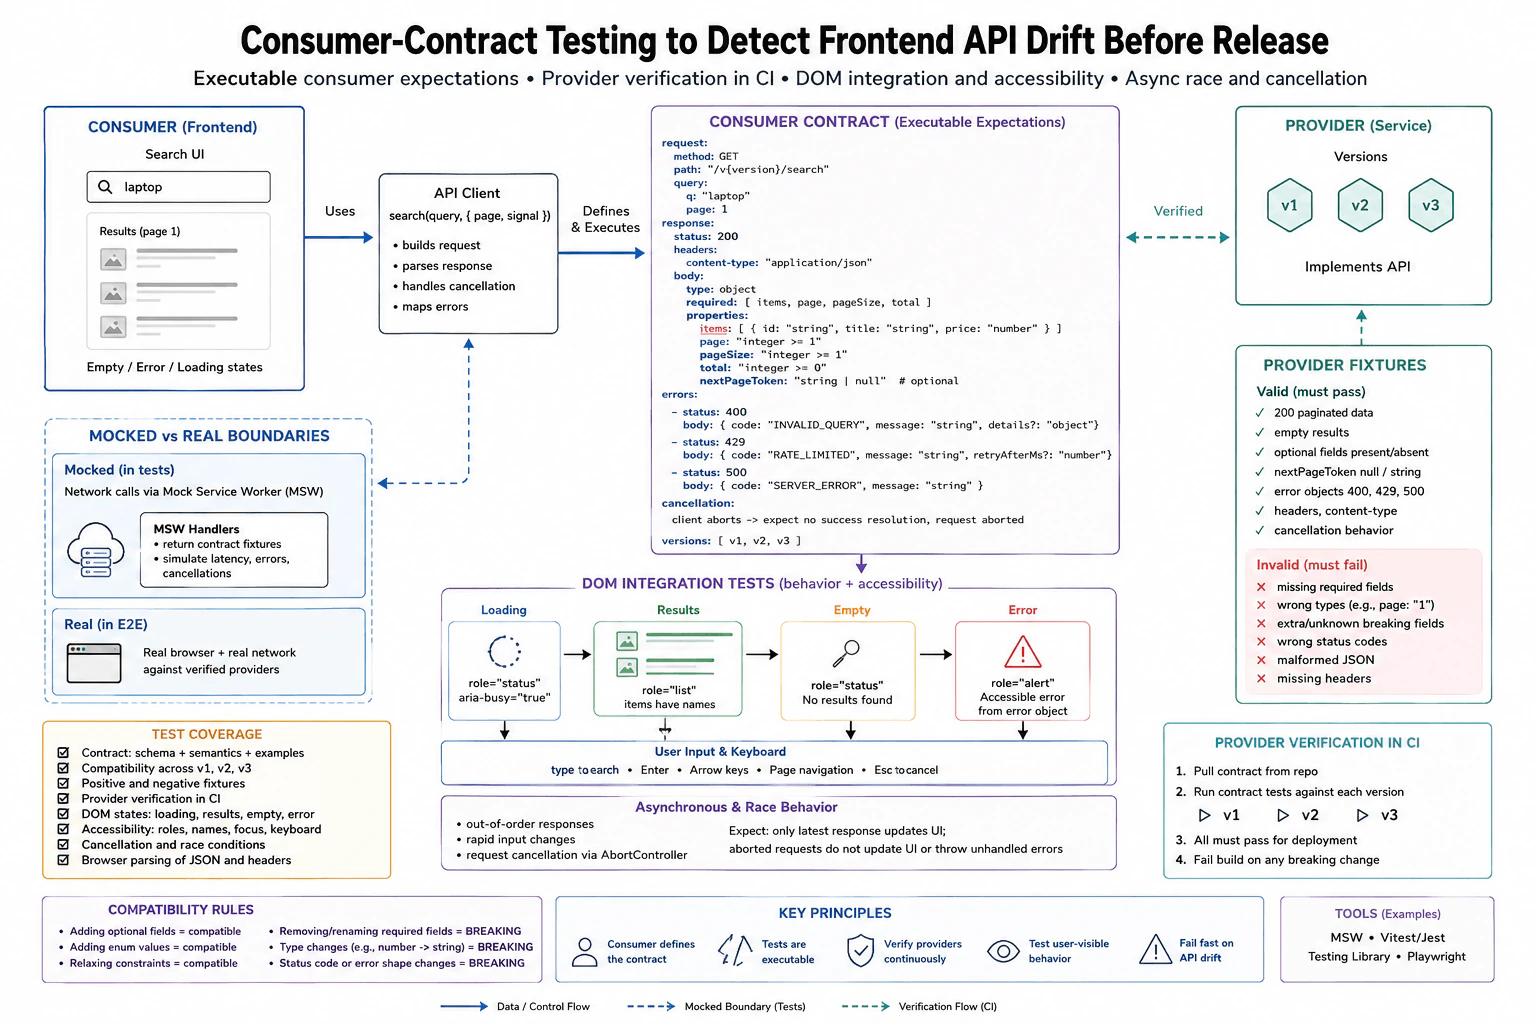
A frontend depends on paginated search responses, typed error objects, optional fields, and cancellation behavior from three service versions. Specify executable consumer expectations, valid and invalid provider fixtures, schema and semantic assertions, compatibility rules, and provider verification in CI. Connect the contract to DOM integration tests that render loading, results, empty, and accessible error states after keyboard input, identify mocked versus real provider boundaries, and cover browser parsing and asynchronous race behavior.
Short Interview Answer (30-60 seconds)
I would make the frontend define executable contracts for the search request, paginated success data, typed errors, optional fields, and cancellation. I would verify versions v1, v2, and v3 against those contracts in CI. For frontend behavior, I would render the real search UI and replace only the network boundary with Mock Service Worker. I would test loading, results, empty, and accessible error states through keyboard input. I would also test aborts and stale responses. These controlled tests are fast, but provider verification and a small real browser suite are still needed for real integration confidence.
The goal is to catch a service change before it breaks the search screen. The frontend writes clear examples of the requests and answers it depends on. These examples cover normal pages, empty pages, optional values, known errors, and cancelled requests. Each supported service version must prove that it still follows those expectations before release. Browser tests then check what a person actually sees after typing with the keyboard. They check loading, results, no results, and an understandable error message. They also prove that an older request cannot replace a newer result.
Useful Questions to Ask the Interviewer
Must versions v1, v2, and v3 all remain compatible at the same time?
Which response fields are required and which fields are optional?
Are 400, 429, and 500 the error responses the frontend officially supports?
Should a new search cancel the previous request automatically?
Does CI provide a controlled deployed provider for the real browser checks?
How to Explain It in an Interview
I would build three connected confidence layers.
First, the consumer contract describes exactly what the frontend depends on. The search request uses GET with a versioned path such as /v2/search. The request contains the search text and pagination information. A successful response contains page, pageSize, total, items, and an optional nextPageToken. Each item contains the fields that the UI reads. The contract also describes the supported 400, 429, and 500 error objects and the expected cancellation behavior.
The contract checks both structure and meaning. Structure checks confirm that required fields exist and have the expected types. Meaning checks confirm rules such as page being an integer of at least one, pageSize being positive, total not being smaller than the returned item count, and item identifiers being unique. An optional nextPageToken may be absent or null, but when present it must have the documented type. This matters because valid JSON can still contain values that break the frontend.
I would create small provider fixtures for important cases. Valid fixtures include a normal page, an empty result, optional fields present or absent, supported error objects, and cancellation behavior. Invalid fixtures include missing required fields, wrong field types, malformed JSON, missing required headers, unsupported status behavior, and changes that violate an existing semantic rule. These negative fixtures prove that the verifier can reject incompatible provider behavior instead of only proving that good examples pass.
Compatibility rules must be explicit. Adding an optional field is normally compatible because existing consumers can ignore it. Relaxing a constraint can be compatible when the consumer still accepts the wider value range. Adding an enum value is compatible only when the consumer is designed to handle an unknown value safely. Removing or renaming a required field is breaking. Changing a field from a number to a string is breaking. Changing an error shape or changing the meaning of an existing status can also be breaking. A new query parameter should remain optional unless all existing consumers are changed together.
In CI, the provider verifier pulls the consumer contract and runs it against each supported provider version, v1, v2, and v3. Every required contract must pass before deployment. A provider build fails when a required request, response, semantic rule, or compatibility rule no longer matches. This catches drift before release instead of waiting for a user facing frontend failure.
For DOM integration tests, I would render the real search UI. The component, request construction, response parsing, AbortController behavior, keyboard handling, and DOM updates remain real. I would replace only the network boundary with Mock Service Worker. The user types into the search box with Testing Library user events and submits with the keyboard. The test observes a loading state with status semantics and busy state, then observes a results list, an empty status message, or an accessible alert for an error. Assertions use accessible roles and visible text instead of private component state.
I would also exercise relevant keyboard behavior such as Enter to submit and Escape when the product supports cancellation. Focus and browser specific behavior belong in the real browser layer when they depend on actual browser behavior rather than the simulated DOM environment.
For asynchronous races, I would control two requests without fixed sleep calls. The first request stays pending while the second request completes. Only the second result may update the screen. If the new search aborts the first request with AbortController, the aborted request must not produce an error state and must not replace the current results. I would release the controlled responses explicitly so the test is deterministic.
Mock Service Worker gives fast and repeatable frontend tests, but it does not prove that a deployed provider satisfies the contract. Provider verification gives that confidence. I would also keep a smaller Playwright suite that runs in a real browser against a controlled verified provider. That suite covers browser parsing, keyboard behavior, focus, and the complete frontend to provider path.
Each test resets Mock Service Worker handlers and restores any timers or global overrides that it changed. Tests do not share mutable fixtures and do not depend on execution order. The main tradeoff is speed versus breadth. Contract tests and controlled DOM tests are fast and precise. Provider verification and real browser tests cost more CI time, but they cover failures that mocked responses cannot prove.
Key Insight / Why This Solution Works
Define the observable search behavior and supported versions v1, v2, and v3.
Write executable consumer expectations for the request, successful pagination data, optional fields, supported errors, and cancellation.
Add structure assertions for required fields and types.
Add semantic assertions such as valid page values, positive page size, valid totals, and unique item identifiers.
Create valid provider fixtures that must pass and invalid fixtures that must fail.
Define compatibility rules for optional additions, constraint changes, required field removal, type changes, error changes, and new query parameters.
Verify every supported provider version against the contract in CI and block deployment when a required contract fails.
Render the real search UI and replace only the network boundary with Mock Service Worker.
Drive the UI with keyboard input and accessible queries to test loading, results, empty, and error states.
Control overlapping requests so an aborted or stale result cannot replace the newest result.
Run a smaller Playwright flow against a controlled verified provider for real browser confidence.
Reset handlers and restore any timers or global state changed by each test.
Code
importReactfrom'react';
import { afterAll, afterEach, beforeAll, describe, expect, it } from'vitest';
import { render, screen } from'@testing-library/react';
import userEvent from'@testing-library/user-event';
import { http, HttpResponse } from'msw';
import { setupServer } from'msw/node';
importSearchPagefrom'./SearchPage';
const server = setupServer();
beforeAll(() => {
// Start the controlled HTTP boundary used by the DOM integration tests.
server.listen({ onUnhandledRequest: 'error' });
});
afterEach(() => {
// Remove per test handlers so one fixture cannot affect another test.
server.resetHandlers();
});
afterAll(() => {
// Close the HTTP interceptor after the test suite finishes.
server.close();
});
functiondeferred() {
// Give the test explicit control over when an asynchronous response finishes.let resolve;
let reject;
const promise = newPromise((res, rej) => {
resolve = res;
reject = rej;
});
return { promise, resolve, reject };
}
functionassertSearchPage(body) {
// Check the successful response structure consumed by the frontend.expect(body).toEqual(
expect.objectContaining({
page: expect.any(Number),
pageSize: expect.any(Number),
total: expect.any(Number),
items: expect.any(Array),
})
);
// Check semantic rules that simple property checks would miss.expect(Number.isInteger(body.page)).toBe(true);
expect(body.page).toBeGreaterThanOrEqual(1);
expect(Number.isInteger(body.pageSize)).toBe(true);
expect(body.pageSize).toBeGreaterThanOrEqual(1);
expect(Number.isInteger(body.total)).toBe(true);
expect(body.total).toBeGreaterThanOrEqual(body.items.length);
const ids = body.items.map((item) => item.id);
expect(newSet(ids).size).toBe(ids.length);
for (const item of body.items) {
expect(item).toEqual(
expect.objectContaining({
id: expect.any(String),
title: expect.any(String),
price: expect.any(Number),
})
);
}
// The pagination token is optional, but its type is stable when present.if (body.nextPageToken !== undefined && body.nextPageToken !== null) {
expect(typeof body.nextPageToken).toBe('string');
}
}
functionassertTypedError(status, body) {
// Check the error objects that the frontend explicitly understands.if (status === 400) {
expect(body).toEqual(
expect.objectContaining({
code: 'INVALID_QUERY',
message: expect.any(String),
})
);
if (body.details !== undefined) {
expect(body.details).toEqual(expect.any(Object));
}
return;
}
if (status === 429) {
expect(body).toEqual(
expect.objectContaining({
code: 'RATE_LIMITED',
message: expect.any(String),
})
);
if (body.retryAfterMs !== undefined) {
expect(body.retryAfterMs).toEqual(expect.any(Number));
}
return;
}
if (status === 500) {
expect(body).toEqual(
expect.objectContaining({
code: 'SERVER_ERROR',
message: expect.any(String),
})
);
return;
}
thrownewError(`Unsupported contract status: ${status}`);
}
describe('consumer contract expectations', () => {
it('accepts a valid paginated provider fixture', () => {
// This example represents data that a supported provider may return.const fixture = {
page: 1,
pageSize: 20,
total: 1,
items: [{ id: 'p1', title: 'Laptop', price: 999 }],
nextPageToken: null,
};
assertSearchPage(fixture);
});
it('accepts an empty page', () => {
// Empty results are valid and must not be confused with an error response.const fixture = {
page: 1,
pageSize: 20,
total: 0,
items: [],
};
assertSearchPage(fixture);
});
it('rejects a breaking field type change', () => {
// A string page value is incompatible even though the JSON itself is valid.const invalidFixture = {
page: '1',
pageSize: 20,
total: 0,
items: [],
};
expect(() =>assertSearchPage(invalidFixture)).toThrow();
});
it('accepts the supported typed error contracts', () => {
// These examples document the error shapes the UI knows how to render.assertTypedError(400, {
code: 'INVALID_QUERY',
message: 'Query is invalid',
details: {},
});
assertTypedError(429, {
code: 'RATE_LIMITED',
message: 'Try again later',
retryAfterMs: 1000,
});
assertTypedError(500, {
code: 'SERVER_ERROR',
message: 'Service failed',
});
});
});
describe('search DOM integration', () => {
it('renders loading and then accessible results after keyboard input', async () => {
const response = deferred();
// MSW replaces only HTTP while SearchPage and its request parsing stay real.
server.use(
http.get('/v2/search', async ({ request }) => {
const url = newURL(request.url);
expect(url.searchParams.get('q')).toBe('laptop');
return response.promise;
})
);
const user = userEvent.setup();
render(<SearchPageversion="v2" />);
// Drive the same search interaction that a keyboard user performs.await user.type(screen.getByRole('searchbox'), 'laptop');
await user.keyboard('{Enter}');
// Observe loading before explicitly releasing the controlled response.expect(screen.getByRole('status')).toHaveAttribute('aria-busy', 'true');
response.resolve(
HttpResponse.json({
page: 1,
pageSize: 20,
total: 1,
items: [{ id: 'p1', title: 'Laptop', price: 999 }],
nextPageToken: null,
})
);
// Await visible results instead of waiting for an arbitrary amount of time.expect(await screen.findByRole('list')).toBeInTheDocument();
expect(screen.getByText('Laptop')).toBeInTheDocument();
});
it('renders the empty state', async () => {
// Return a valid empty page through the controlled HTTP boundary.
server.use(
http.get('/v2/search', () =>HttpResponse.json({
page: 1,
pageSize: 20,
total: 0,
items: [],
})
)
);
const user = userEvent.setup();
render(<SearchPageversion="v2" />);
await user.type(screen.getByRole('searchbox'), 'nothing');
await user.keyboard('{Enter}');
// Assert the user visible empty state through its accessible status.expect(await screen.findByRole('status')).toHaveTextContent('No results found');
});
it('shows an accessible error from a typed provider error', async () => {
// Return one supported typed error through the controlled HTTP boundary.
server.use(
http.get('/v2/search', () =>HttpResponse.json(
{ code: 'INVALID_QUERY', message: 'Query is invalid', details: {} },
{ status: 400 }
)
)
);
const user = userEvent.setup();
render(<SearchPageversion="v2" />);
await user.type(screen.getByRole('searchbox'), 'bad query');
await user.keyboard('{Enter}');
// Assert the error through the accessible alert exposed to the user.expect(await screen.findByRole('alert')).toHaveTextContent('Query is invalid');
});
it('keeps only the newest result when requests overlap', async () => {
const firstResponse = deferred();
const secondResponse = deferred();
let requestNumber = 0;
server.use(
http.get('/v2/search', () => {
requestNumber += 1;
return requestNumber === 1 ? firstResponse.promise : secondResponse.promise;
})
);
const user = userEvent.setup();
render(<SearchPageversion="v2" />);
const searchbox = screen.getByRole('searchbox');
// Start the older request and then immediately start a newer request.await user.type(searchbox, 'lap');
await user.keyboard('{Enter}');
await user.clear(searchbox);
await user.type(searchbox, 'laptop');
await user.keyboard('{Enter}');
// Finish the newest request first so its result becomes current state.
secondResponse.resolve(
HttpResponse.json({
page: 1,
pageSize: 20,
total: 1,
items: [{ id: 'new', title: 'Newest result', price: 20 }],
})
);
expect(await screen.findByText('Newest result')).toBeInTheDocument();
// Finish the older request afterward and prove stale data cannot replace the UI.
firstResponse.resolve(
HttpResponse.json({
page: 1,
pageSize: 20,
total: 1,
items: [{ id: 'old', title: 'Old result', price: 10 }],
})
);
expect(await screen.findByText('Newest result')).toBeInTheDocument();
expect(screen.queryByText('Old result')).not.toBeInTheDocument();
});
});
Why Interviewers Ask This
Interviewers ask this to see whether I can protect a frontend from API changes before users find the problem. They want to see whether I can choose the correct test boundary, define useful consumer expectations, separate controlled frontend tests from real provider verification, test asynchronous browser behavior, and create reliable CI gates across several supported service versions.
Common interview mistakes
A common mistake is checking only JSON structure and forgetting semantic rules such as valid page values or unique identifiers. Another mistake is replacing the API client itself, which skips request construction, parsing, and cancellation behavior that this question wants to test. It is also wrong to treat Mock Service Worker tests as proof that the real provider is compatible. Other mistakes include sharing mutable fixtures, accepting every unknown value without a compatibility policy, ignoring invalid provider fixtures, testing only success, using fixed sleep calls for races, forgetting to reset handlers, and allowing stale responses to replace the newest search result.
Interview tip
Explain the confidence layers in order. Start with the consumer contract, then provider verification in CI, then the DOM integration test with Mock Service Worker, and finally the small real browser check. State clearly what is controlled and what stays real. Use one concrete breaking example, such as page changing from a number to a string, and one race example where only the newest search result may update the UI.
Interviewer may ask next
How would you test a race where the first search finishes after the second search?
I would control the network boundary with Mock Service Worker or controllable promises. I would keep the first request pending, start a second search, and complete the second response first. The assertion is that only the second result updates the real DOM. Then I would complete or abort the first request and prove that it does not replace the current result or create an unexpected error. This matters because timing bugs can appear even when every individual response is valid.
Why not run every frontend test against the real provider instead of using Mock Service Worker?
I would keep Mock Service Worker at the frontend network boundary for most DOM integration tests because it makes success, empty, error, cancellation, and race cases deterministic. Provider verification in CI separately proves that v1, v2, and v3 satisfy the consumer contract. I would add a smaller Playwright suite against a controlled verified provider for real browser and deployment confidence. The tradeoff is CI cost. Real integration gives broader confidence, but it is slower and harder to isolate than controlled contract and DOM tests.
78. Design tests for an autocomplete that must ignore stale responses.TestingMedium
i Question Details
The search field waits 200 ms after typing, requests suggestions, and displays only results for the latest query even when responses arrive out of order. Define unit coverage for the request-selection logic, a DOM integration test that types ca then cat, controlled response fixtures that resolve in reverse order, and a browser test for focus and keyboard selection. Specify loading, empty, error, and selected states; accessible combobox semantics and announcements; timer and network mocks; cancellation or stale-result behavior; and cleanup on unmount.
Short Interview Answer (30-60 seconds)
I would make the latest query rule the main invariant. A unit test proves that only the newest request id can update suggestions. A DOM test renders the real autocomplete, controls the 200 millisecond debounce with fake timers, and controls the network so the cat response arrives before the older ca response. The UI must keep the cat results after ca finishes. I would separately cover loading, empty, error, selected, cancellation, accessibility, and unmount cleanup. Then I would use a small real browser test for focus, ArrowDown, Enter, and selection. The tradeoff is speed versus browser confidence.
The search box waits briefly before asking for suggestions. The important rule is that an old answer must never replace a newer answer. The tests should make this difficult timing case happen on purpose, every time. They should also check what the person sees while waiting, when nothing is found, when a request fails, and after a suggestion is chosen. The plan should check keyboard use, focus, spoken updates for assistive tools, and safe cleanup when the component disappears. This gives confidence without depending on unpredictable real network timing.
Useful Questions to Ask the Interviewer
Should a new query abort the previous request, or is ignoring an old response enough?
What should the live status announce for loading, result count, empty, and error states?
Should the browser test use controlled test data or a deployed test service?
How to Explain It in an Interview
The core invariant is simple: only the latest query may change the suggestion list. I would give each request an increasing request id. When a response returns, its id is compared with the active id. A matching id may update the state. An older id is stale and is ignored.
First, I would unit test only that request selection rule. Start a request for ca, then a newer request for cat. Resolve cat first with cat facts. Then resolve ca with older data. The stored suggestions must still contain cat facts. I would also cover rejection and reset behavior so an older success cannot replace the state that belongs to a newer request.
Next, I would render the real autocomplete in a DOM test. I would use fake timers only for the 200 millisecond debounce. I would use Mock Service Worker at the network boundary with controlled response promises. The test types ca and advances the debounce so its request starts. It then types the final t, which changes the input from ca to cat, and advances the debounce again. The cat response is released first. The ca response is released last. The visible list must continue showing cat results after the old response finishes.
The visible states should have focused tests. Loading exposes a status such as Searching. Empty shows No results. Error shows the supported failure message. Selected puts the chosen suggestion into the input and closes the list. These tests should use accessible queries instead of private component fields.
The input should expose the combobox role, aria expanded, aria controls, and aria activedescendant when an option is active. The popup should use the listbox role. Suggestions should use the option role, and the active option should expose aria selected. A live status should announce useful changes such as the number of results. An automated axe check can be added as a supplemental check, but it does not replace direct tests for semantics, focus, keyboard behavior, and announcements.
For cancellation, I would abort the previous fetch with AbortController when a newer request starts, but I would still keep the request id guard. Aborting reduces unnecessary work. The id guard protects correctness if cancellation races with completion or an old result still reaches the component. An AbortError caused by a newer search should not become a user facing error.
Cleanup matters for reliability. When the component unmounts, it should clear a pending debounce timer, abort an active request, remove listeners that it created, and prevent later work from updating state. The test suite should restore real timers and reset Mock Service Worker handlers after every test.
Finally, I would use Playwright for the behavior that needs a real browser. Focus the combobox, enter cat, wait for the suggestion list, press ArrowDown, press Enter, verify the selected value, verify that the list closes, and verify that focus remains on the input. I would not use fixed sleep calls. I would wait for visible browser conditions.
In CI, unit and DOM tests provide fast coverage for many timing and state cases. A smaller browser suite gives confidence in focus and keyboard behavior. Controlled network tests do not prove that a production service is available or that its real contract is unchanged. That requires a separate contract or deployed integration check.
Key Insight / Why This Solution Works
Define the invariant that only the latest query can update suggestions.
Unit test the request selection logic with increasing request ids.
Start ca, then start cat, and release their results in reverse order.
Assert that the cat result stays selected after the older ca result arrives.
Render the real autocomplete for the DOM boundary.
Use fake timers only to control the 200 millisecond debounce.
Use Mock Service Worker with controlled response promises to control network order.
Test loading, empty, error, selected, aborted, and stale outcomes with focused cases.
Assert combobox, listbox, option, active option, and live status behavior with accessible queries.
Test timer and request cleanup when the component unmounts.
Use Playwright for real browser focus and keyboard selection.
Reset handlers, restore timers, and remove test state after every test.
Code
// selector.test.jsimport { describe, expect, test } from'vitest';
import { createRequestSelector } from'./selector';
describe('request selection', () => {
test('keeps the latest result when an older response arrives last', () => {
// Start two searches so the second request becomes the active request.const selector = createRequestSelector();
const caId = selector.search('ca');
const catId = selector.search('cat');
// Apply the newest response first.
selector.response(catId, ['cat facts']);
expect(selector.getSuggestions()).toEqual(['cat facts']);
// Deliver the older response last and prove that it cannot replace current data.
selector.response(caId, ['ca facts']);
expect(selector.getSuggestions()).toEqual(['cat facts']);
});
});
// Autocomplete.test.jsximportReactfrom'react';
import'@testing-library/jest-dom/vitest';
import { afterAll, afterEach, beforeAll, describe, expect, test, vi } from'vitest';
import { cleanup, render, screen } from'@testing-library/react';
import userEvent from'@testing-library/user-event';
import { http, HttpResponse } from'msw';
import { setupServer } from'msw/node';
import { Autocomplete } from'./Autocomplete';
// Create an explicit response gate so the test decides when a request completes.functiondeferred() {
let resolve;
const promise = newPromise((next) => {
resolve = next;
});
return { promise, resolve };
}
const server = setupServer();
beforeAll(() => {
// Reject unexpected requests so missing fixtures fail loudly.
server.listen({ onUnhandledRequest: 'error' });
});
afterEach(() => {
// Remove rendered UI and restore every shared test boundary.cleanup();
server.resetHandlers();
vi.useRealTimers();
vi.restoreAllMocks();
});
afterAll(() => {
server.close();
});
describe('Autocomplete', () => {
test('shows cat results when the older ca response resolves last', async () => {
const caResponse = deferred();
const catResponse = deferred();
// Hold both network responses until the test releases them.
server.use(
http.get('/api/suggest', async ({ request }) => {
const query = newURL(request.url).searchParams.get('q');
if (query === 'ca') {
const body = await caResponse.promise;
returnHttpResponse.json(body);
}
if (query === 'cat') {
const body = await catResponse.promise;
returnHttpResponse.json(body);
}
returnHttpResponse.json([]);
})
);
// Fake time only while exercising the two debounce periods.
vi.useFakeTimers();
const user = userEvent.setup({ advanceTimers: vi.advanceTimersByTime });
render(<Autocomplete />);
const input = screen.getByRole('combobox');
// Enter ca and let its 200 ms debounce start request one.await user.type(input, 'ca');
await vi.advanceTimersByTimeAsync(200);
// Add t so the query becomes cat, then start request two.await user.type(input, 't');
await vi.advanceTimersByTimeAsync(200);
// Restore real time before waiting for asynchronous network and DOM work.
vi.useRealTimers();
// Release the latest response first and verify the current result.
catResponse.resolve(['cat facts', 'catalog', 'cataract']);
expect(await screen.findByRole('option', { name: 'cat facts' })).toBeInTheDocument();
// Release the stale response last and verify that it is ignored.
caResponse.resolve(['ca facts']);
expect(await screen.findByRole('option', { name: 'cat facts' })).toBeInTheDocument();
expect(screen.queryByRole('option', { name: 'ca facts' })).not.toBeInTheDocument();
});
test('shows loading and then the empty state', async () => {
const response = deferred();
server.use(
http.get('/api/suggest', async () => {
const body = await response.promise;
returnHttpResponse.json(body);
})
);
vi.useFakeTimers();
const user = userEvent.setup({ advanceTimers: vi.advanceTimersByTime });
render(<Autocomplete />);
const input = screen.getByRole('combobox');
// Start the request and check the visible loading announcement while it is pending.await user.type(input, 'none');
await vi.advanceTimersByTimeAsync(200);
vi.useRealTimers();
expect(screen.getByRole('status')).toHaveTextContent(/searching/i);
// Resolve with no suggestions and verify the empty state.
response.resolve([]);
expect(await screen.findByText(/no results/i)).toBeInTheDocument();
});
test('shows the error state when the latest request fails', async () => {
const response = deferred();
server.use(
http.get('/api/suggest', async () => {
await response.promise;
returnHttpResponse.error();
})
);
vi.useFakeTimers();
const user = userEvent.setup({ advanceTimers: vi.advanceTimersByTime });
render(<Autocomplete />);
const input = screen.getByRole('combobox');
// Start the latest request, then release a controlled network failure.await user.type(input, 'fail');
await vi.advanceTimersByTimeAsync(200);
vi.useRealTimers();
response.resolve();
expect(await screen.findByText(/try again|failed/i)).toBeInTheDocument();
});
test('moves a selected suggestion into the input and closes the list', async () => {
server.use(
http.get('/api/suggest', () =>HttpResponse.json(['cat facts', 'catalog', 'cataract']))
);
vi.useFakeTimers();
const user = userEvent.setup({ advanceTimers: vi.advanceTimersByTime });
render(<Autocomplete />);
const input = screen.getByRole('combobox');
// Load suggestions for cat.await user.type(input, 'cat');
await vi.advanceTimersByTimeAsync(200);
vi.useRealTimers();
const option = await screen.findByRole('option', { name: 'cat facts' });
// Select through the visible option instead of calling component internals.await user.click(option);
expect(input).toHaveValue('cat facts');
expect(screen.queryByRole('listbox')).not.toBeInTheDocument();
});
test('exposes combobox semantics, active option state, and announcements', async () => {
server.use(
http.get('/api/suggest', () =>HttpResponse.json(['cat facts', 'catalog', 'cataract']))
);
vi.useFakeTimers();
const user = userEvent.setup({ advanceTimers: vi.advanceTimersByTime });
render(<Autocomplete />);
const input = screen.getByRole('combobox');
// The closed input exposes its combobox relationship before results appear.expect(input).toHaveAttribute('aria-expanded', 'false');
expect(input).toHaveAttribute('aria-controls');
await user.type(input, 'cat');
await vi.advanceTimersByTimeAsync(200);
vi.useRealTimers();
// Results use listbox and option roles and announce their count.expect(await screen.findByRole('listbox')).toBeInTheDocument();
expect(input).toHaveAttribute('aria-expanded', 'true');
expect(screen.getAllByRole('option')).toHaveLength(3);
expect(screen.getByRole('status')).toHaveTextContent(/3 results/i);
// Keyboard movement keeps DOM focus on the input and identifies the active option.await user.keyboard('{ArrowDown}');
expect(input).toHaveFocus();
expect(input).toHaveAttribute('aria-activedescendant');
expect(screen.getByRole('option', { name: 'cat facts' })).toHaveAttribute(
'aria-selected',
'true'
);
});
test('clears a pending debounce timer when unmounted', async () => {
vi.useFakeTimers();
const user = userEvent.setup({ advanceTimers: vi.advanceTimersByTime });
const { unmount } = render(<Autocomplete />);
const input = screen.getByRole('combobox');
// Typing creates a pending debounce timer before any request is sent.await user.type(input, 'ca');
expect(vi.getTimerCount()).toBeGreaterThan(0);
// Unmount must remove the pending timer so later work cannot run.unmount();
expect(vi.getTimerCount()).toBe(0);
});
test('aborts an active request when unmounted', async () => {
const response = deferred();
const abortSpy = vi.spyOn(AbortController.prototype, 'abort');
server.use(
http.get('/api/suggest', async () => {
const body = await response.promise;
returnHttpResponse.json(body);
})
);
vi.useFakeTimers();
const user = userEvent.setup({ advanceTimers: vi.advanceTimersByTime });
const { unmount } = render(<Autocomplete />);
const input = screen.getByRole('combobox');
// Let the debounce finish so a request is active before unmount.await user.type(input, 'cat');
await vi.advanceTimersByTimeAsync(200);
// Unmount must cancel the active request through the browser abort boundary.unmount();
expect(abortSpy).toHaveBeenCalled();
// Release the controlled handler so no test work remains pending.
response.resolve(['cat facts']);
});
});
// autocomplete.spec.jsimport { expect, test } from'@playwright/test';
test('supports focus and keyboard selection in a real browser', async ({ page }) => {
// Control only the suggestion request while keeping real browser focus and keyboard behavior.await page.route('**/api/suggest?*', async (route) => {
const query = newURL(route.request().url()).searchParams.get('q');
await route.fulfill({
status: 200,
contentType: 'application/json',
body: JSON.stringify(query === 'cat' ? ['cat facts', 'catalog', 'cataract'] : []),
});
});
await page.goto('/');
const combo = page.getByRole('combobox');
// Use observable browser conditions instead of a fixed sleep.await combo.fill('cat');
awaitexpect(page.getByRole('listbox')).toBeVisible();
// Move to the first option and select it with the keyboard.await combo.press('ArrowDown');
await combo.press('Enter');
// Selection updates the input, closes the popup, and keeps focus on the combobox.awaitexpect(combo).toHaveValue('cat facts');
awaitexpect(page.getByRole('listbox')).toBeHidden();
awaitexpect(combo).toBeFocused();
});
Why Interviewers Ask This
Interviewers ask this question to see whether you can separate unit, DOM, and real browser confidence. They want to know whether you can control time and network order, reproduce a race reliably, assert visible behavior, test accessibility, handle cancellation safely, and clean up timers and requests so one test cannot affect another.
Common interview mistakes
Common mistakes are using fixed sleep calls, resolving requests only in normal order, checking private component state instead of visible behavior, mocking the entire component instead of the timer or network boundary, forgetting to restore fake timers, sharing mutable handlers across tests, treating AbortError as a user failure, relying only on cancellation without a stale request guard, skipping loading and failure states, ignoring combobox semantics, and claiming a controlled network test proves that the real remote service works.
Interview tip
Start with the invariant that only the newest query can update the list. Then explain the unit race test, the DOM test with fake time and reversed responses, the visible state and accessibility checks, cleanup on unmount, and the small real browser test for focus and keyboard selection.
Interviewer may ask next
What if aborting the ca request races with completion and its response still reaches the component?
I would keep the request id check at the component state boundary even when AbortController is used. Cancellation reduces wasted work, but the id comparison is the correctness rule. The test starts ca, starts cat, lets cat update the list, and then delivers the old ca result anyway. The visible list must remain the cat list. This matters because cancellation and completion can happen close together. The tradeoff is a small amount of extra state logic for stronger protection.
Would you move all reverse response cases into Playwright for more confidence?
No. I would keep the detailed reverse response cases at the DOM network boundary and use Playwright for the smaller real browser boundary. The DOM tests are faster and make request order easy to control, so they are better for stale, empty, error, and cancellation cases. Playwright should focus on behavior that needs a real browser, especially focus and keyboard selection. The tradeoff is that more browser tests add stronger browser confidence but also increase CI time and debugging cost.
79. Design an end-to-end test architecture for a critical checkout journey.TestingHard
i Question Details
The journey covers cart review, address entry, asynchronous tax calculation, a third-party payment frame, order submission, and confirmation navigation. Define which behaviors stay in unit, DOM integration, contract, and browser end-to-end layers; the fixtures and test accounts; pointer and keyboard interactions; accessible errors and focus movement; network timing and failure injection; browser matrix; and real versus mocked payment and backend boundaries. Include data cleanup, failure artifacts, retry policy, and a rule that prevents the suite from validating only happy paths.
Short Interview Answer (30-60 seconds)
I would keep pure calculations and validation in unit tests, component behavior in DOM integration tests, request and response rules in contract tests, and reserve real browser tests for the complete checkout journey. In the browser layer I would use seeded accounts and carts, realistic pointer and keyboard actions, controlled backend responses through Mock Service Worker, and the real payment provider test frame in staging. I would test both success and failure cases, verify accessible errors and focus movement, collect failure artifacts, clean data after each run, and allow at most one retry only for an identified network or browser flake. The main tradeoff is that browser tests give strong user confidence but cost more time and maintenance, so checks that do not need a browser should stay in lower layers.
Detailed Explanation
The goal is to prove that a shopper can finish checkout and also gets clear help when something goes wrong. Small rules should be checked separately, while the complete shopping journey should run in a real browser. The test starts with known customer, cart, address, and card data. Outside responses are controlled so slow and failed cases are repeatable. The test checks clicking, typing, keyboard use, messages, focus, order completion, and page navigation. After every test it removes created data and saves useful evidence when a failure happens.
Useful Questions to Ask the Interviewer
Which browsers and mobile environments are officially supported?
Is the payment provider test frame available in staging?
Which backend boundaries should use controlled responses, and which services must remain real?
What cleanup APIs or test data helpers already exist?
How to Explain It in an Interview
I would start with the confidence boundary. Unit tests cover pure logic such as tax helpers, currency formatting, address validation, totals, and reducers. DOM integration tests render the real components and check visible behavior such as address validation, the tax loading state, updated tax values, disabled submission, accessible errors, and focus movement. Contract tests check request construction and response parsing for the checkout API boundaries. The browser end to end layer then checks the complete journey in a real browser from cart review to confirmation navigation.
For the browser layer I would use Playwright with the browser environments supported and pinned by the project. The approved diagram shows Chromium, Firefox, and WebKit, plus supported desktop coverage and mobile smoke coverage. The environment uses seeded data, UTC time, and the en US locale. I would interact like a user with pointer actions and keyboard actions such as Tab, Enter, Escape, and arrow keys. I would assert visible results, accessible names, announced errors, logical focus movement, and final navigation instead of private component state.
For data, I would use a fresh customer identity or another isolated test identity for each run. I would seed a cart, use valid and invalid addresses including a PO Box case, and use payment provider test cards for success, decline, and 3DS behavior. Tests must not share mutable customer or cart state. Unique data per run lets the suite execute in parallel without collisions.
The frontend backend boundary should be controlled with Mock Service Worker for deterministic browser tests. It can return the normal responses and inject slow tax responses, validation failures, server errors, timeouts, and network loss. This proves how the frontend behaves when those conditions occur, but it does not prove the real remote backend behaves correctly.
The payment boundary is different. In staging, the real payment provider test frame should remain real so the test exercises the hosted frame and the browser interaction around it. In deterministic environments where that integration is intentionally excluded, the payment boundary can be stubbed. Analytics and tracking can also be stubbed while still checking that the frontend sends the expected events.
The important asynchronous rule is to wait for observable behavior instead of using a fixed sleep. After address entry, for example, the test can wait for the tax loading state and then wait for either the updated tax amount or the visible error state. If timer behavior such as polling or debounce is part of the frontend logic, fake timers can control that behavior in the appropriate lower level test and must be restored afterward.
The suite must cover more than the successful path. Every browser test file should include at least one negative or error scenario. Useful cases include an invalid address, slow tax calculation, tax timeout, server failure during order creation, payment decline, payment cancellation, and temporary network loss. This rule prevents a green suite from proving only that the easiest path works.
Accessibility is part of the user behavior. Validation errors should be announced, invalid fields should expose the correct accessible state, and focus should move to the first invalid field when appropriate. The checkout should also be usable through the keyboard. Automated accessibility checks can catch common problems, but they do not prove complete assistive technology compatibility.
Visual regression checks are useful for critical checkout states such as cart, address, payment, errors, and confirmation at stable viewports. They should supplement behavior assertions rather than replace them.
When a browser test fails, I would keep a screenshot, video, console logs, network HAR data, and a DOM snapshot when available. These artifacts make CI failures much easier to diagnose.
Cleanup should remove carts and created orders through supported cleanup APIs, revoke sessions or cookies, restore network handlers, restore timers, and reset changed browser state. Teardown should be idempotent so repeating cleanup is safe.
I would not use blind retries. A retry can hide a real defect. The approved design allows at most one retry only for an identified network flake or browser crash. Application failures should fail immediately. CI should require the supported browser matrix, accessibility checks, no severe console errors, approved visual differences, coverage thresholds, isolated data, and the negative scenario rule before merge.
The main tradeoff is confidence versus cost. Real browser tests give strong confidence because they exercise routing, focus, navigation, browser behavior, and the payment frame. They are slower and more expensive to maintain. Pure logic, component states, and API contract checks therefore stay in lower layers. The browser suite remains focused on complete user behavior and risky boundaries that lower layers cannot prove.
Technical Approach
Define the observable checkout journey from cart review through confirmation.
Put pure calculations, formatters, validators, and reducers in unit tests.
Put form behavior, loading states, validation messages, accessibility behavior, and focus movement in DOM integration tests.
Put request construction and response parsing in contract tests.
Seed isolated customer, cart, address, and payment test data.
Run the complete journey in Playwright using realistic pointer and keyboard actions.
Control frontend backend responses with Mock Service Worker and inject slow responses, validation errors, server errors, timeouts, and network loss.
Keep the payment provider test frame real in staging and use a stub only where that real integration is intentionally outside the deterministic test boundary.
Assert visible content, accessible errors, focus movement, order submission, and confirmation navigation.
Add visual checks for stable critical checkout states where they provide useful regression coverage.
Require at least one negative scenario in every browser test file.
Capture screenshots, video, console logs, network HAR data, and a DOM snapshot when failures occur.
Clear carts and orders, revoke sessions, restore handlers and timers, and reset test state after every run.
Run the supported browser matrix in CI and allow at most one retry only for an identified network or browser flake.
Practical Insights
Algorithmic complexity is not the main concern for this testing architecture. The practical cost comes from browser startup, page navigation, seeded data, payment frame interaction, controlled network setup, screenshots, videos, and repeating important journeys across supported browsers. Unit and DOM integration tests are much cheaper, so they should handle most small rules and component states. Browser tests should cover complete journeys and important failures. More browser environments, payment cases, and failure scenarios increase CI time and maintenance cost. Parallel execution can reduce total time, but each test needs isolated data so parallel runs do not interfere with one another.
Why Interviewers Ask This
Interviewers ask this question to see whether I can choose the right test boundary instead of putting every check into a browser test. They want to know whether I can separate pure logic, component behavior, API contracts, and complete browser journeys. They also evaluate practical judgment around isolated test data, accessibility, controlled network failures, third party payment behavior, browser coverage, cleanup, failure evidence, retry limits, and negative scenarios. A strong answer shows that I can create high confidence without making the suite unnecessarily slow or fragile.
Common interview mistakes
Common mistakes include putting every case into a browser test, which makes the suite slow and fragile. Another mistake is mocking the payment interface so deeply that the staging test never exercises the real hosted frame. Teams also create flaky tests by using fixed sleep calls, sharing customer or cart data, depending on test order, or leaving handlers, timers, cookies, and sessions active after a test. Weak tests check only that an action happened instead of checking the visible result. Blind retries can hide application defects. Testing only successful checkout is also dangerous because validation failures, payment decline, timeouts, server errors, network loss, accessible error messages, and focus movement are critical parts of the user experience. Another mistake is treating a mocked backend test as proof that the real remote backend works.
Interview tip
Explain the design from cheap confidence to expensive confidence. First say what stays in unit, DOM integration, and contract tests. Then explain why the complete journey needs a real browser. After that, describe what is controlled, what stays real, how failures are injected, how accessibility is checked, and how data is cleaned. Finish with the negative scenario rule and the limited retry policy. This shows that you are designing a reliable test system rather than only naming tools.
Interviewer may ask next
How would you test a slow tax request and prevent that browser test from becoming flaky?
I would control the frontend backend boundary with Mock Service Worker and return the tax response after a controlled delay. The browser test would submit the address, assert that the loading state appears, and then wait for either the updated tax amount or the visible error state with Playwright expectations. I would not use a fixed sleep. If debounce or polling logic needs direct timer control, I would test that timer behavior at the lower level where fake timers are appropriate and restore the clock afterward. This matters because the browser test should prove visible asynchronous behavior without depending on unpredictable network timing. The tradeoff is that this proves frontend handling of the scenario, not the real tax service.
What would you change if the browser suite became too slow in CI?
I would keep the same browser end to end boundary but remove duplicate cases from it. Logic cases would remain in unit tests, component states would remain in DOM integration tests, and request shape cases would remain in contract tests. The browser suite would keep the complete checkout journey, important accessibility behavior, the real payment frame in staging, and a focused set of negative scenarios. I would also run independent browser tests in parallel with isolated data. I would not solve the problem by adding broad retries because that can hide defects. The tradeoff is that fewer browser cases reduce execution time while lower layers must carry more detailed state coverage.
80. Design an integration test for an accessible modal dialog.TestingMedium
i Question Details
A Delete project button opens a confirmation dialog rendered into a document-level portal. The dialog must receive focus, contain Tab navigation, close on Escape or Cancel, return focus to the trigger, and show a progress state while deletion runs. Define fixture content, pointer and keyboard interactions, synchronous and asynchronous assertions, accessibility checks, portal cleanup, DOM-environment limitations, mocked delete responses, and the real-browser cases needed for focus and scroll behavior.
Short Interview Answer (30-60 seconds)
I would render the real project settings UI with a document level portal root and control only the delete request with Mock Service Worker. I would open the dialog through the Delete project button, verify that focus moves into the dialog, check Tab and Shift Tab navigation, then test Escape and Cancel separately and confirm that focus returns to the trigger. For deletion, I would keep the request pending long enough to assert the progress state, then resolve it and verify that the dialog closes. I would also run accessibility checks, clean up the portal and handlers, and cover true focus order and page scroll behavior in a real browser because a simulated document cannot prove those behaviors.
Detailed Explanation
This test checks what a person experiences when deleting a project. The page starts with a Delete project button. Pressing it should open a confirmation box and move attention inside it. Keyboard movement must stay inside the box. Escape and Cancel must close it and return attention to the original button. When the person confirms deletion, the box must show that work is happening. After success, it should disappear. The test also checks that temporary page content is removed and that important behavior is tested again in a real browser where needed.
Useful Questions to Ask the Interviewer
Should Cancel receive focus first when the dialog opens, or should another control receive the initial focus?
What visible message should appear when the delete request fails?
Does opening the dialog intentionally lock page scrolling in the production component?
How to Explain It in an Interview
I would treat this as a frontend integration test because several real pieces work together: the project settings component, the document level portal, focus management, keyboard handling, visible progress state, and the delete request boundary. I would keep those frontend pieces real and replace only the remote delete response with Mock Service Worker.
The fixture is small. It contains one project, a visible Delete project button, and the portal target used by the component. Before the action, the dialog should not exist and the trigger can be the active element.
I would use Testing Library user events instead of calling component methods. First I click Delete project. I then query the dialog by its role and accessible name, such as Delete project?. The first synchronous checks are that the dialog exists, has the expected modal semantics, and focus is now inside the dialog. In the approved flow, Cancel is the first focusable control.
Next I test keyboard containment. Pressing Tab moves from Cancel to Delete. Another Tab wraps back to Cancel if those are the only focusable controls. Shift Tab moves in the opposite direction. I do not prove this by checking private focus management code. I check document.activeElement or the visible focused control.
Escape is one closing path. I press Escape, verify that the dialog is removed, and verify that focus returns to the Delete project trigger. I reopen the dialog and test Cancel separately because a pointer or keyboard activation of Cancel is another required user path. It should also remove the dialog and restore focus to the trigger.
For the delete path, I reopen the dialog and click Delete. Mock Service Worker controls the DELETE request at the request boundary shown in the approved design. While that response is pending, the dialog should show a visible progress message such as Deleting project..., expose the busy state when the component uses it, and prevent another delete submission. I wait for observable state instead of using a fixed delay. After the mocked success response resolves, I wait until the dialog is removed and verify the successful visible result expected by the component.
I also provide a failure response with Mock Service Worker. The failure test should verify the product behavior that the component actually defines, such as keeping the dialog open and showing Cannot delete. The important point is that the failure is controlled at the same network boundary and is not produced by changing private component state.
Accessibility checks combine targeted assertions with an automated axe scan. I verify the dialog role, accessible name, modal semantics, accessible names for Cancel and Delete, focus movement, keyboard behavior, and the progress announcement exposed by the component. An axe result is useful for detectable rule violations, but it does not prove that focus trapping, announcements, or assistive technology behavior works correctly in every browser.
Cleanup matters because the dialog is rendered into document level state. After each test, the rendered component is removed, the portal must not contain a leftover dialog, Mock Service Worker handlers are reset, and any changed mocks, timers, body styles, or global values are restored according to their lifetime. Tests must not depend on another test leaving the page in a certain state.
A simulated DOM is useful for fast integration checks, but it does not provide full browser layout, scrolling, or native focus behavior. I would therefore add a small real browser suite with Playwright or the project's existing browser runner. That suite should verify real Tab and Shift Tab order, focus restoration after Escape and Cancel, page scroll locking while the dialog is open, restoration of scrolling after close, visible focus styling, and important viewport behavior. Manual assistive technology checks are still needed for screen reader announcements.
The main tradeoff is speed versus browser confidence. The simulated integration tests are fast and precise, so they can cover most states on every change. The real browser tests are slower, so I would keep them focused on behavior that the simulated environment cannot faithfully prove.
Technical Approach
Create a small fixture with one project, the Delete project trigger, and the portal target used by the real component.
Start with no dialog and record the trigger as the expected focus return target.
Click Delete project with a realistic user event.
Find the dialog by role and accessible name, then assert its modal semantics and initial focus inside the dialog.
Press Tab and Shift Tab to verify that keyboard navigation stays within the dialog and wraps between the available controls.
Press Escape, verify that the dialog is removed, and verify that focus returns to the Delete project trigger.
Reopen the dialog and activate Cancel. Verify the same close and focus return behavior.
Reopen the dialog and confirm deletion. Use Mock Service Worker to control the DELETE response.
While the response is pending, assert the visible progress state, busy state when exposed by the component, and protection against repeated deletion.
Resolve the success response and wait for the dialog to disappear and the visible success result to appear.
Override the Mock Service Worker handler with the approved failure response and verify the component's visible failure behavior without changing private state.
Run automated axe checks together with direct assertions for role, accessible name, focus, keyboard behavior, and progress announcement.
Remove rendered content, reset Mock Service Worker handlers, and restore any global state changed by the test.
Run focused real browser cases for native focus order, focus return, page scroll lock, visible focus styling, and viewport behavior.
Practical Insights
Algorithmic time and space complexity are not the important measure for this test. The practical cost comes from how many user states and environments are exercised. The simulated integration tests are relatively fast because the page is rendered locally and the delete request is controlled. Mock Service Worker adds a small setup and maintenance cost but gives a realistic request boundary. Automated accessibility checks add some runtime but are still suitable for normal CI. Real browser tests cost more because a browser must start and execute real focus and scroll behavior, so I would keep that suite small and focused. Maintenance cost is lowest when tests use accessible user behavior instead of private DOM structure.
Why Interviewers Ask This
Interviewers ask this question to see whether I can test behavior that crosses several frontend boundaries without confusing a simulated document with a real browser. They want to see whether I can choose realistic user actions, verify focus and keyboard behavior through accessible queries, control the delete request, wait correctly for asynchronous state changes, clean up portal state, and explain which focus and scroll checks still need a real browser.
Common interview mistakes
Common mistakes are checking private component state instead of visible behavior, calling event handlers directly instead of using realistic user actions, mocking the focus manager instead of testing the real focus behavior, replacing too much of the component, and treating a mocked request as proof that the real backend works. Other mistakes include checking only that the dialog appears while ignoring focus, forgetting Shift Tab and Escape, testing Escape but not Cancel, failing to verify focus return, using fixed sleeps for deletion, forgetting the pending progress state, skipping the rejected response, leaving portal content or request handlers behind, and assuming a simulated DOM proves real scrolling or browser focus behavior. Another mistake is relying only on axe and treating zero automated violations as complete accessibility proof.
Interview tip
Start with the user behavior and the confidence boundary. Say what stays real, what is controlled, and what the simulated test can prove. Then walk through open, focus, keyboard navigation, close and focus return, pending deletion, success and failure, accessibility, cleanup, and finally the small set of checks that need a real browser.
Interviewer may ask next
How would you test a failed delete request without making the test flaky?
I would change only the Mock Service Worker delete handler for that test and return the approved failure response. The frontend component, portal, focus behavior, and user interactions stay real. I would click Delete and wait for the visible failure result instead of using a fixed delay. I would also verify that the dialog remains in the correct state and that another test cannot inherit the failure handler because the handlers are reset afterward. This boundary matters because it gives deterministic failure coverage without pretending that the mocked response proves the real remote service works.
Which parts would you move to a real browser test, and why?
I would keep most state and request cases in the fast integration suite, but I would verify native Tab order, Shift Tab wrapping, focus restoration, page scroll locking, visible focus styling, and important viewport behavior in a real browser. The boundary changes from a simulated document to an actual browser environment while the user flow remains the same. This matters because simulated DOM environments do not reproduce layout, scrolling, or every focus detail. The tradeoff is slower CI, so the real browser suite should stay small and target only behavior that needs browser level confidence.
More questions load as you scroll
Disclaimer: This interview guide is for educational and informational purposes only. It is designed to help readers prepare, but it does not guarantee any interview result, hiring decision, offer, or outcome. Interview questions, hiring criteria, and preferred answers can vary by employer, interviewer, industry, location, and time. All answers, examples, and explanations in this guide are suggested examples for interview preparation, not definitive answers or instructions for professional practice. They are based on research and judgment, are provided without warranties of any kind, and should be adapted to the question, role, and applicable laws and professional requirements. Diagrams are simplified illustrations intended to highlight the main concepts and their relationships; actual situations, systems, and practices may be more complex. Alternative approaches may be equally valid or better suited to a particular question, context, or interviewer. To the fullest extent permitted by applicable law, the contributors and publisher are not liable for decisions made, actions taken, or losses incurred based on this guide.
State Laws and Professional Responsibilities: Laws and requirements governing an occupation vary by state and jurisdiction. You are responsible for checking the current laws, licensing requirements, and scope-of-practice rules that apply to your location and role, and for ensuring that your answers and actions comply with them. Adapt examples in this guide to those requirements. This guide is not legal advice.
Content Accuracy and Verification: To the fullest extent permitted by applicable law, we do not represent or warrant that interview guides, questions, answers, examples, or diagrams are accurate, complete, current, error-free, or suitable for any particular purpose. You are responsible for independently reviewing and verifying the information before relying on it.