386 Java Developer Interview Questions & Answers

139 top • 34 Amazon • 36 Apple • 41 Google • 35 Meta • 39 Microsoft • 31 Netflix • 31 NVIDIA

Java Developer icon

Questions with Detailed ExplanationsWith Detailed Explanations

(Last Updated: August 28, 2026)

101. How do you use logging to trace a production issue?DebuggingMedium

Question Details

Explain how logging helps you reconstruct a failure and what you would look for in the logs.

Short Interview Answer (30-60 seconds)

I define the scope and time window, then trace one affected request using a correlation identifier. I inspect the event sequence, complete exception chain, timing, retries, and dependency results, compare failed and successful requests, confirm the cause with other evidence, fix it safely, and verify recovery.

Detailed Explanation

This question asks how I use recorded messages from a live system to understand why something failed for real users. I would explain how I narrow the affected time, people, and actions, then follow one failed operation from beginning to end. I compare it with a successful operation and find the earliest meaningful difference. I also explain how I protect private information, use other evidence when the recorded messages are incomplete, separate a temporary action that reduces harm from the permanent correction, and confirm afterward that the problem is truly fixed and is less likely to return.

Useful clarifying questions:

Useful Questions to Ask the Interviewer
  • Is the issue affecting every request or only certain users, operations, or instances?
  • What is the exact time window, including the time zone?
  • Do we have a request, trace, transaction, or correlation identifier?
  • Which application version and deployment are involved?
  • Which services, databases, queues, caches, or external systems participate?
  • Are the logs centralized, structured, searchable, and complete for that period?
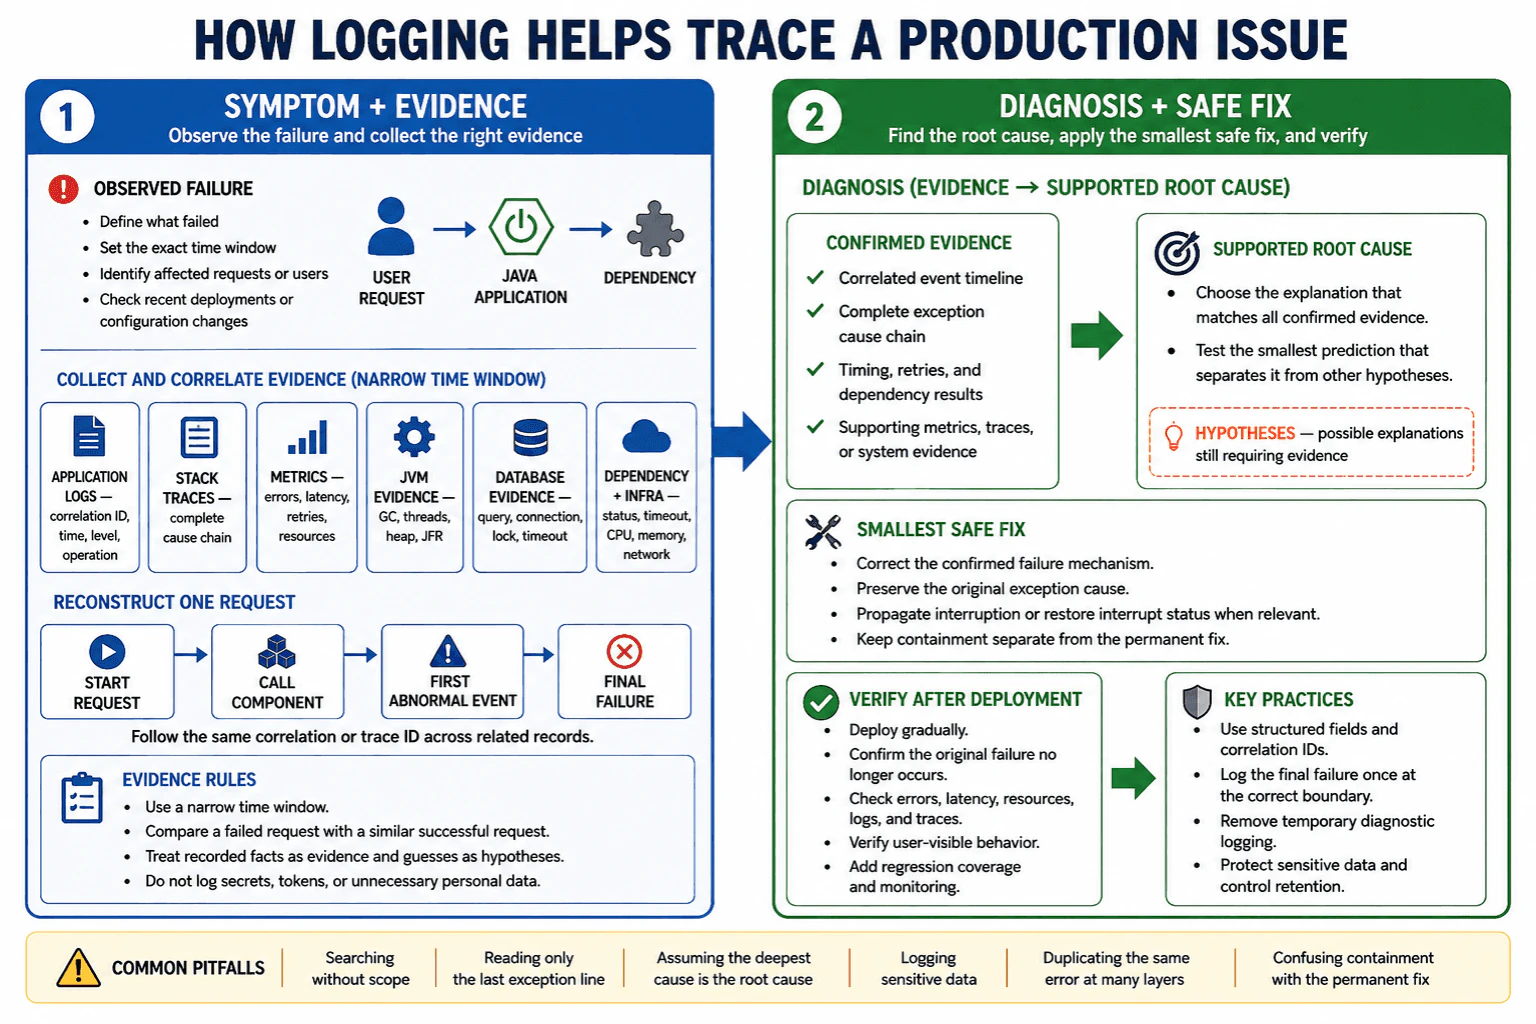
How do you use logging to trace a production issue? diagram
How to Explain It in an Interview

I begin with reproduction, scope, evidence, and the smallest useful diagnostic step. I first establish what failed, when it started, how often it occurs, which requests or users are affected, and whether the failure began after a deployment, configuration change, dependency update, traffic increase, or infrastructure event. I do not begin by enabling broad debug logging across production because that may add noise, cost, performance overhead, or security risk.

Next, I select one representative failed request. A correlation identifier is a safe unique value associated with one request or business operation and included in related log entries. I use it to reconstruct the operation in chronological order across the Java application and its dependencies. In a distributed system, a trace identifier and span identifiers may provide more reliable cross-service correlation than timestamps alone.

If no correlation identifier exists, I narrow the search using the exact time window, endpoint, instance, deployment version, operation, response status, duration, and a safe transaction reference. I treat this reconstruction as less certain because concurrent requests may have similar values. I also account for clock differences between hosts, asynchronous processing, delayed log delivery, duplicated events, log sampling, rotation, and missing entries.

I look for the earliest relevant deviation rather than focusing only on the final error message. I inspect the timestamp and time zone, log level, service, instance, deployment version, thread, operation, duration, response status, retry count, dependency result, and exception details. A warning is not automatically the cause, and an error near the end of the request may only be a consequence of an earlier failure.

For a Java exception, I inspect the complete stack trace and every Caused by section. I start from the top-level failure to understand the operation that failed, then follow the cause chain to find the underlying technical event. I focus on relevant application frames while also checking framework and JDK frames when they explain lifecycle, reflection, concurrency, class loading, networking, or resource behavior. The deepest exception is not automatically the root cause; it must fit the observed failure, timing, inputs, and surrounding evidence.

I distinguish different kinds of failures. A compile error occurs before the application runs and is normally found during compilation or build validation, not through production runtime logs. A linkage error such as NoSuchMethodError or ClassNotFoundException can indicate incompatible artifacts, an incorrect class path or module path, or a deployment packaging problem. A checked or unchecked exception represents an operation failure that application code may handle or propagate. An Error, such as OutOfMemoryError, often indicates a serious JVM, resource, or environment problem and should not be treated like an ordinary recoverable business exception.

Logs may show a symptom without proving the cause. I correlate them with application and infrastructure metrics, distributed traces, deployment records, configuration history, database evidence, message-broker evidence, operating-system evidence, and external-service status. For blocked or deadlocked threads, I capture multiple thread dumps over time because one dump may only show a temporary wait. For memory pressure, I first inspect heap, garbage-collection, native-memory, and container-limit metrics. A heap dump may help with retained-object analysis, but it can be large, sensitive, expensive to create, and disruptive depending on the JVM, heap size, dump method, storage speed, and environment. For intermittent latency, CPU activity, allocation pressure, garbage collection, or locking, Java Flight Recorder can provide relatively low-overhead JVM evidence when configured and used appropriately.

I compare a failed request with a successful request of the same operation and a similar input category. I look for the first important difference in request data, feature flags, application version, instance, thread behavior, database result, cache state, response time, retry pattern, timeout, or external dependency response. This comparison helps separate the root cause from unrelated warnings and background errors.

I also examine retry behavior carefully. Retries may hide a transient failure, duplicate a non-idempotent operation, increase load, or create a retry storm. I check whether timeout values and retry policies are aligned across callers and dependencies. A final timeout in one service may have been caused by slow processing, connection-pool exhaustion, lock contention, overloaded downstream systems, or an earlier timeout elsewhere.

If user impact is continuing, I may contain it by rolling back a release, disabling a feature flag, routing traffic away from unhealthy instances, reducing traffic, disabling harmful retries, or failing over to a healthy dependency. Containment limits impact but does not establish or fix the root cause. I document the workaround separately and continue investigating until the failure mechanism is supported by evidence.

Production logging must be safe and useful. I prefer structured logs with stable field names so events can be searched and aggregated. I do not log passwords, access tokens, session cookies, private keys, payment details, or unnecessary personal information. Masking must be applied before the value reaches the logging system, not only in the log viewer. Access controls, retention limits, encryption, and audit controls are also important because logs may still contain operationally sensitive information.

I avoid logging the same exception as an error at every layer because duplicate stack traces increase storage and indexing costs and make the original event harder to identify. A lower layer may add context and propagate the exception, while the appropriate system boundary records the final failure once. When wrapping an exception, I preserve the original cause. If code catches InterruptedException, it should normally propagate it or restore the interruption status with Thread.currentThread().interrupt() rather than silently consuming it.

I add temporary diagnostic logging only when existing evidence cannot answer a specific question. I limit it by operation, instance, request sample, or feature flag; use rate limits or sampling when appropriate; monitor its volume and latency impact; define an expiry or removal plan; and avoid changing timing-sensitive behavior more than necessary. Logging itself can alter performance and concurrency timing, so absence of the problem after enabling verbose logging does not prove the cause.

After forming a hypothesis, I test the smallest prediction that distinguishes it from competing explanations. When possible, I reproduce the failure in a controlled environment using the same relevant application version, configuration, dependency versions, input characteristics, and resource limits. I then implement the smallest safe root-cause fix, add a regression test or monitoring assertion, deploy gradually, and verify the result through error rates, latency, resource usage, logs, traces, and user-visible outcomes. Finally, I improve correlation fields, log messages, alerts, dashboards, and runbooks when the investigation exposed observability gaps.

Technical Approach
  1. Define the symptom, impact, start time, frequency, affected operations, and recent changes.
  2. Confirm the time zone, deployment version, configuration, and affected application instances.
  3. Choose one representative failed request or business operation.
  4. Search by correlation or trace identifier and reconstruct the event sequence across components.
  5. If no identifier exists, correlate cautiously using a narrow time window and stable contextual fields.
  6. Find the earliest relevant deviation rather than assuming the final error is the cause.
  7. Inspect the complete Java stack trace, cause chain, application frames, timing, retries, and dependency results.
  8. Compare the failed operation with a similar successful operation.
  9. Correlate logs with metrics, traces, deployment history, database evidence, JVM evidence, operating-system evidence, and external-service evidence.
  10. Apply containment separately if the production impact is continuing.
  11. Form competing hypotheses and test the smallest diagnostic prediction that distinguishes them.
  12. Implement the smallest safe root-cause fix while preserving exception causes and interruption behavior.
  13. Add regression coverage, deploy gradually, and verify technical and user-visible recovery.
  14. Remove temporary diagnostics and improve logging, correlation, alerts, and runbooks.
Practical Insights

The cost depends mainly on log volume, retention time, field indexing, search range, and the number of systems involved. Searching one request in a narrow time window is usually much cheaper and faster than scanning all production logs. Structured fields and correlation identifiers reduce investigation time, but they require consistent implementation and add some storage and indexing cost. Large messages, repeated stack traces, and high-volume debug logs increase CPU work, network traffic, storage, indexing load, and maintenance effort. Logging can also create allocation pressure or application delays, especially when messages are built unnecessarily or a logging destination is slow. Asynchronous logging can reduce request-thread blocking, but it uses memory for buffers and may drop, delay, or reorder records during overload or shutdown depending on its configuration. Thread dumps are usually small compared with heap dumps, but repeated collection still has operational cost. A heap dump can approach the size of the used or configured heap, requires enough disk space, may contain sensitive data, and can pause or slow the JVM depending on how it is captured. Java Flight Recorder is generally designed for relatively low overhead, but event selection, stack depth, recording settings, workload, and duration still affect CPU, memory, disk, and file size.

Why Interviewers Ask This

Interviewers want to know whether the candidate can investigate a production failure methodically instead of guessing. This question evaluates how the candidate defines scope, reconstructs events, correlates activity across components, interprets Java exceptions and stack traces, distinguishes symptoms from root causes, protects sensitive information, chooses proportionate diagnostic evidence, and verifies that a fix resolves the issue without introducing a regression.

Common interview mistakes

Common mistakes include searching all logs before defining the scope; ignoring the exact time zone or host clock differences; relying on timestamps alone in a concurrent or distributed system; assuming logs are complete despite sampling, rotation, delayed delivery, or asynchronous processing; reading only the final exception line instead of the complete stack trace and cause chain; assuming the deepest exception is automatically the root cause; treating the loudest warning or error as proof; ignoring deployment version, instance, thread, timing, retries, timeouts, and dependency results; enabling unrestricted debug logging across production; logging secrets or unnecessary personal data; masking data only in the viewer after it has already been stored; building expensive log arguments when the level is disabled; logging the same exception at multiple layers; swallowing exceptions; losing the original cause when wrapping an exception; consuming InterruptedException without propagating it or restoring interruption status; collecting a heap dump without checking disk space, security, or operational impact; treating containment as the permanent fix; and declaring success without regression coverage and post-deployment verification.

Interview tip

Present the investigation as a clear evidence chain: define the scope, trace one representative operation, find the earliest meaningful deviation, inspect the complete Java exception chain, compare failed and successful paths, confirm the hypothesis with independent evidence, contain impact separately, fix the cause, and verify recovery. Mention safe structured logging, correlation identifiers, and proportionate JVM diagnostics.
Interviewer may ask next
What would you do if the logs do not contain a correlation identifier?

I would narrow the time window and combine available fields such as endpoint, instance, deployment version, operation, response status, duration, thread, and a safe transaction reference. I would account for clock differences, asynchronous work, and concurrent requests, so I would treat the reconstructed path as a hypothesis rather than proof. I would confirm it with traces, metrics, database records, queue metadata, or dependency evidence. After the incident, I would add a generated correlation or trace identifier at the system boundary, propagate it through synchronous and asynchronous calls, and include it in structured logs.

How do you add more production logging without causing excessive cost, performance impact, or sensitive-data exposure?

I add only the fields needed to test a specific hypothesis and limit the change by operation, instance, request sample, or feature flag. I use structured fields, rate limits, sampling, and a defined expiration plan. I avoid secrets and unnecessary personal information, apply masking before logging, and verify access and retention controls. I monitor log volume, dropped events, CPU, allocation, memory buffers, disk use, and request latency. When logs are not the best evidence, I choose a more suitable diagnostic source such as metrics, traces, thread dumps, or a carefully configured Java Flight Recorder recording.

102. How do you debug a StackOverflowError?DebuggingMedium

Question Details

Describe how you would investigate recursive call problems or runaway recursion that leads to StackOverflowError.

Short Interview Answer (30-60 seconds)

I reproduce the error and inspect the full stack trace for repeating calls. I identify why the call path does not terminate or becomes too deep, fix the stopping condition, cycle handling, or traversal design, and verify the result with normal, boundary, cyclic, malformed, and deep inputs.

Detailed Explanation

A StackOverflowError happens when one task keeps calling more tasks before earlier calls can finish, until the program runs out of room for that chain of work. I would first reproduce the failure with the smallest input and note where and when it occurs. Next, I would read the repeated sequence in the failure report to find the loop of calls. Then I would determine why the work never reaches a stopping point, correct that logic, and test ordinary, unusual, circular, and very large inputs to confirm the program now finishes safely.

Useful clarifying questions:

Useful Questions to Ask the Interviewer
  • Does it fail for every input or only for particular data?
  • Is the recursion intentional, or could callbacks, object relationships, generated methods, or framework configuration create a cycle?
  • Is the complete stack trace available, including the first repeating sequence?
  • Can the issue be reproduced with the same Java version, JVM options, application version, and input as the failing environment?
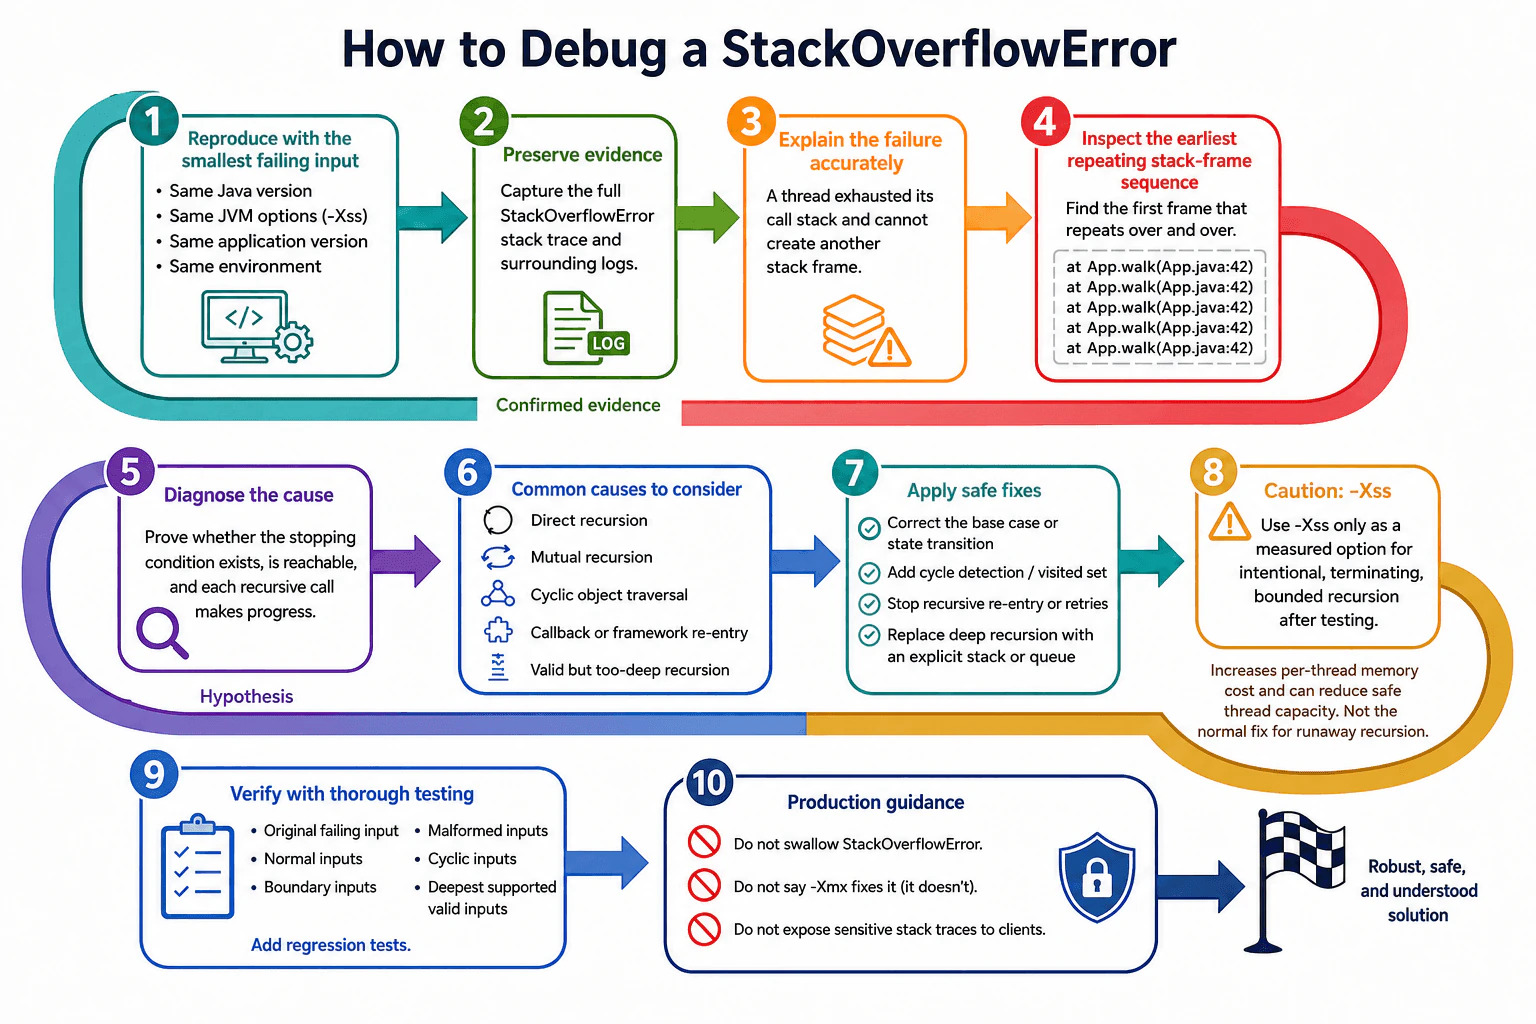
How do you debug a StackOverflowError? diagram
How to Explain It in an Interview

I would begin by reproducing the StackOverflowError with the smallest known input. I would record the exact Java version, JVM options such as -Xss, application version, environment, failing thread, request or job identifier, and full stack trace. This establishes the scope and avoids assuming that a failure seen in one environment has the same cause everywhere.

StackOverflowError is a subclass of Error. The JVM normally throws it when a thread cannot create another stack frame because that thread's call stack has been exhausted. A stack frame stores information for one active method call, including return information and some method state. The usual causes are recursion that never terminates, cyclic calls among several methods or objects, or finite recursion whose depth exceeds the stack available to that thread.

The smallest useful diagnostic step is to inspect the stack trace for repetition. One method repeated many times suggests direct recursion. A repeating sequence such as A -> B -> C -> A suggests mutual or indirect recursion. Repeated calls involving serializers, dependency injection, proxies, callbacks, event handlers, equals, hashCode, or toString can indicate recursive framework re-entry or a cyclic object graph rather than an obvious recursive algorithm.

I would inspect the earliest useful occurrence of the repeating sequence, not only the last frame printed. Stack traces can be long or truncated, so I would preserve the original logs and avoid replacing the failure with a generic message. I would examine the arguments and state passed between repeated calls and verify three properties: a stopping condition exists, it can actually be reached, and each recursive call makes measurable progress toward it.

Typical defects include a missing base case, the wrong comparison at a boundary, passing the original value instead of a reduced value, resetting progress on every call, following bidirectional object relationships without cycle detection, recursively retrying after a failure, or allowing callbacks to re-enter the same operation. A correct base case is not sufficient when the input can contain a cycle or when valid input depth is unbounded.

I would also distinguish runaway recursion from valid but excessive recursion. If the call values clearly move toward a valid stopping point but the input is unusually deep, the algorithm may be logically correct yet unsuitable for the supported input range. In that case, I would consider replacing recursion with an explicit stack or queue, enforcing a documented maximum depth, or validating input before traversal.

If the full stack trace is missing, I would improve error capture and reproduce the problem in a safe environment. A thread dump can help when the affected thread is still active before the error or when repeated calls are occurring long enough to capture them, but after StackOverflowError is thrown the stack may already be unwinding or the thread may have terminated. Java Flight Recorder can provide surrounding execution, thread, allocation, and request context when an appropriate recording was active, but it is normally supporting evidence rather than a replacement for the error's stack trace.

A heap dump is not the primary diagnostic for call-stack exhaustion because the exhausted resource is not the Java heap. It can still help when the suspected trigger is a large or cyclic heap object graph that must be inspected separately. I would not claim that increasing the maximum heap size fixes StackOverflowError.

For temporary containment, I might reject a known malformed input, limit nesting depth, disable the failing endpoint or job, prevent automatic retries, or isolate the triggering operation. These actions reduce impact but do not repair the recursive logic. I would preserve the original cause in logs and avoid exposing sensitive inputs, credentials, or internal stack traces to clients.

Increasing -Xss, which controls the approximate stack size available to each Java thread, is not the normal fix for infinite or runaway recursion. It may be reasonable only when the recursion is intentional, terminating, measured, and bounded, but its legitimate maximum depth does not fit the current stack. A larger per-thread stack increases the process's memory or address-space requirement per thread and can reduce the number of threads the process can support. The exact effect is JVM, operating-system, and thread-creation dependent, so I would load-test rather than calculate capacity from -Xss alone.

The root-cause fix depends on the evidence. I would correct the base case or state transition, stop recursive retries, remove accidental callback re-entry, add cycle detection, enforce a justified depth limit, or replace deep recursion with iterative traversal. For graph traversal, I would choose visited tracking based on the domain: stable node identifiers when they define identity, or identity-based tracking when object identity matters and calling equals could itself recurse.

I would not catch StackOverflowError inside ordinary business logic and continue as though execution were reliable. At most, a carefully designed top-level boundary may record minimal diagnostic information and terminate or fail the affected operation, but recovery is risky because another stack overflow may occur while logging or cleanup runs and the interrupted operation may be incomplete.

Finally, I would verify the fix using the original failing input, normal input, empty input, minimum and maximum valid values, malformed input, self-cycles, multi-node cycles, and the deepest supported acyclic structure. I would repeat the test with production-equivalent Java, JVM options, application configuration, and concurrency. Regression prevention should include a test for the exact call cycle, documented depth expectations, input validation, cycle handling where required, and monitoring that preserves useful evidence without exposing sensitive production data.

Key Insight / Why This Solution Works
  1. Reproduce the failure with the smallest known input and the same Java version, JVM options, application version, and relevant environment settings.
  2. Define the scope by identifying which inputs, requests, jobs, threads, deployments, or environments fail and whether the failure is deterministic.
  3. Preserve the full StackOverflowError stack trace and related logs without exposing sensitive production data.
  4. Find the earliest repeating stack-frame pattern and classify it as direct recursion, mutual recursion, cyclic object traversal, recursive retry, callback re-entry, generated-method recursion, or framework re-entry.
  5. Inspect the values and state passed through the repeating calls. Confirm that a stopping condition exists, is reachable, and receives state that moves toward termination.
  6. Determine whether the recursion is non-terminating or finite but deeper than the supported stack can safely handle.
  7. Use thread dumps or Java Flight Recorder as supporting evidence when the original stack trace or reproduction context is incomplete. Use a heap dump only when the triggering object graph must be inspected.
  8. Apply containment separately, such as rejecting malformed input or disabling the failing path, and do not present containment as the root fix.
  9. Correct the termination logic, remove recursive re-entry, add appropriate cycle detection, validate depth, or replace recursion with an explicit stack or queue.
  10. Consider a measured -Xss adjustment only for proven, bounded, valid recursion after testing its process-wide memory and concurrency effect.
  11. Verify with the original input, normal and boundary inputs, malformed data, cycles, and the deepest supported valid structure under production-equivalent settings.
  12. Add regression tests, documented limits, safe diagnostics, and monitoring.
Why Interviewers Ask This

Interviewers use this question to evaluate whether the candidate understands that StackOverflowError normally means a thread exhausted its call stack, can recognize repeating stack-trace patterns, and can distinguish infinite recursion from finite recursion that is simply too deep. It also tests whether the candidate can identify direct recursion, mutual recursion, cyclic object traversal, and framework re-entry; separate temporary containment from the root-cause fix; and verify the correction without hiding the failure or relying blindly on a larger thread stack.

Common interview mistakes

Common mistakes include catching StackOverflowError and continuing normal business processing, increasing -Xss before proving that recursion is terminating and bounded, and increasing heap size even though the exhausted resource is the thread's call stack. Other mistakes are inspecting only the final stack frame instead of the repeating sequence, assuming recursion must involve one method calling itself directly, ignoring cycles through callbacks or object relationships, and overlooking generated equals, hashCode, or toString methods. Developers may also use a heap dump as the first diagnostic, add an arbitrary depth limit that rejects valid input, use equality-based visited tracking when identity-based tracking is required, expose production stack traces to clients, lose the original cause while wrapping or logging, test only small acyclic inputs, or fail to reproduce with the same Java and JVM settings.

Interview tip

Present a clear evidence chain: reproduce the failure, locate the repeating stack frames, classify the recursion, prove why it does not terminate or becomes too deep, separate containment from correction, and verify the root fix with cyclic and deep inputs. Mention -Xss only as a measured option for valid bounded recursion, not as the default solution.

Interviewer may ask next
Would you ever increase the JVM thread stack size to address a StackOverflowError?

Yes, but only after proving that the recursion is intentional, terminating, and bounded and that its legitimate maximum depth exceeds the current thread stack. I would measure representative and worst-supported depth, test the selected -Xss value under realistic thread counts, and verify behavior on the target JVM and operating system. A larger stack is not a fix for infinite recursion, and it increases the process's per-thread memory or address-space requirement, which may reduce safe concurrency.

How would you prevent StackOverflowError while traversing a cyclic object graph?

I would mark each node as visited before following its outgoing relationships and stop, skip, or report a relationship that reaches an already visited node according to the required behavior. I would use stable node identifiers when they represent domain identity, or identity-based tracking when distinct object instances matter and equals may recurse. For externally controlled or unbounded depth, I would also use an explicit stack or queue and enforce a justified depth or node limit.

103. How do you debug a concurrency bug like a deadlock?DebuggingHard

Question Details

Explain the process and tools you would use to diagnose a deadlock or other thread-safety issue.

Short Interview Answer (30-60 seconds)

I preserve evidence, reproduce or observe the failure, and collect multiple thread dumps plus Java Flight Recorder data. I prove the lock-ownership cycle, trace it to source code, fix the locking design, and verify the result with deterministic concurrency tests, stress runs, and production monitoring.

Detailed Explanation

This question asks how I would investigate a program that sometimes stops making progress because several pieces of work interfere with one another. I would not guess or immediately restart it. I would first learn when the failure happens, what remains usable, and whether it affects one machine or many. Then I would preserve reliable evidence while the problem is active, trace the waiting work to the responsible parts of the program, make the smallest safe correction, and prove through repeated testing that the same failure no longer occurs under realistic and heavy use.

Useful clarifying questions:

Useful Questions to Ask the Interviewer
  • Is the issue reproducible, intermittent, or currently happening in production?
  • Does the whole process stop, or are only certain requests or jobs blocked?
  • Can I collect thread dumps, logs, metrics, and a Java Flight Recorder recording?
  • Are intrinsic monitors, java.util.concurrent locks, database locks, executor tasks, or external calls involved?
  • Did the issue begin after a code, dependency, JDK, JVM option, operating-system, or configuration change?
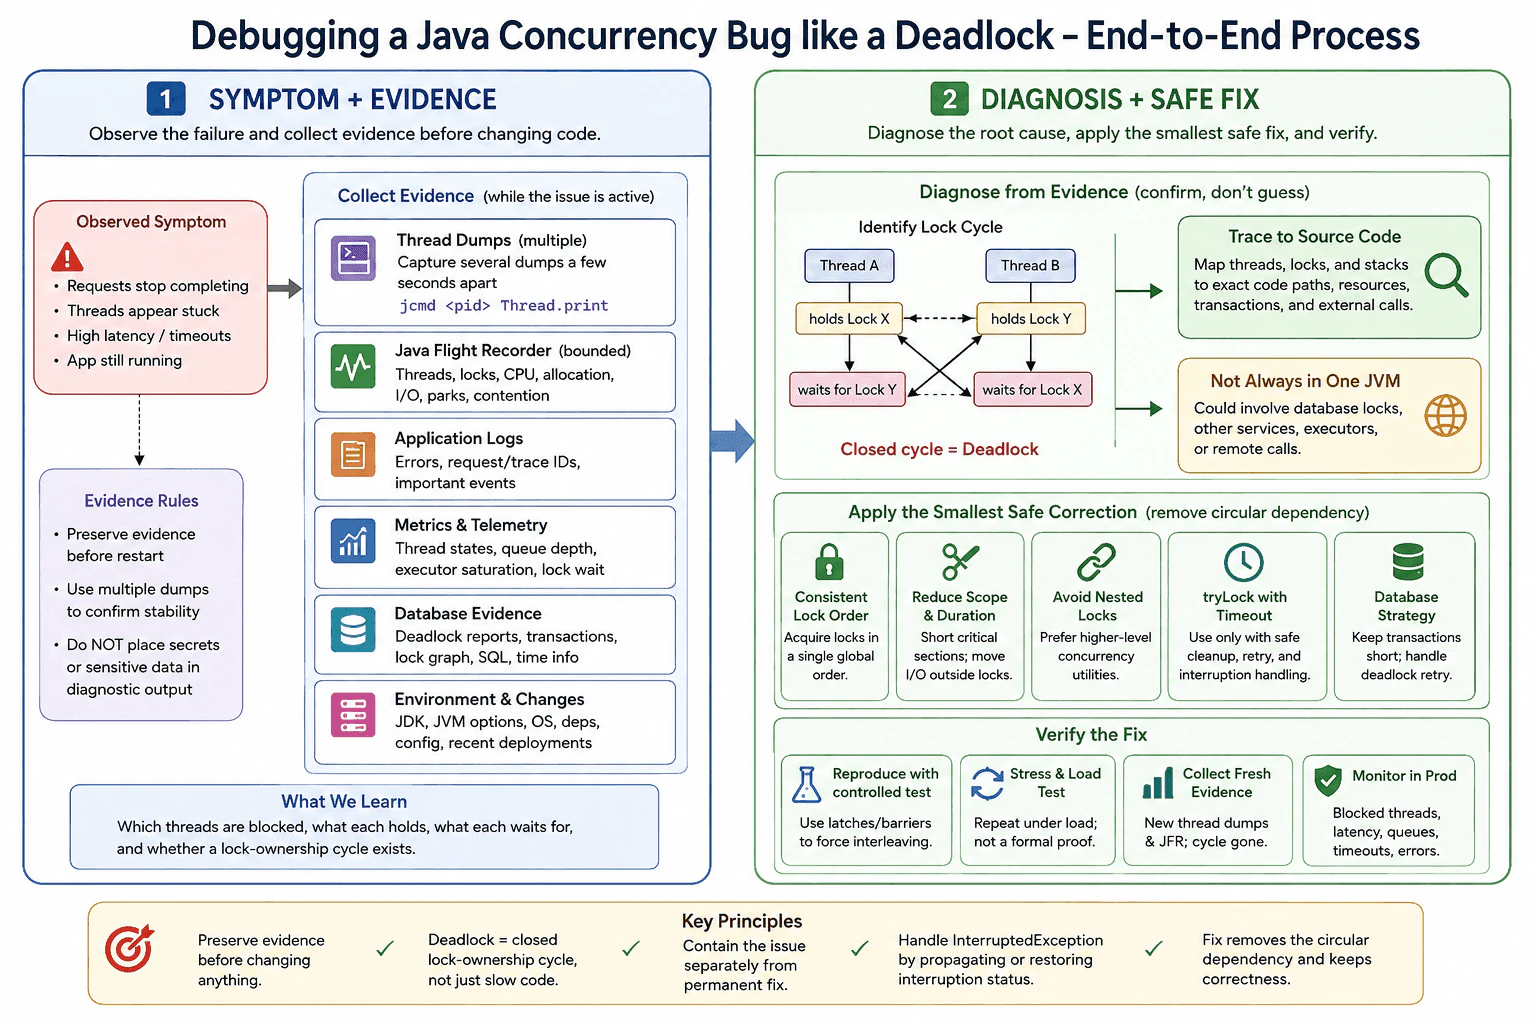
How do you debug a concurrency bug like a deadlock? diagram
How to Explain It in an Interview

I would begin with reproduction, scope, evidence, and the smallest useful diagnostic step.

First, I would classify the failure correctly. A deadlock is a runtime concurrency failure, not a compile error, linkage error, checked exception, unchecked exception, or JVM Error. A true deadlock means two or more threads are permanently waiting in a cycle, with each thread holding a resource another thread needs. I would distinguish it from contention, where progress eventually continues; starvation, where a thread rarely obtains a required resource; livelock, where threads remain active but make no progress; executor starvation, where tasks wait for work queued to the same exhausted pool; or blocking caused by a database, file, network, operating system, application server, or external service.

If the issue is reproducible outside production, I would reduce it to the smallest reliable case. I would use controlled coordination such as CountDownLatch, CyclicBarrier, Phaser, or test hooks to force the dangerous ordering instead of relying only on Thread.sleep. I would repeat the test under realistic load and record the JDK version, JVM options, operating system, dependency versions, framework or application-server version, class path or module path, configuration, and recent changes. Concurrency behavior is timing-sensitive, so environment differences can change how often the failure appears without changing its underlying cause.

If the failure is active in production, I would preserve evidence before restarting whenever that is safe. I would capture several thread dumps a few seconds apart with a supported tool such as jcmd <pid> Thread.print. jstack can also capture stacks when available, but jcmd is generally the preferred JDK diagnostic interface. Multiple dumps help show whether the same threads and ownership relationships remain unchanged. I would correlate them with application logs, request or trace identifiers, executor metrics, queue depth, lock-wait metrics, database activity, host metrics, and deployment information. I would avoid placing credentials, personal data, tokens, or sensitive business data in diagnostic output.

I would also collect a bounded Java Flight Recorder recording when operational policy allows it. Java Flight Recorder is a JVM event recorder designed for relatively low-overhead diagnostics. It can show thread states, monitor contention, park events, CPU activity, allocation activity, socket or file delays, and event timing. Its overhead depends on the enabled events, thresholds, stack traces, recording duration, and workload, so I would use an appropriate production profile and bounded disk settings rather than claiming that it has zero cost.

In the thread dumps, I would inspect thread states and stack traces. BLOCKED means a thread is waiting to enter a synchronized monitor. WAITING and TIMED_WAITING are not automatically errors; they can be normal for Object.wait, LockSupport.park, Future.get, CountDownLatch.await, Thread.join, scheduled executors, or blocking queues. I would identify what each affected thread holds, what it is waiting to acquire, and whether those relationships form a closed cycle.

The JVM may print a deadlock section in a thread dump. Programmatically, ThreadMXBean.findDeadlockedThreads can detect cycles involving intrinsic monitors and ownable synchronizers such as ReentrantLock, while findMonitorDeadlockedThreads is limited to monitor deadlocks. Detection is evidence, not the repair. I would map each reported thread, lock identity, and stack frame to the exact source path that acquired and requested the locks.

I would not assume every frozen Java service contains a JVM-visible lock cycle. ReentrantLock, stamped locks, semaphores, futures, thread-pool dependencies, database transactions, distributed locks, and remote calls can produce broader dependency cycles. For a database deadlock, I would inspect database deadlock reports, lock graphs, transaction identifiers, query text, transaction boundaries, isolation behavior, and retry evidence. A Java thread may hold an application lock while waiting for a database or network response, so the complete cycle may span several systems and may not appear fully in one JVM dump.

Logs and ordinary stack traces provide useful timing and failure context, but they normally do not prove a live lock-ownership cycle by themselves. A heap dump can help inspect retained lock-owning objects or related state after the fact, but it is not the first diagnostic for a live deadlock. Heap dumps can be large, may expose sensitive data, and can pause or heavily disturb a process depending on the JVM and collection method. I would capture one only when its expected value justifies the operational and privacy cost.

For containment, I might stop admitting new work, disable the affected operation, isolate a bad instance, remove it from service, or restart it after preserving evidence. A bounded timeout may limit damage only when cancellation and cleanup are safe. These are workarounds that restore service; they do not remove the root cause. Increasing the thread-pool size may temporarily hide executor starvation but can increase memory use, scheduling overhead, downstream load, and lock contention.

I would handle interruption correctly. When code catches InterruptedException, it should normally propagate it or restore the interruption status with Thread.currentThread().interrupt() before returning or translating the failure. If an exception is wrapped, I would preserve the original cause. I would not swallow exceptions, clear interruption silently, or log and continue with partially completed shared-state changes.

The permanent fix depends on the evidence. Common fixes include enforcing one global lock-acquisition order, avoiding nested locks, reducing the duration and scope of critical sections, moving blocking input or output outside a lock, avoiding callbacks into unknown code while holding a lock, replacing several interacting locks with a simpler ownership model, or using higher-level concurrent collections and coordination utilities. ConcurrentHashMap can make individual map operations thread-safe, but it does not automatically make a multi-step operation across several keys or resources atomic.

For example, when an operation must lock two accounts, every code path can acquire the account locks in the same stable order. The ordering key must be unique, immutable for the locking decision, and consistently applied. If two resources can have equal ordering values, the design needs a deterministic tie-breaker or a separate tie lock. Without that detail, an apparent ordering rule may still be ambiguous.

tryLock with a timeout can prevent indefinite waiting, but it is not automatically a root-cause fix. The code must release every lock already acquired, preserve invariants, handle interruption, apply bounded retry or failure behavior, and avoid livelock. Fair locks can reduce starvation in some workloads, but fairness usually lowers throughput and does not correct inconsistent lock ordering.

I would verify the correction with the original reproduction and a focused regression test that deliberately forces the previously dangerous interleaving. I would add repeated stress tests and production-like load tests, while recognizing that a passing stress test cannot mathematically prove the absence of every concurrency bug. I would capture fresh thread dumps or Java Flight Recorder data to confirm that the cycle is gone and that contention, queueing, CPU use, and latency have not merely moved elsewhere.

Finally, I would document the lock-order or ownership rule, add code-review checks, keep diagnostic procedures ready, and monitor blocked-thread counts, executor saturation, queue growth, timeout rates, and long lock waits. The successful correction removes the circular dependency, preserves data correctness and cancellation behavior, avoids unnecessary serialization, and remains understandable to future maintainers.

Technical Approach
  1. Define the symptom, affected operations, scope, timing, and business impact.
  2. Record the JDK, JVM options, operating system, dependencies, framework or server, configuration, load, and recent changes.
  3. Reproduce the issue safely or observe it while active without first destroying evidence.
  4. Capture several thread dumps, bounded Java Flight Recorder data, relevant logs, metrics, request context, database evidence, and deployment information.
  5. Classify the issue as deadlock, contention, starvation, livelock, executor starvation, blocking input or output, database locking, or an external dependency.
  6. Identify each affected thread, the resource it holds, the resource it requests, and whether the relationships form a closed cycle.
  7. Map thread names, lock identities, stack frames, transactions, and external waits to exact source paths.
  8. Apply temporary containment separately from the permanent correction.
  9. Remove the circular dependency through consistent ordering, reduced lock scope, fewer nested locks, non-blocking critical sections, or a simpler concurrency design.
  10. Preserve exception causes, interruption status, data invariants, and cleanup behavior.
  11. Verify with a controlled interleaving test, repeated stress runs, production-like load, and fresh runtime evidence.
  12. Add regression tests, monitoring, lock-design documentation, and an incident procedure.
Practical Insights

A thread dump takes time roughly proportional to the number of threads and the amount of stack information collected. Its text size also grows with thread count and stack depth. Taking several dumps adds small but nonzero CPU, pause, storage, and analysis cost. Java Flight Recorder uses bounded memory and disk buffers when configured that way, but enabling more events, lower thresholds, or more stack traces increases overhead and recording size. Stress tests can consume substantial CPU and time because timing-sensitive failures may require many repetitions. One coarse lock is easier to understand and uses fewer lock objects, but it can reduce parallel work. Fine-grained locking can improve throughput but increases memory use, reasoning difficulty, deadlock risk, test cost, and maintenance cost. Larger thread pools consume more stack memory and scheduling resources and may overload downstream systems. Timeouts prevent unlimited waiting but add cancellation, rollback, retry, and error-handling complexity.

Why Interviewers Ask This

Interviewers want to know whether the candidate can diagnose timing-dependent Java failures methodically instead of guessing. The question evaluates knowledge of thread states, lock ownership, intrinsic monitors, explicit locks, thread dumps, Java Flight Recorder, database evidence, interruption handling, safe production diagnostics, containment, root-cause correction, and verification. It also tests whether the candidate can distinguish a true deadlock from contention, starvation, livelock, executor starvation, blocking input or output, database locking, and slow external services.

Common interview mistakes

Common mistakes include restarting before collecting evidence, treating every WAITING thread as a deadlock, relying on one thread dump, using Thread.sleep as the only reproduction technique, changing synchronization without proving the ownership cycle, and assuming the issue must be entirely inside one JVM. Other mistakes are increasing the thread-pool size without checking executor dependencies, acquiring locks in inconsistent orders, performing database or network calls while holding a lock, adding tryLock timeouts without safe cleanup, swallowing InterruptedException, losing the original exception cause, capturing sensitive production data unnecessarily, and treating containment as the root-cause fix. It is also incorrect to claim that volatile makes compound actions atomic, that concurrent collections make multi-resource operations atomic, or that a passing stress test proves no concurrency bug exists.

Interview tip

Present the investigation as an evidence-driven sequence: define the symptom, preserve evidence, capture multiple thread dumps and bounded runtime recordings, prove the dependency cycle, trace it to source code, separate containment from correction, remove the circular dependency, and verify with controlled interleavings plus stress tests. State clearly that not every blocked system is a JVM deadlock.

Interviewer may ask next
How can you distinguish a deadlock from normal lock contention in thread dumps?

A deadlock has a closed ownership cycle: each thread holds a resource and waits for another resource held by a different thread in the same cycle. The JVM may report that cycle directly. With normal contention, threads wait for a busy lock, but an owner continues running and eventually releases it. I would compare several dumps over time. An unchanged ownership cycle strongly supports deadlock, while changing owners, changing stacks, and continued completed work suggest contention. I would correlate this with Java Flight Recorder events, throughput, queue depth, and lock-wait duration.

When would you use tryLock with a timeout instead of a fixed lock order?

I prefer a fixed lock order when every acquisition path is controlled because it removes circular wait by design. I would consider tryLock with a timeout when a strict order cannot be enforced, when work can safely be abandoned or retried, or when independently managed components cannot share one ordering rule. The failure path must release already-held locks, preserve shared-state invariants, handle interruption correctly, use bounded retry with backoff when appropriate, and avoid livelock. A timeout limits waiting but does not prove that the locking design is correct.

104. How do you debug an OutOfMemoryError?DebuggingHard

Question Details

Describe how you would investigate heap usage, retained objects, and memory pressure.

Short Interview Answer (30-60 seconds)

I preserve evidence, read the complete OutOfMemoryError message, and classify the exhausted resource. I correlate memory growth with workload, use garbage-collection logs and Java Flight Recorder, inspect heap dumps and retained-object paths when appropriate, investigate native memory and thread limits when needed, then verify that the corrected process reaches a stable memory range.

Detailed Explanation

This question asks how I would discover why a Java program no longer has enough memory to continue its work. I would first find out when the problem started, what work was running, whether one machine or many were affected, and what recently changed. Before restarting anything, I would save the available evidence. I would then determine what kind of stored information or system resource kept growing, what part of the program still held it, and whether the demand was expected. Finally, I would reduce the immediate impact, correct the real cause, and prove that the problem does not return.

Useful clarifying questions:

Useful Questions to Ask the Interviewer
  • What is the complete OutOfMemoryError message and stack trace?
  • Is the process still running, repeatedly failing, or already terminated?
  • Did memory rise gradually, spike with a particular workload, or fail immediately after deployment?
  • Does the failure occur in every environment or only on one host or container?
  • Are garbage-collection logs, Java Flight Recorder recordings, heap dumps, or memory metrics available?
  • What changed recently in code, dependencies, JVM options, traffic, payload sizes, concurrency, or deployment limits?
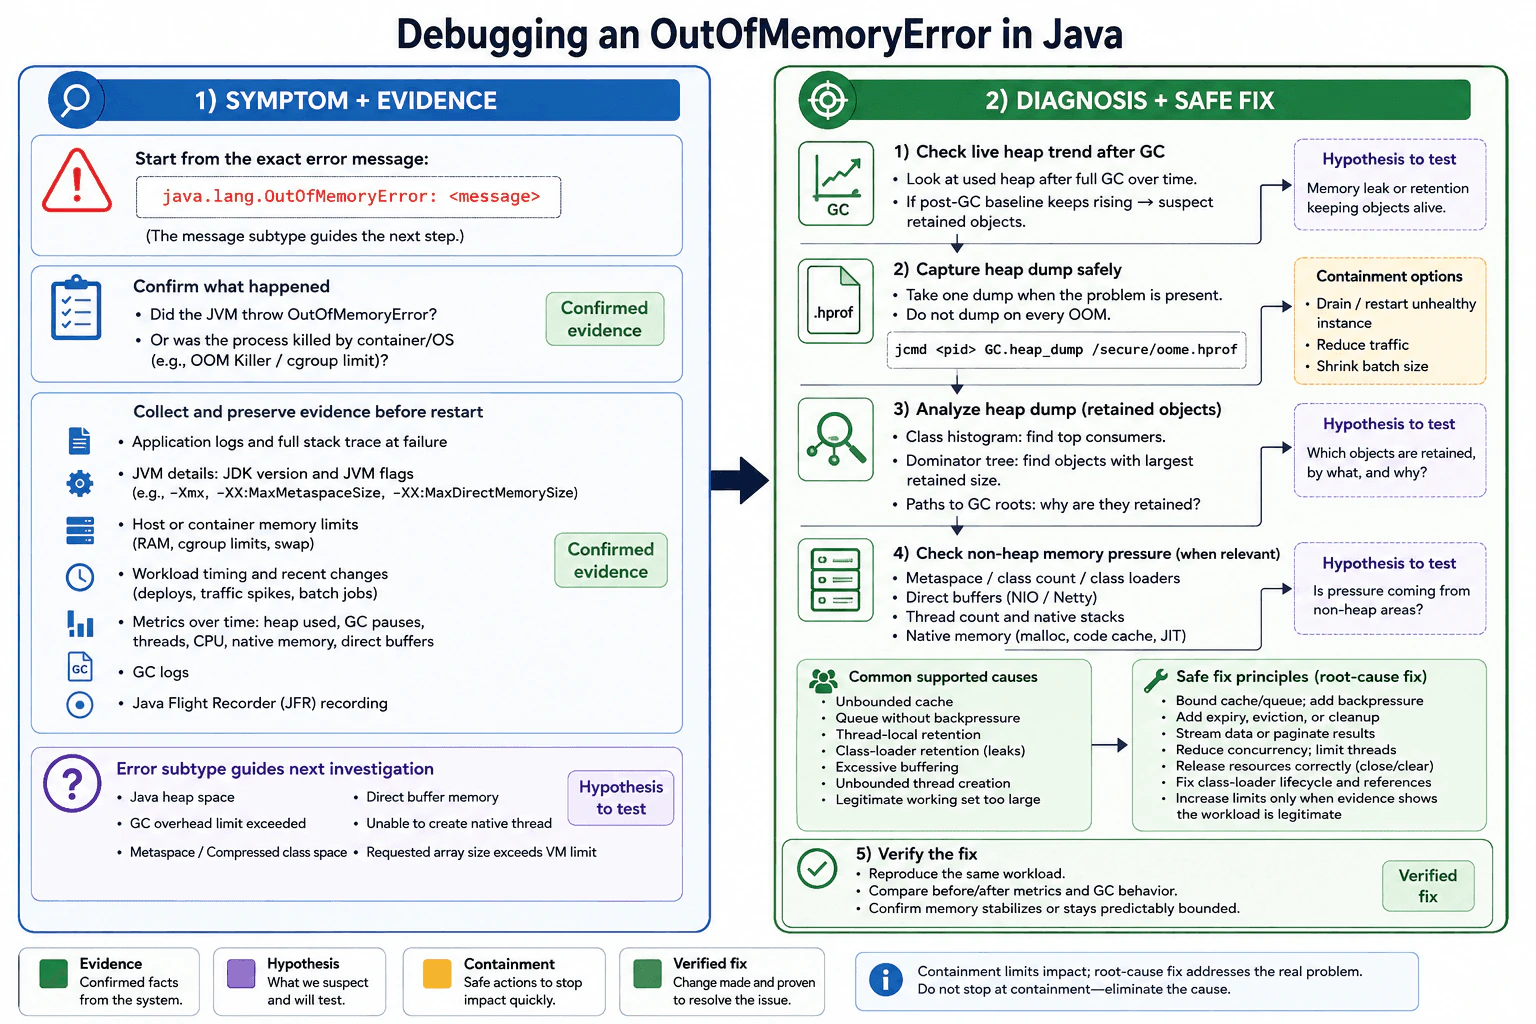
How do you debug an OutOfMemoryError? diagram
How to Explain It in an Interview

I begin with the complete error message because OutOfMemoryError is an Error that can report different exhausted resources. Java heap space usually means the JVM cannot allocate another object in the managed heap. GC overhead limit exceeded means garbage collection is consuming excessive time while reclaiming very little heap. Metaspace or Compressed class space points to class metadata or class-loader pressure. Direct buffer memory concerns off-heap buffers. Unable to create native thread usually points to native memory, address-space, thread-count, or operating-system limits. Requested array size exceeds VM limit can mean one requested array is too large even when the heap is not generally full.

My first step is to preserve evidence. I record the exact error, complete cause chain and stack trace, timestamps, process ID, JDK version, JVM arguments, heap settings, container or host limits, workload state, recent deployments, and surrounding logs and metrics. I do not assume that the allocation site in the final stack trace is the leak source. It may only be the location where the allocation that finally failed was attempted.

I also separate an application OutOfMemoryError from an external termination. For example, a container or operating system may kill a process after it exceeds a memory limit without allowing the JVM to throw or log an OutOfMemoryError. In that case, I inspect container status, exit reason, kernel or platform events, resident memory, and configured limits rather than relying only on Java logs.

For a suspected heap problem, I examine the live set: the amount of heap still occupied after effective garbage collection. Under a stable workload, a post-collection baseline that continues to rise suggests that live objects are accumulating. If memory rises during a bounded operation and returns to its earlier range afterward, the application may instead have a legitimate peak working set, an allocation-rate problem, or insufficient headroom. I correlate these patterns with traffic, queue depth, cache entries, payload size, batch size, concurrent requests, and recent changes.

I inspect unified garbage-collection logging. A suitable starting configuration for Java 21 or Java 25 is -Xlog:gc*,safepoint:file=gc.log:time,uptime,level,tags:filecount=10,filesize=20M, adjusted for the environment. These logs help show collection frequency, pause behavior, heap occupancy, promotion, allocation pressure, and reclaimed space. Repeated expensive collections that reclaim little memory support a live-object retention problem. High allocation followed by effective reclamation points more toward temporary allocation pressure, excessive concurrency, or a heap that is too small for the legitimate workload.

I use Java Flight Recorder when possible. JFR can capture garbage collections, allocation samples, object statistics when configured, thread activity, class loading, and other JVM events with controllable overhead. A recording that covers the period before and during memory growth can connect the pressure to workload and code paths. I distinguish allocation evidence from retention evidence: allocation evidence shows where objects are created, while retention evidence explains why objects remain reachable. A heavily allocating method is not necessarily the source of a memory leak.

For retained-object investigation, I capture a heap dump close to the problematic state when doing so is operationally safe. Useful startup options include -XX:+HeapDumpOnOutOfMemoryError and a protected -XX:HeapDumpPath. For an on-demand dump, I first inspect the commands supported by that JVM with jcmd <pid> help, then use the supported heap-dump command, such as jcmd <pid> GC.heap_dump <file>. Before taking a production dump, I check free disk space, expected pause or CPU impact, process health, access controls, and secure transfer and deletion procedures. A dump can be many gigabytes and can contain credentials, personal information, request data, or other sensitive values.

In a heap-analysis tool, I inspect class histograms, the dominator tree, retained size, large collections, duplicate data, and paths to garbage-collection roots. Shallow size is the memory occupied directly by an object. Retained size estimates the memory that could become collectible if that object and the objects retained only through it were no longer reachable. A dominator is an object that lies on every reference path from the analysis root to another object. Paths to garbage-collection roots reveal why an object is still reachable, such as through a static field, active thread, thread-local value, class loader, cache, queue, listener registry, JNI reference, or other long-lived owner.

I do not automatically call the largest object or class a leak. A large object may be a valid part of the working set. I look for unexpected growth across comparable workload phases, suspicious ownership, objects that outlive their intended scope, collections without limits, and reference paths that explain the lifetime. Comparing multiple observations or dumps taken at meaningful points is often more reliable than judging a single snapshot.

Common heap causes include unbounded caches, maps whose entries are never removed, queues without backpressure, sessions without expiry, listeners that are never deregistered, accidental static retention, thread-local values left on pooled platform threads, completed results retained indefinitely, duplicate deserialized data, excessive buffering, loading an entire file or result set, and excessive numbers of simultaneously active operations. The correction should address ownership and lifetime by adding bounds, eviction, expiry, streaming, pagination, backpressure, cleanup, cancellation, or lower concurrency as appropriate.

For Metaspace or Compressed class space, I inspect class-loading trends, class-loader counts, generated classes, and class-loader reachability. Continuous growth can come from repeated dynamic class generation, proxy or bytecode generation, instrumentation, scripting, repeated application redeployment, or class loaders retained by live threads, static fields, framework registries, drivers, or shutdown hooks. Increasing the relevant limit may provide temporary headroom, but it does not correct continuous class-loader or class-generation growth.

For Direct buffer memory, I inspect NIO buffer-pool metrics, networking-library allocators, direct-buffer pooling, memory-mapped files, buffer sizes, concurrency, and native-memory evidence. Direct buffers use memory outside the Java heap, although Java objects still represent and reference them. The cause may be an unbounded pool, too many concurrent buffers, delayed reclamation, unreleased framework resources, or a direct-memory limit that is too small for a legitimate workload. The fix may involve bounding pools, correcting reference-counted resource release, streaming data, reducing concurrency or buffer sizes, or setting an evidence-based direct-memory limit.

For Unable to create native thread, I inspect thread dumps, platform-thread counts, thread-pool configuration, thread-stack size, native-memory availability, process and user limits, and container PID limits. I look for thread-per-request designs, blocked platform threads that accumulate indefinitely, repeated executor creation, oversized pools, or ignored task rejection. Increasing -Xmx can make this condition worse by leaving less process memory for thread stacks and other native allocations. Virtual threads can reduce the need for large numbers of platform threads for suitable blocking workloads, but they do not remove memory limits, pinning concerns, queue growth, or the need to bound overall work.

When native memory is suspected, I combine operating-system or container metrics with Native Memory Tracking if it was enabled at JVM startup using -XX:NativeMemoryTracking=summary or detail. I can establish a baseline and inspect later differences using jcmd <pid> VM.native_memory baseline and jcmd <pid> VM.native_memory summary.diff, subject to the commands supported by that JVM. NMT reports JVM-tracked native-memory categories such as heap reservation, class metadata, code cache, threads, and internal structures. It does not account for every allocation made by application JNI code or third-party native libraries, so unexplained resident-memory growth may require operating-system profilers or native allocation tools.

Containment is separate from the root-cause fix. Containment may include draining or restarting an unhealthy instance, reducing traffic, lowering concurrency, shrinking batches, disabling the affected feature, bounding a cache or queue, rejecting excess work, or adding temporary capacity. A carefully justified memory-limit increase may be appropriate when the live working set is legitimate and sufficient host or container memory remains for native needs. I do not repeatedly call System.gc(), blindly increase -Xmx, swallow the error, or assume that the process can safely continue. After severe memory exhaustion, logging, cleanup, request handling, and recovery code may also fail because they require additional memory.

I verify the correction by reproducing the original workload in a controlled environment and running it long enough to reveal slow growth. I compare the live heap after collection, retained-object counts, allocation rate, collection frequency and pause time, metaspace, direct-buffer use, native committed memory, resident memory, platform-thread count, queue depth, throughput, and error rate before and after the change. Success means memory reaches a repeatable stable range or follows a justified bounded pattern, not merely that failure takes longer.

For regression prevention, I add focused tests for cache bounds, expiry, queue backpressure, resource release, class-loader cleanup, and large-input behavior where applicable. In production, I monitor heap occupancy after collection, garbage-collection time, allocation pressure, metaspace, class count, direct-buffer pools, native memory, resident memory, platform-thread count, queue depth, container memory, process limits, and dump-storage capacity. Alert thresholds should use the application's normal workload and recovery behavior rather than one universal percentage.

Technical Approach
  1. Capture the exact OutOfMemoryError message, complete stack trace, timestamp, JDK version, JVM arguments, deployment limits, workload state, and recent changes.
  2. Determine whether the JVM threw an OutOfMemoryError or the operating system or container terminated the process externally.
  3. Preserve available logs, metrics, recordings, dumps, and platform events before restarting when operationally safe.
  4. Classify the exhausted resource: Java heap, garbage-collection overhead, metaspace, compressed class space, direct-buffer memory, native-thread creation, oversized array request, or other native memory.
  5. Correlate memory behavior with traffic, payload size, batch size, queue depth, cache entries, concurrency, class count, thread count, and deployment events.
  6. Inspect garbage-collection logs and Java Flight Recorder data to distinguish allocation pressure, poor reclamation, growing live data, class loading, and concurrency pressure.
  7. For suspected heap retention, safely collect a heap dump and inspect histograms, dominators, retained sizes, and paths to garbage-collection roots.
  8. For non-heap pressure, inspect class loaders, direct-buffer pools, thread dumps, operating-system and container limits, resident memory, and Native Memory Tracking when available.
  9. Form and test a specific hypothesis, such as an unbounded cache, queue growth, incorrect resource ownership, thread-local retention, class-loader retention, excessive buffering, oversized working set, or unbounded thread creation.
  10. Apply a root-cause correction to ownership, lifetime, bounds, cleanup, streaming, backpressure, concurrency, or justified capacity. Keep containment measures separate.
  11. Reproduce the original workload, compare before-and-after evidence, confirm stable or predictably bounded memory, and add regression tests, monitoring, and safe diagnostic settings.
Practical Insights

This investigation does not have one meaningful Big O result because it is an operational debugging process. The costs depend on the selected evidence. Metrics and normal garbage-collection logs are usually relatively inexpensive, but detailed logging increases storage and analysis work. Java Flight Recorder overhead depends on its event and sampling configuration. A class histogram is smaller and faster than a heap dump but cannot fully explain ownership. A full heap dump can be very large, can temporarily pause or stress the JVM, requires protected storage, and may require a powerful analysis machine. Native Memory Tracking has additional runtime and memory cost, especially in detail mode, and must be enabled before the incident. Long-duration load tests consume infrastructure time but are necessary for slow leaks. Bounds, expiry rules, alerts, and regression tests add maintenance work while reducing repeated production incidents.

Why Interviewers Ask This

This question tests whether the candidate can investigate memory exhaustion systematically instead of assuming that every OutOfMemoryError requires a larger heap. A strong answer distinguishes different memory areas, preserves production evidence safely, separates object allocation from object retention, identifies the references keeping data alive, considers JVM and operating-system limits, separates containment from the permanent correction, and proves the fix with repeatable measurements.

Common interview mistakes

Common mistakes include treating every OutOfMemoryError as Java heap space; increasing -Xmx before identifying the exhausted resource; confusing an external container memory kill with a JVM-thrown error; assuming the last allocation stack frame is the leak source; treating high allocation as proof of retention; examining only shallow size instead of retained size and root paths; calling the largest object a leak without understanding ownership; taking an unsafe production dump without checking storage, pause risk, access controls, and sensitive data; relying on one snapshot without workload context; ignoring metaspace, compressed class space, direct buffers, native libraries, thread stacks, platform-thread count, and process limits; assuming Native Memory Tracking includes every third-party native allocation; forcing System.gc() as a permanent fix; catching or swallowing OutOfMemoryError and continuing normally; restarting before preserving evidence; and declaring success merely because the failure occurs later.

Interview tip

Start with the complete error message and evidence preservation. Classify the exhausted memory area, then explain how you distinguish allocation pressure from retained objects and heap pressure from native pressure. Mention garbage-collection logs, Java Flight Recorder, retained-size and root-path analysis, safe containment, a specific root-cause correction, and verification that memory becomes stable or predictably bounded under the original workload.

Interviewer may ask next
How do you determine whether high heap usage is a memory leak or a legitimate workload that needs more heap?

I compare the live heap after effective garbage collection under a stable, repeatable workload. A leak is likely when the post-collection baseline or retained population continues to rise after objects should have expired. If memory rises during bounded work and returns to a consistent range afterward, the application may have a legitimate peak working set or high temporary allocation rate. I also check cache and queue bounds, payload size, concurrency, collection effectiveness, throughput, and latency. I increase the heap only when the retained data is expected, the process has enough remaining native and operating-system memory, and testing shows acceptable collection behavior.

What would you do if taking a full heap dump in production is too risky?

I would begin with lower-risk evidence such as garbage-collection logs, Java Flight Recorder, JVM and container metrics, class histograms, thread dumps, class-loading counts, direct-buffer metrics, and Native Memory Tracking summaries when already enabled. I would reproduce the same workload on a protected canary or test environment and take the dump there. If production retention evidence is still necessary, I would drain a selected instance and capture the dump only after checking storage capacity, process impact, access controls, encryption, transfer, retention, and deletion procedures. I would clearly state that sampling and histograms narrow the hypothesis but do not always replace a full reference-path analysis.

105. How do you bisect a regression to find the commit that introduced it?DebuggingHard

Question Details

Explain how you would use version control history and binary search to locate a breaking change.

Short Interview Answer (30-60 seconds)

I reproduce the failure, define a deterministic test, and confirm one good and one bad commit. I run git bisect, classify each midpoint as good, bad, or skipped, and continue until Git finds the first bad commit. Then I verify causality, fix the root cause, and add a regression test.

Detailed Explanation

This question asks how I would find the exact saved change that caused something which previously worked to stop working. Instead of checking every change one by one, I test a point near the middle of the possible range. The result tells me which half still contains the problem, so the remaining search becomes much smaller each time. I first need proof that the problem can be repeated, one earlier point that works, and one later point that fails. After locating the likely change, I must confirm that it truly caused the problem before fixing it.

Useful clarifying questions:

Useful Questions to Ask the Interviewer
  • Is the regression deterministic, or does it fail only sometimes?
  • Do we have a confirmed good commit and a confirmed bad commit?
  • What exact command or observation determines good versus bad?
  • Must historical commits use different JDK, build-tool, dependency, or environment versions?
  • Does the relevant history include merge commits, generated artifacts, database state, or external services?
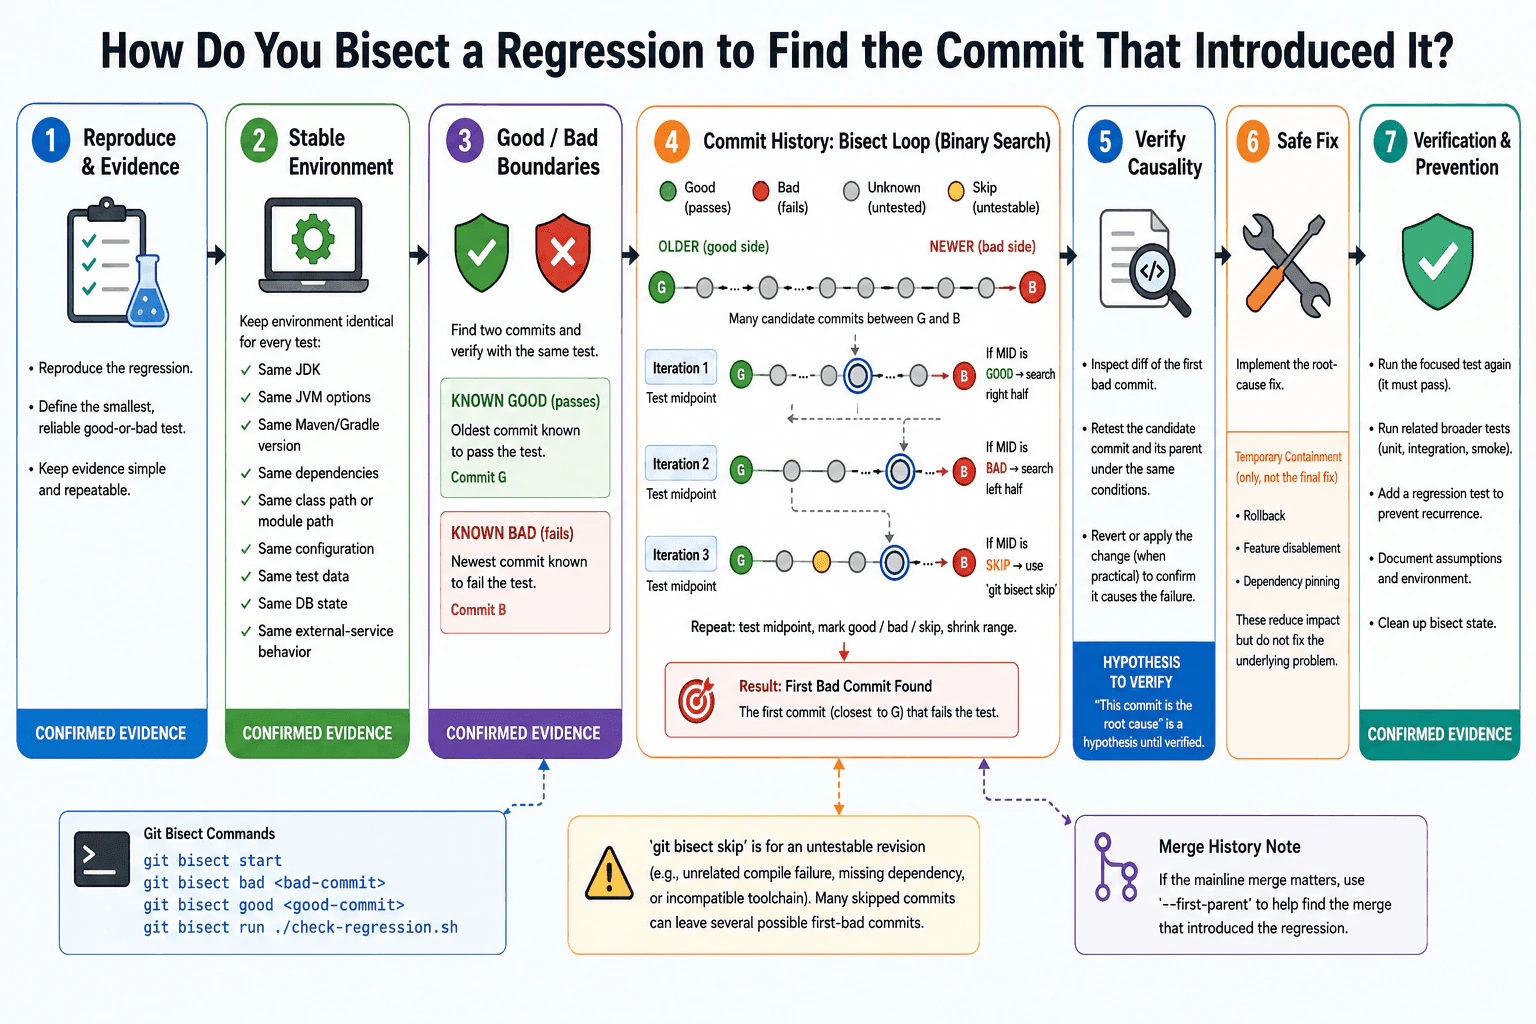
How do you bisect a regression to find the commit that introduced it? diagram
How to Explain It in an Interview

I begin by reproducing the regression under controlled conditions. I record its scope, expected behavior, actual behavior, and the smallest useful evidence. Depending on the failure, that evidence might be compiler output, a linkage error, a checked or unchecked exception, an Error, the preserved cause, a stack trace, logs, a thread dump, a heap dump, Java Flight Recorder data, database evidence, or a confirmed environment difference.

I then define a reliable classification test. It must answer one narrow question: does this revision have the target regression? The result should not depend on an unrelated warning or failure. For example, if I am investigating a runtime exception, an old revision that fails to compile for an unrelated reason is untestable, not automatically bad.

Next, I identify two boundaries:

  • A known good commit where the target behavior works.
  • A known bad commit where the same target behavior fails.

I verify both boundaries with the same test. I also keep relevant conditions stable, including the operating system, JDK version, JVM options, Maven or Gradle version, dependency resolution, class path or module path, application configuration, test data, database state, and external-service behavior. Otherwise, I could accidentally classify an environment or dependency difference as a source-code regression.

I start the binary search with:

git bisect start

git bisect bad <bad-commit>

git bisect good <good-commit>

Git selects a revision near the middle of the remaining history range and checks it out. I build the necessary code and run the focused test. If the target behavior works, I run git bisect good. If the target regression is present, I run git bisect bad. Git eliminates the half that cannot contain the transition and selects another revision. I repeat until Git reports the first bad commit.

This search relies on a monotonic classification over the selected history: revisions before the transition are treated as good and revisions after it as bad. If the defect disappears and later returns, if several independent commits cause the same symptom, or if the test is flaky, one ordinary bisect may produce a misleading result. I would then narrow the time range, improve the test, or run separate investigations for each transition.

When a selected historical revision cannot be classified because it has an unrelated compile failure, unavailable dependency, incompatible toolchain, or another blocking problem, I use git bisect skip. I use skipping carefully because if skipped commits are next to the transition, Git may return several possible first-bad commits instead of one exact answer. When practical, I can temporarily repair the historical build without changing the behavior being tested, or test a nearby revision instead.

For a deterministic test, I can automate the process with git bisect run <test-command>. The command must return exit status 0 for good, 125 for skip, and a status from 1 through 127 other than 125 for bad. A status of 128 or higher stops the automated bisect. Because shell status 126 commonly means that a command could not be executed and 127 commonly means that it was not found, my wrapper script should detect infrastructure errors and return 125 or stop intentionally rather than letting them be mistaken for the regression.

A Java automation script should clean stale outputs, prepare controlled inputs, compile only the necessary modules, and run one focused Maven or Gradle test. Before trusting it, I run the script on the known good and known bad boundaries and confirm that it returns the expected statuses. I also prevent mutable caches, shared files, database data, ports, timing, network responses, or background processes from changing the classification.

Merge history needs special care. By default, Git searches the commit graph and may identify a commit from a merged branch even if that intermediate branch commit was never deployed independently. If the production history is represented by the main branch and I specifically want the merge that introduced the regression there, git bisect start --first-parent can follow only first-parent history. The tradeoff is that it may identify the merge commit rather than the exact commit inside the merged branch, so I may perform a second bisect inside that branch when necessary.

After Git reports the first bad commit, I treat it as strong evidence, not automatic proof of root cause. I inspect the diff, commit context, dependency changes, build configuration, module declarations, JVM options, schema assumptions, and external contracts. The commit may have directly created the defect, exposed a pre-existing defect, or changed conditions that made an older defect observable.

I verify causality by testing the reported commit and its relevant parent again under identical conditions. When safe and practical, I revert or temporarily remove the suspected change and confirm that the regression disappears. I can also apply the suspected change to the parent and confirm that the regression appears. For a merge commit, I examine the appropriate parents and test the integrated result rather than assuming the first parent alone explains the failure.

For an intermittent regression, I do not classify a commit from one run. I control random seeds, load, timing, data, and environment where possible. I run enough trials to use a documented rule, such as a meaningful difference in failure rate, and repeat the final comparison between the candidate and its parent. This makes the search slower and means the result is statistical rather than perfectly certain.

A rollback, feature disablement, traffic reduction, or dependency pin may contain production impact, but it is not automatically the root-cause fix. The permanent correction should address the actual defect. Java exception handling must preserve the original cause where relevant, and code responding to InterruptedException must normally restore interruption with Thread.currentThread().interrupt() or propagate the exception rather than swallowing it.

After implementing the fix, I run the focused failing test, related unit tests, integration tests, and any appropriate system or performance checks. I add a regression test that fails before the fix and passes after it. I document required environment assumptions and monitoring signals. Finally, I run git bisect reset to end the session and restore the revision that was checked out before the bisect started.

The main tradeoff is reliability versus speed. A small deterministic test makes each step fast and isolates the relevant behavior. A broad test suite may catch more interactions, but it takes longer and can introduce unrelated failures. I use the smallest test that faithfully detects the real regression, then use broader tests to verify the final fix.

Technical Approach
  1. Reproduce the exact regression and collect evidence that distinguishes expected behavior from the target failure.
  2. Define the smallest reliable good-or-bad test and verify that it is not detecting an unrelated failure.
  3. Stabilize the JDK, JVM options, build tools, dependencies, class path or module path, configuration, data, database state, and external services.
  4. Confirm one good commit and one bad commit by running the same test on both.
  5. Check that the expected history contains a usable good-to-bad transition; investigate non-monotonic or flaky behavior before trusting binary search.
  6. Start git bisect, mark the bad and good boundaries, and test each revision selected by Git.
  7. Mark each revision good, bad, or skip; do not label an unrelated build or infrastructure failure as the target regression.
  8. Use git bisect run when a script can classify revisions reliably with correct exit statuses.
  9. Decide whether normal graph traversal or --first-parent better matches how the relevant changes reached production.
  10. Inspect the reported first bad commit and determine whether it created the defect, exposed an older defect, or only correlates with the failure.
  11. Verify causality by retesting the candidate and its parent and, when practical, reverting or transferring the suspected change.
  12. Separate temporary production containment from the permanent root-cause correction.
  13. Add a regression test, run broader verification, document assumptions, and execute git bisect reset.
Practical Insights

With a clean linear range of N candidate commits, binary search normally requires about log base 2 of N classifications. A range of approximately 1,024 candidate commits therefore needs about 10 successful good-or-bad decisions rather than testing all 1,024. Merge topology, path restrictions, skipped revisions, flaky results, or repeated transitions can increase the work or prevent one exact answer. The main time cost is checking out, building, preparing data, and testing each selected revision. If one classification takes T time, the ideal total test time is roughly T multiplied by log base 2 of N, excluding setup, retries, and investigation. Git's own bisection state uses little memory. Practical disk and memory costs come from repository objects, worktrees, compiled classes, dependency caches, logs, recordings, heap dumps, test databases, and any services required by the test. Maintenance and operational costs are lower when builds are reproducible and tests are deterministic. Old toolchains, unavailable dependencies, changing external services, long builds, and skipped commits make the process slower and less certain.

Why Interviewers Ask This

Interviewers want to know whether the candidate can isolate a regression systematically instead of guessing. A strong answer demonstrates reliable reproduction, evidence-based classification, correct use of version-control history and binary search, control of Java build and runtime conditions, safe handling of untestable revisions and merge history, verification that the identified commit caused the failure, and prevention of the same regression.

Common interview mistakes

Common mistakes include starting without a reproducible target failure; using a vague or changing classification rule; choosing a supposedly good boundary without testing it; comparing revisions under different JDKs, JVM settings, dependencies, data, or configuration; using stale compiled outputs; allowing mutable databases or external services to change results; treating every compile or infrastructure failure as bad; using a flaky test without repeated trials; assuming the history contains only one permanent good-to-bad transition; overusing git bisect skip; ignoring merge topology; using --first-parent without understanding that it may identify only the merge commit; trusting the reported first bad commit without verifying its parent; confusing a commit that exposed a defect with the commit that created it; using an automation script with incorrect exit statuses; swallowing exceptions or interruption while creating the diagnostic test; treating a rollback as the root-cause fix; failing to add a regression test; and forgetting git bisect reset.

Interview tip

Present the workflow as reproduction, reliable classification, confirmed boundaries, binary search, edge-case handling, causality verification, root-cause correction, and regression prevention. Mention git bisect run, git bisect skip, merge-history choices, and the requirement for a stable good-to-bad signal. Make clear that the reported first bad commit must still be verified.

Interviewer may ask next
How would you automate a Git bisect for a Java regression?

I would create a deterministic wrapper script that cleans relevant outputs, prepares controlled inputs, builds only the required Maven or Gradle modules, and runs one focused test. It would return 0 for good, 125 for an untestable revision, a status from 1 through 127 other than 125 for bad, and 128 or higher when the process should stop. I would explicitly handle command-not-found, command-not-executable, dependency, and environment failures so they are not misclassified as the regression. Before running git bisect run <script>, I would test the script on the confirmed good and bad commits. I would keep the JDK, build-tool version, dependency sources, JVM options, configuration, database state, and external-service behavior stable.

What would you do if the regression is intermittent, the history contains merges, or some commits do not build?

For an intermittent regression, I would control timing, data, load, and random seeds where possible, run repeated trials, and use a documented classification threshold. I would repeat the final candidate-versus-parent comparison because one result is not reliable. For unrelated unbuildable revisions, I would use git bisect skip, temporarily repair the historical build without changing the tested behavior, or select a nearby revision. If too many adjacent revisions are skipped, Git may return several possible first-bad commits. For merge-heavy history, I would decide whether to search the full graph or use --first-parent to find the mainline merge, then perform a second bisect within the merged branch when I need the exact internal commit.

106. How do you verify that a bug fix does not reintroduce the issue?DebuggingHard

Question Details

Explain the validation steps you would use after fixing a bug, including tests and regression checks.

Short Interview Answer (30-60 seconds)

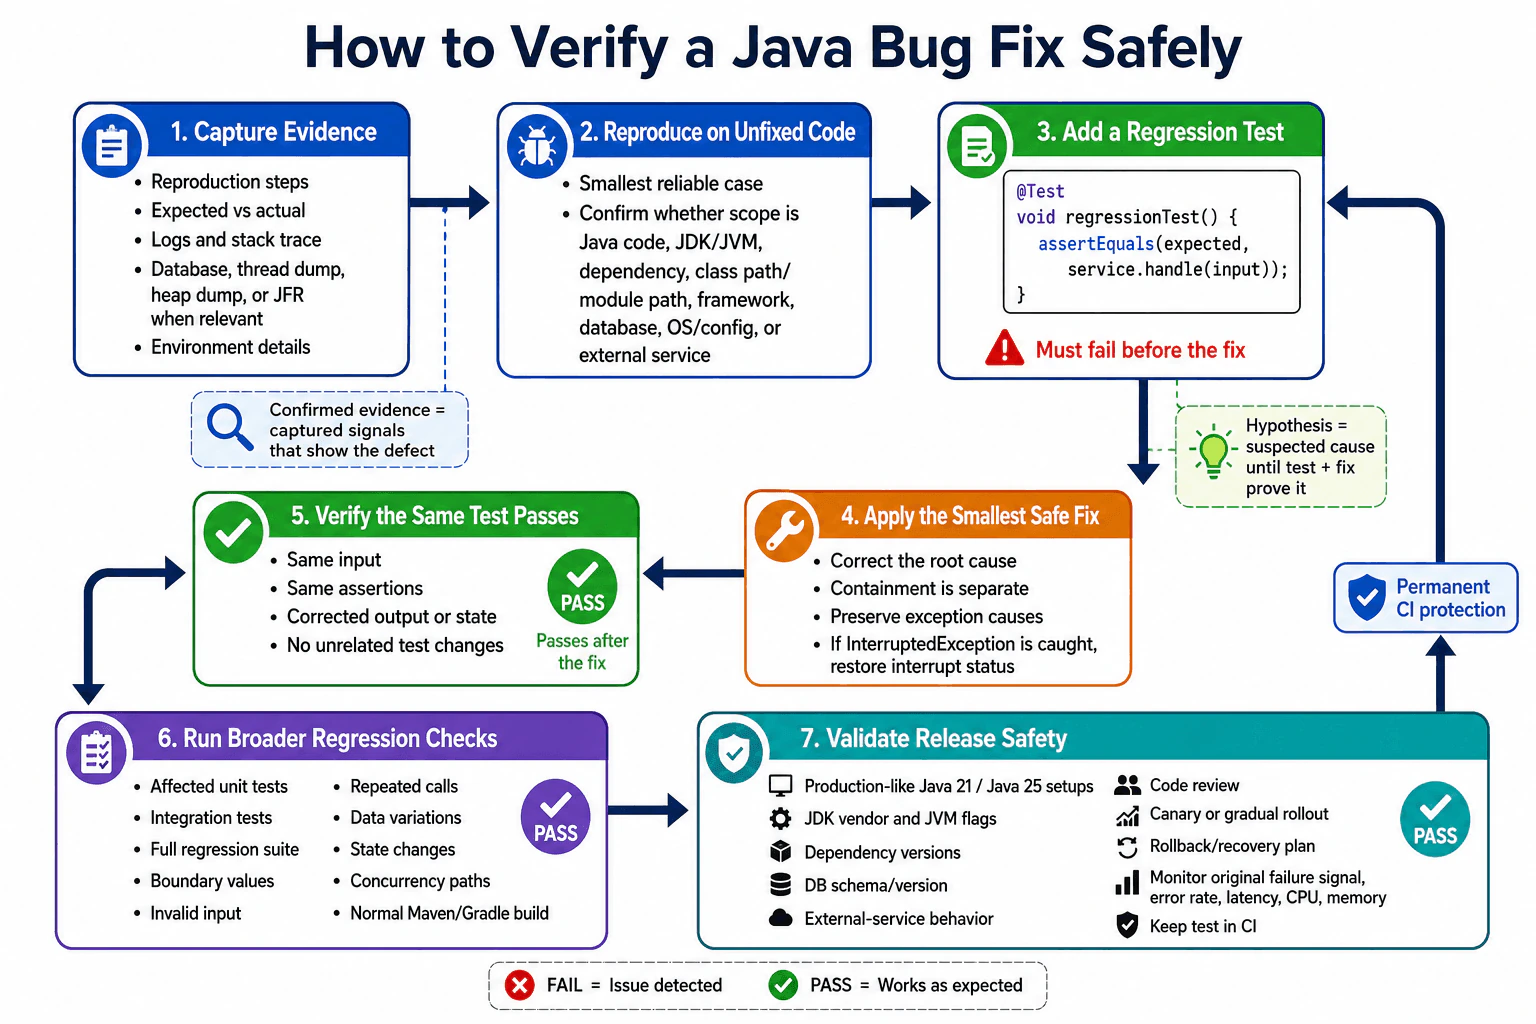
I reproduce the original failure and add an automated test that fails before the fix. After making the smallest root-cause change, I confirm the test passes, run affected and full regression tests, validate production-like conditions, deploy safely, monitor the original failure signal, and retain the test permanently.

Detailed Explanation

This question asks how I prove that a repaired problem stays repaired and will be detected if it returns. I should explain how I preserve the original failure, create a repeatable check, verify the exact change, and test nearby behavior that could be affected. A single successful manual attempt is not enough. I also need to consider different inputs and environments, obtain review, release the change safely, and observe the system afterward. The goal is clear evidence that the repair works, does not damage related behavior, and remains protected by an automatic check.

Useful clarifying questions:

Useful Questions to Ask the Interviewer
  • Can the original failure be reproduced reliably?
  • Which inputs, users, versions, and environments were affected?
  • What evidence identifies the original failure, such as an exception, incorrect result, database state, or operational signal?
  • Which components and workflows could be affected by the change?
  • Which automated test levels, staging environments, and deployment safeguards are available?
How do you verify that a bug fix does not reintroduce the issue? diagram
How to Explain It in an Interview

I use a layered verification process.

  1. Preserve the original evidence I record the exact reproduction steps, input, expected result, actual result, affected revision, environment, and relevant evidence. Evidence may include compiler output, a linkage error, an exception and its cause chain, an Error, logs, a stack trace, a thread dump, a heap dump, Java Flight Recorder data, database state, or an external-service response. I remove or mask secrets and personal data before storing evidence.
  1. Confirm the scope and reproduce the failure I determine whether the issue comes from Java source code, JDK or JVM behavior, Maven or Gradle dependencies, the class path or module path, a framework, an application server, a database, the operating system, configuration, concurrency, or an external service. I reproduce the defect on the unfixed revision or in a controlled equivalent environment. I begin with the smallest useful diagnostic case so the test is focused and repeatable.
  1. Create a regression test before relying on the fix A regression test is an automated test that detects the return of a previously fixed defect. I create a test that represents the original failure as closely as practical. I run it against the unfixed code and confirm that it fails for the expected reason. This fail-before-fix check proves that the test can detect the defect and is not merely a test that always passes.

The test level must match the cause. I use a unit test for isolated logic, an integration test for boundaries such as a database, framework, file system, message broker, or service contract, and an end-to-end test only when the defect depends on the complete workflow. Some defects need more specialized evidence. A race condition may require deterministic thread coordination, repeated stress tests, thread dumps, or Java Flight Recorder data. A memory problem may require heap analysis and a bounded soak test rather than only a functional assertion.

  1. Apply the smallest root-cause fix I separate containment from correction. A feature flag, retry, rollback, or temporary validation rule may reduce impact, but it does not prove that the cause is fixed. I change only what is needed to correct the demonstrated cause and avoid hiding failures. I preserve exception causes, do not swallow exceptions, and restore the thread interruption status when an InterruptedException cannot be propagated.
  1. Prove the original regression test now passes I run the same test after the change without weakening its assertions or changing the input to avoid the failure. I verify the expected return value, exception behavior, state transition, database effect, emitted event, or other relevant observable result. The test must fail on the old behavior and pass on the corrected behavior.
  1. Check boundaries, failure paths, and related behavior I inspect the change surface, including callers, shared utilities, interfaces, data models, queries, caches, transactions, dependency contracts, and concurrency paths. I test representative normal cases, boundary values, invalid input, null behavior where applicable, repeated calls, idempotency where required, partial failures, timeout behavior, and recovery paths. These checks help detect a fix that solves one input while breaking another.
  1. Run tests in increasing scope I run the new focused test first for fast feedback. I then run affected unit tests, module tests, integration tests, and the full regression suite as appropriate. I execute the normal Maven or Gradle build, including compilation, test execution, static analysis, dependency checks, and packaging checks configured by the project. I do not treat a successful compilation as proof that runtime behavior is correct.
  1. Validate supported environments I compare development and production-like conditions. Relevant differences may include Java 21 versus Java 25, JDK vendor, JVM flags, garbage collector, operating system, locale, time zone, CPU architecture, container limits, application-server version, database engine and schema, dependency versions, class path or module path, configuration, test data, and external-service behavior. I test only combinations the application claims to support, rather than implying that every possible combination must be exercised.
  1. Review the implementation and the test Another engineer should review the root-cause evidence, the scope of the change, and whether the regression test would genuinely detect the original defect. Review is especially important for synchronization, transactions, caching, exception handling, authorization, shared libraries, and compatibility changes. Where risk justifies it, mutation testing can provide additional evidence that the assertions detect meaningful behavioral changes, but it does not replace correct test design.
  1. Release with controlled risk I use the safest available deployment method, such as a canary, gradual rollout, feature flag, blue-green deployment, or a prepared rollback. The method depends on the application and infrastructure. I verify database migrations and compatibility separately when the fix changes stored data or schemas. A rollback plan must account for irreversible data changes rather than assuming that reverting application code is always sufficient.
  1. Monitor the original signal and related health indicators After release, I monitor the exact signal that represented the defect, such as a specific exception signature, incorrect result count, failed transaction, corrupted state, timeout, or user-visible failure. I also watch relevant latency, throughput, error rates, CPU, memory, thread usage, database behavior, and business outcomes. I compare them with a known baseline. The disappearance of one log message is not sufficient if requests are now failing in another way or incorrect data is being produced silently.
  1. Keep the protection permanently The regression test remains in continuous integration. I document the root cause when it is not obvious and improve diagnostics or alerts when missing evidence made the issue difficult to isolate. This turns the incident into a permanent prevention mechanism.

The main tradeoff is realism versus speed and stability. A focused unit test is fast and usually reliable, but it cannot prove an integration contract. An integration test gives stronger boundary evidence but requires more infrastructure and data management. An end-to-end test covers the full workflow but is slower and more likely to fail for unrelated reasons. I place the primary regression test at the lowest level that faithfully reproduces the root cause and add broader tests only when they cover distinct risks.

Technical Approach
  1. Capture the exact expected behavior, observed failure, input, affected revision, environment, and supporting evidence.
  2. Determine whether the cause is in Java code, the JDK or JVM, dependencies, the class path or module path, a framework, database, operating system, configuration, concurrency, or an external service.
  3. Reproduce the issue on the unfixed revision using the smallest reliable case.
  4. Add an automated regression test and confirm it fails for the expected reason before the fix.
  5. Apply the smallest change that corrects the demonstrated root cause.
  6. Run the unchanged regression test and confirm it now passes.
  7. Test boundaries, invalid input, state changes, failure paths, data variations, shared components, and relevant concurrency behavior.
  8. Run affected unit, module, integration, and full regression tests through the standard Maven or Gradle build.
  9. Validate the supported production-like JDK, JVM, dependency, database, operating-system, configuration, and external-service combinations.
  10. Obtain an independent review of both the fix and the test.
  11. Deploy with controlled exposure and a viable rollback or recovery plan.
  12. Monitor the original failure signal and related system and business indicators.
  13. Retain the regression test in continuous integration and improve documentation or diagnostics.
Practical Insights

This process normally has no meaningful algorithmic time or space complexity because it is a verification workflow rather than a data-processing algorithm. Its costs come from test execution, infrastructure, test data, and maintenance. A focused unit test usually runs quickly and uses little memory. Integration tests may start databases, containers, application contexts, or external-service substitutes, so they take more time and memory. End-to-end, load, soak, concurrency, Java Flight Recorder, and heap-analysis checks can require substantial CPU, memory, storage, and engineer time. Their cost depends on the application and cannot be claimed as a fixed amount. The practical goal is to keep the primary regression test at the lowest reliable level and add expensive checks only for risks that cheaper tests cannot cover.

Why Interviewers Ask This

Interviewers are evaluating whether the candidate can prove that a defect is fixed rather than relying on one successful manual check. A strong answer demonstrates controlled reproduction, evidence preservation, root-cause reasoning, an effective fail-before-fix regression test, impact analysis, appropriate test-level selection, environment validation, safe release practices, and post-deployment monitoring. It also shows that the candidate understands the difference between confirming the original behavior and checking that the fix has not damaged related behavior.

Common interview mistakes

Common mistakes include confirming the fix with one manual attempt, writing the regression test only after changing the code without proving it fails on the old revision, accepting a failure for the wrong reason, weakening assertions until the test passes, testing only the happy path, and deleting the test later. Other mistakes include fixing a symptom rather than the root cause, running only the new test, ignoring callers and shared components, overlooking invalid data or concurrency paths, assuming the developer's JDK and configuration match production, confusing successful compilation with runtime correctness, using unrealistic test doubles for an integration defect, swallowing exceptions, losing InterruptedException status, exposing sensitive production evidence, deploying without rollback or data-recovery planning, and declaring success without monitoring the original failure signal.

Interview tip

Present the answer as a chain of evidence: reproduce the original defect, prove a test fails before the fix, make the smallest root-cause change, prove the same test passes afterward, check related behavior, validate supported environments, release safely, and monitor the original signal. Emphasize that the permanent regression test prevents a later change from silently restoring the bug.

Interviewer may ask next
What would you do if the original bug cannot be reproduced reliably?

I would not claim that the defect is fixed merely because it did not appear again. I would preserve the available input, version, environment, logs, stack traces, exception causes, database evidence, thread dumps, heap dumps, Java Flight Recorder recordings, timing information, and external-service responses. I would add safe diagnostic instrumentation and define a measurable signal that represents the failure. For an intermittent concurrency issue, I might introduce deterministic thread coordination, repeated stress tests, controlled scheduling, or fault injection. I would validate the proposed fix against the strongest available evidence, deploy it gradually with rollback protection, and continue monitoring the original signal until the evidence supports the root cause and the correction.

How do you choose between a unit test, integration test, and end-to-end regression test?

I choose the lowest test level that faithfully reproduces the root cause. A unit test is appropriate for isolated logic and gives fast, stable feedback. An integration test is needed when the behavior depends on a database, framework, dependency, file system, message broker, application server, or external-service contract. An end-to-end test is justified when the defect exists only across the complete workflow. I may use multiple levels when they cover different risks, but I avoid depending only on a slow or fragile end-to-end test when a focused lower-level test can permanently detect the defect.

107. What is Java application profiling?NEWPerformanceEasy

Question Details

Define profiling as measuring where a running Java application spends time and resources. Explain CPU sampling, wall-clock time, allocations, heap use, garbage collection, thread states, locks, and I/O waits. Introduce Java Flight Recorder and JDK Mission Control, and explain why a developer should reproduce the problem and record a baseline before optimizing.

Short Interview Answer (30-60 seconds)

I would first reproduce the problem with a representative workload and record a baseline. Java application profiling means measuring where a running Java application spends time and resources. I can use Java Flight Recorder to collect CPU samples, wall clock time, allocations, heap activity, garbage collection events, thread states, lock contention, and I/O waits. I can then inspect the recording in JDK Mission Control. I optimize only after the data shows the real bottleneck, then I repeat the same test and compare the results. Profiling has some overhead, and sampling can miss very short events, so I use it as evidence rather than absolute proof.

Detailed Explanation

When a Java application feels slow or uses too many resources, I should not guess which code is causing the problem. I first repeat the same problem with similar requests, data, and load. Then I record what the program is doing while it runs. This shows where time is spent, where memory grows, and where work is waiting. I keep these first results as a baseline. After I find the main cause, I make one small change and run the same test again to see whether the change really helped.

Useful Questions to Ask the Interviewer
  1. Are we investigating slow response time, high CPU use, high memory use, long pauses, or another symptom?
  2. Can we reproduce the problem with representative requests, data, and load?
  3. Do we already have application metrics or traces that show when the problem happens?
What is Java application profiling? diagram
How to Explain It in an Interview

Java application profiling is the process of measuring where a running Java application spends time and resources. The goal is to find the real bottleneck before changing code.

I would begin with a measurable symptom. For example, the application may have slow response time, high CPU use, growing memory, frequent garbage collection pauses, or threads that spend too much time waiting. I would also check existing application metrics first because they help show when the problem happens and which part of the system is affected.

Next, I would reproduce the problem using representative traffic, data sizes, and dependency behavior. This matters because a profile from an unrealistic test may point to the wrong bottleneck. I would save the first measurements as the baseline.

For a Java process, Java Flight Recorder is a useful tool because it can record many JVM events with relatively low overhead. I can inspect the recording with JDK Mission Control and correlate events over time.

CPU sampling shows which methods and threads are using processor time. It takes repeated samples of running stacks, so it is useful for finding CPU hot spots. A sampling profiler can miss very short activity, so one sample should not be treated as final proof.

Wall clock time measures elapsed time from start to finish. It includes both active work and waiting. This helps when a request is slow even though CPU use is not high.

Allocation information shows where objects are being created. A high allocation rate can create more garbage collection work. Heap measurements show how much Java heap memory is in use and which kinds of objects occupy it. If memory keeps growing, I may need a heap histogram or heap dump in addition to the recording because profiling alone does not answer every retention question.

Garbage collection events show collection frequency, pause duration, and related heap behavior. Thread states show whether threads are running, waiting, blocked, or parked. Lock information shows contention when several threads compete for the same synchronization point. I/O waits help reveal time spent waiting for disk, network calls, databases, queues, or other external work.

The important point is to separate active CPU work from waiting time. A slow application can have low CPU use because threads are blocked on I/O, locks, databases, or other dependencies. If needed, I would combine profiling with application metrics and distributed traces to understand time outside the JVM process.

After the evidence identifies the main bottleneck, I would make one targeted change. The exact change depends on the measured cause. I would not add caching, concurrency, more threads, or other changes without evidence that they address the problem.

Finally, I would repeat the same representative workload and compare the new results with the baseline. I would check the same latency, throughput, CPU, memory, garbage collection, error, and dependency measurements that matter for the problem. I would also verify that application behavior is still correct and that the bottleneck was reduced rather than moved to another resource. After deployment, I would continue watching the same production metrics.

Technical Approach
  1. Define the visible symptom and the metric that proves it, such as response time, CPU use, memory use, or garbage collection pause time.
  2. Check existing application metrics and traces to understand when the problem happens.
  3. Reproduce the problem with representative requests, data, concurrency, and dependency behavior.
  4. Record a baseline before changing code.
  5. Use Java Flight Recorder while the application runs under the same workload.
  6. Open the recording in JDK Mission Control and inspect CPU samples, wall clock time, allocations, heap activity, garbage collection, thread states, locks, and I/O waits.
  7. Classify the bottleneck using evidence. Decide whether the main cost is CPU work, memory behavior, garbage collection, synchronization, or waiting on another resource.
  8. Make one small change that addresses the measured bottleneck.
  9. Run the same workload again and compare the same measurements with the baseline.
  10. Verify correctness, check that the bottleneck did not move elsewhere, and monitor the same measurements after deployment.
Practical Insights

Profiling adds some CPU, memory, storage, and analysis cost because the application records runtime information. Java Flight Recorder is designed for relatively low overhead, but the exact cost depends on which events and settings are enabled. Sampling also has a tradeoff because it reduces measurement cost but may miss very short activity. Recording for longer periods creates larger files and takes more time to analyze. The investigation also needs a representative test environment or safe production process. The main engineering cost is usually collecting reliable evidence, keeping the workload comparable, and validating that the final change improves performance without harming correctness or moving the bottleneck somewhere else.

Why Interviewers Ask This

Interviewers ask this question to see whether a Java developer measures a real performance problem before changing code. They want to know whether the candidate can choose useful measurements, separate CPU work from waiting and memory problems, use Java Flight Recorder and JDK Mission Control correctly, and compare the same workload before and after a change.

Common interview mistakes

Common mistakes include optimizing code before collecting a baseline, testing with unrealistic requests or data, and comparing results from different workloads. Another mistake is treating high wall clock time as proof of high CPU use, because the application may actually be waiting for a database, network call, disk operation, queue, or lock. Developers may also focus only on average latency and miss slow requests, treat one profiler recording as complete proof, or assume that more threads will automatically improve throughput without measuring resource limits. Memory investigations can also go wrong when allocation activity is confused with retained memory. After a change, it is a mistake to skip correctness checks or ignore whether the bottleneck moved to another dependency.

Interview tip

Explain profiling as a measurement process, not as a tool name. Start with the symptom, reproduce it, record a baseline, profile the running JVM, classify where time or memory is going, make one evidence based change, and measure again. Mention Java Flight Recorder and JDK Mission Control, but also explain what information they help you see and why the baseline matters.

Interviewer may ask next
What if the application is slow but the CPU profile does not show any hot method?

I would not conclude that the application has no performance problem. For the same slow workload and request boundary, I would inspect wall clock time, thread states, locks, and I/O waits. The threads may be waiting for a database, network call, disk operation, queue, or another thread instead of using CPU. I would also use application metrics or distributed tracing when the delay is outside the JVM process. This matters because optimizing Java methods would not help if most of the elapsed time is waiting elsewhere.

Can I leave Java Flight Recorder running in production and trust it as complete proof of the bottleneck?

I can use Java Flight Recorder for production observation when its configuration and overhead are acceptable, but I would not treat it as complete proof by itself. For the same production workload and measurement boundary, I would combine the recording with application metrics and traces when needed. Sampling can miss very short events, and JVM profiling may not explain every native allocation or operating system wait. The tradeoff is that collecting more detail can increase overhead and data volume, so I would record the information needed for the exact question and verify the conclusion with the same baseline measurements.

108. How would you profile a slow Java application to find the bottleneck?PerformanceHard

Question Details

Explain how you would measure the slowdown, identify the hot path, and confirm the primary bottleneck in a Java application.

Short Interview Answer (30-60 seconds)

I would first reproduce the slowdown with representative load and capture a baseline for latency percentiles, throughput, errors, CPU use, heap use, and garbage collection time. Then I would use metrics and distributed tracing to break the request into queue wait, Java execution, database calls, network calls, and external service time. If the hot path is inside the JVM, I would use Java Flight Recorder with JDK Mission Control and async profiler to inspect CPU hot methods, allocation churn, garbage collection events, and lock time. I would change only the measured bottleneck, repeat the same test, verify correctness, and check whether the bottleneck moved elsewhere.

Detailed Explanation

This question asks how I would find the real reason a Java application is slow. I should not guess or start changing code immediately. I should first measure what users experience, repeat the problem with realistic work, and divide the total waiting time into smaller parts. Then I should collect evidence from the Java process and the services it calls. The goal is to identify the part that consumes the most time or resources, make one focused change, and prove that the application becomes faster without changing correct behavior.

Useful Questions to Ask the Interviewer
  1. Does the slowdown affect one request path or the whole application?
  2. Which result matters most, latency, throughput, errors, CPU use, or memory use?
  3. Can the issue be reproduced with representative traffic, payloads, data, and dependency behavior?
  4. Is the application running in one JVM or across several services and replicas?
  5. Are production metrics, traces, Java Flight Recorder data, and load test results available?
How would you profile a slow Java application to find the bottleneck? diagram
How to Explain It in an Interview

I would start by defining the symptom and the measurement boundary. For the representative application request in the diagram, I would measure end to end latency, throughput, and error rate. I would also watch CPU utilization, heap usage, allocation rate, garbage collection time, and resource saturation. End to end latency includes request queueing, Java code, database calls, network calls, and external services. Time inside the JVM is only one part of that total.

Next, I would reproduce the problem using representative traffic, concurrency, payload size, data volume, warmup, and dependency behavior. I would capture the baseline before changing code. Tail percentiles such as p95 and p99 are often more useful than an average because an average can hide a smaller group of very slow requests.

I would then break the request path into request arrival, queue or thread wait, Java application code, database calls, external service or network time, and response completion. Application metrics show trends, errors, and saturation. Distributed tracing shows where wall clock time is spent across the request path. This evidence tells me whether the request is mainly executing Java code or waiting for another resource.

If metrics and tracing point to the JVM, I would profile the suspected Java area. Java Flight Recorder with JDK Mission Control can correlate CPU samples, allocation events, garbage collection activity, thread states, and lock events. Async profiler can sample CPU time, wall clock time, allocations, and lock behavior for the suspected call path. These tools observe the running process through profiling data. They are not execution stages in the request path.

In the approved diagram, the measured primary bottleneck is a hot Java loop that creates too many temporary objects. The repeated allocations increase CPU work and create extra garbage collection pressure. I would confirm this conclusion by correlating CPU hot methods, allocation samples, garbage collection events, and the matching request trace. One profiler sample by itself is not enough proof.

The targeted change is to reduce repeated allocations and improve the hot loop or algorithm. I would not add unrelated caching, database changes, more threads, or asynchronous processing when the evidence points to allocation heavy Java code. I would keep the change focused so its effect and correctness are easy to validate.

After the change, I would run the same representative load and compare the same measurements. I would look for lower latency, better throughput, and lower CPU and garbage collection pressure. I would also run functional and regression tests to confirm that the output and behavior remain correct.

Finally, I would check whether the bottleneck moved to the database, network, locks, queues, or another dependency. I would continue monitoring the same production metrics and configure useful alerts. Sampling can miss very short events, tracing can be sampled, and a microbenchmark does not prove end to end production performance. The conclusion should therefore come from several matching signals collected under representative load.

Technical Approach
  1. Define the visible symptom and the success metric. Record the latency percentiles, throughput, errors, CPU use, heap use, allocation rate, and garbage collection data that matter for the request.
  1. Define the measurement boundary. Separate end to end request latency from time spent inside Java code.
  1. Reproduce the slowdown with representative traffic, concurrency, payload size, data volume, warmup, and dependency behavior.
  1. Capture a baseline before changing code.
  1. Break the request into request arrival, queue or thread wait, Java application code, database calls, external service or network time, and response completion.
  1. Use metrics for trends, errors, and saturation. Use distributed tracing for request path timing.
  1. Profile the suspected JVM area with Java Flight Recorder and JDK Mission Control. Use async profiler for sampled CPU, wall clock, allocation, or lock evidence when useful.
  1. Correlate evidence from traces, CPU hot methods, allocation samples, garbage collection events, and lock data.
  1. Confirm the primary bottleneck. In this case, it is a hot Java loop with excessive temporary object allocation.
  1. Apply one targeted change. Reduce repeated allocations and improve the hot loop or algorithm.
  1. Run the same representative load again and compare the same metrics.
  1. Verify functional correctness and confirm that the bottleneck was reduced rather than moved elsewhere.
  1. Monitor the same production signals after deployment and watch for regression.
Practical Insights

The investigation has a practical cost. Metrics, tracing, and profiling use some CPU, memory, storage, and network capacity. Java Flight Recorder is designed for relatively low overhead recording, but enabling more events can increase the cost. Async profiler uses sampling, so its overhead is usually controlled, but it may miss very short events. Load testing also consumes time and infrastructure and can create pressure on databases and external services.

The optimization has tradeoffs too. Reducing temporary allocations can lower CPU and garbage collection work, but a more complex loop or algorithm may be harder to understand and maintain. Reusing mutable objects can create correctness and thread safety problems. The final decision should balance measured performance gain, code clarity, memory use, reliability, and operational cost.

Why Interviewers Ask This

Interviewers ask this question to test whether a candidate measures before changing code. They want to see whether the candidate can separate total request latency from time spent in Java code, queues, databases, networks, locks, and external services. They also evaluate tool selection, evidence correlation, bottleneck classification, optimization judgment, correctness validation, and production monitoring.

Common interview mistakes

A common mistake is changing code before defining the symptom and recording a baseline. Another mistake is using only average latency and missing slow tail requests. Profiling one local request with unrealistic traffic, data size, concurrency, warmup, or dependency behavior can also produce a false conclusion.

Candidates often confuse CPU time with waiting time. A slow request may spend most of its time in a queue, database call, network call, lock, or external service. A JVM profiler alone cannot prove that a database or network dependency is the root cause.

Other mistakes include treating one sample as complete proof, assuming high memory use is always a leak, using a microbenchmark as proof of service performance, adding more threads without checking downstream limits, changing several things at once, comparing different workloads before and after, ignoring functional correctness, and failing to check whether the bottleneck moved elsewhere.

Interview tip

Present the answer in a strict order: measure the symptom, define the boundary, reproduce with representative load, break down the request path, profile the suspected area, confirm one bottleneck, apply one targeted change, and retest with the same workload. Name what each tool measures. Finish with correctness checks, profiler limitations, production monitoring, and a check for a moved bottleneck.

Interviewer may ask next
What would you do if CPU utilization is low but p99 latency is still high?

I would not classify the representative application request as CPU bound. Low CPU use with high p99 latency suggests that some requests may be waiting. I would use distributed tracing and application metrics to separate queue wait, thread pool wait, database time, connection pool wait, network time, external service time, and lock time. I would also inspect JVM thread states with Java Flight Recorder and JDK Mission Control. The measurement boundary remains end to end latency, not only Java CPU time. Tracing may be sampled and instrumentation can add overhead, so I would combine traces with metrics and repeat the test under representative load.

How would you validate the allocation reduction safely after deployment?

I would first confirm the change under the same representative application load by comparing latency percentiles, throughput, CPU use, allocation rate, heap behavior, garbage collection time, and errors. I would run functional and regression tests because changing the hot Java loop must not change outputs or behavior. During deployment, I would use a controlled rollout when available and monitor the same signals for regression. I would also check whether the bottleneck moved to the database, network, locks, or queues. The main tradeoff is that a more allocation efficient implementation can be harder to understand or can introduce unsafe object reuse, so code clarity and thread safety must remain part of the review.

109. How do you tell whether a Java service is CPU-bound or I/O-bound?PerformanceHard

Question Details

Describe how you would measure and compare CPU, wait time, and I/O behavior in a Java service.

Short Interview Answer (30-60 seconds)

I start by running a representative workload and recording latency, throughput, errors, CPU utilization, run queue, and dependency time. Then I separate time spent executing Java code from time spent waiting on locks, queues, pools, databases, networks, or disk. High CPU utilization with compute hot spots in a CPU profile suggests CPU bound work. Lower CPU utilization with large dependency spans or storage and network waits suggests input output bound work. I make one change that targets the measured cause, then retest with the same workload and verify correctness.

Detailed Explanation

This question asks how to discover why a Java service is slow. The service may spend most of its time doing calculations, or it may spend most of its time waiting for another resource. I would not guess from the type of application. I would run realistic traffic, measure the service, and compare the evidence. The goal is to find where request time goes, choose one change that matches the measured cause, and prove that the change helps without breaking correct behavior.

Useful Questions to Ask the Interviewer
  1. Which Java service operation should I investigate?
  2. Is the main symptom high latency, low throughput, errors, or a combination?
  3. What traffic mix, payload size, concurrency, data volume, and dependency behavior represent normal production use?
  4. Which latency percentile matters most, such as p95 or p99?
  5. Can I run a controlled load test and attach a profiler safely?
How do you tell whether a Java service is CPU-bound or I/O-bound? diagram
How to Explain It in an Interview

I would begin with a representative workload. I would use the same traffic mix, payloads, concurrency, data size, dependency behavior, and warmup that the service normally sees. I would record a baseline for p95 latency, throughput, error rate, CPU utilization, run queue, and dependency time.

Next, I would define the measurement boundary. End to end latency is not the same as Java execution time. A request can spend time waiting in a queue, running application code, waiting for a lock, waiting for a thread pool or connection pool, calling a database, calling another service, reading from disk, serializing data, and returning the response.

I would first use application and operating system metrics. CPU utilization and the run queue show whether the Java process and host are near CPU saturation. Request metrics show latency percentiles, throughput, and errors. These metrics show trends and symptoms, but they do not identify every method or dependency responsible for the delay.

For work inside the Java process, I would use Java Flight Recorder with JDK Mission Control or async profiler during representative load. A CPU profile answers which methods consume execution time. A wall clock or lock profile helps reveal blocking, lock contention, pool waits, and other waiting inside the process. A sampling profiler usually has low overhead, but it may miss very short events, so one sample is not final proof.

For external time, I would use distributed tracing and dependency metrics. Trace spans can show time spent in database calls, remote HTTP calls, queues, and other services. Database query timing and execution plans are needed for database problems. A Java CPU profile alone cannot prove that a database or network dependency is the root cause.

I would classify the service as CPU bound when CPU utilization is near saturation, the run queue shows pressure, CPU profiles are dominated by compute hot spots, and dependency wait is relatively small. Common hot areas can include algorithms, parsing, serialization, framework code, or allocation heavy code.

I would classify the service as input output bound when CPU utilization is not saturated and a large part of request time is spent waiting for a database, network, disk, queue, or external service. Traces and dependency timings should support that conclusion. Lock, queue, and pool delays are waiting problems too, so I would not incorrectly call them CPU work.

The change must match the evidence. For CPU bound work, I may improve the algorithm, remove repeated computation, reduce unnecessary allocation, or reduce serialization work. For input output bound work, I may improve a proven slow query, batch operations, reduce remote calls, cache suitable data, or tune connection usage.

Each choice has tradeoffs. Caching can return stale data and use more memory. Batching can increase delay for one request. More connections can overload a downstream system. An algorithm change can reduce CPU use but make the code harder to understand or maintain.

After the change, I would repeat the same load test and compare the same measurements. I would check latency, throughput, errors, CPU utilization, and dependency time. I would also verify that the response data and service behavior remain correct. Finally, I would check whether the bottleneck moved to another dependency, queue, pool, memory limit, or resource. After deployment, I would continue monitoring the same metrics because a local or short test does not prove production improvement.

Technical Approach
  1. Name the exact Java service operation and the visible symptom.
  2. Define the success metric, such as lower p95 latency or higher throughput without more errors.
  3. Reproduce the problem with representative traffic, payloads, concurrency, data, dependencies, and warmup.
  4. Record the baseline for latency, throughput, errors, CPU utilization, run queue, and dependency time.
  5. Separate Java execution from lock, queue, pool, database, network, disk, and external service wait.
  6. Use metrics for trends, tracing for request path timing, and Java Flight Recorder or async profiler for in process CPU and waiting evidence.
  7. Classify the bottleneck from combined evidence rather than intuition.
  8. Apply one targeted change that addresses the measured cause.
  9. Retest with the same representative workload and compare the same metrics.
  10. Verify correctness and check whether the bottleneck moved to another resource.
  11. Monitor the same measurements after deployment.
Practical Insights

The investigation adds some cost. Metrics usually have low overhead, while tracing and profiling add CPU, memory, storage, and analysis work. Sampling profilers usually have lower overhead than detailed instrumentation, but they can miss short events. A realistic load test also needs time, test data, controlled dependencies, and enough capacity to avoid harming production. The optimization can introduce new costs. Caching uses memory and can return stale data. Batching may increase delay for one request. More connections may move pressure to the database. Algorithm changes may reduce CPU use but make the code harder to maintain. The goal is a measured improvement with acceptable operational and correctness tradeoffs.

Why Interviewers Ask This

Interviewers ask this question to test whether a candidate measures a real service before changing code. They want to see whether the candidate can separate computation from waiting, choose suitable evidence, use Java profiling and tracing correctly, and verify that an optimization improves the service without moving the problem to another resource.

Common interview mistakes

Common mistakes include optimizing before collecting a baseline, using average latency instead of useful percentiles, profiling only a small or unrealistic request, and treating one profiler sample as complete proof. Another mistake is confusing CPU execution with waiting on a lock, queue, thread pool, connection pool, database, network, or disk. A Java CPU profile does not prove a database root cause, and a microbenchmark does not prove service performance under realistic concurrency. Candidates also make mistakes by adding more threads, virtual threads, connections, workers, caches, or replicas without measuring CPU, memory, downstream limits, and queueing. Comparing different workloads before and after a change makes the result unreliable. The final mistake is checking speed but not correctness, errors, resource saturation, or whether the bottleneck moved elsewhere.

Interview tip

Explain the answer as an evidence chain. Start with the symptom and baseline. Separate Java execution from waiting. State what metrics, tracing, and profiling each reveal. Describe the signals for CPU bound and input output bound behavior. Finish with one targeted change and verification under the same workload. Do not list tools without explaining the question each tool answers.

Interviewer may ask next
What if CPU utilization is low, but latency is high and many Java threads are blocked?

I would not classify the target Java service operation as CPU bound. Low CPU utilization with many blocked threads suggests waiting inside the process. I would inspect lock profiles, thread states, queue delay, thread pool saturation, and connection pool wait. I would also use tracing to separate internal waiting from database or remote service time. This matters because adding CPU capacity or optimizing an algorithm would not target the measured cause. The change may involve reducing lock contention, shortening a critical section, correcting pool sizing, or removing a blocking dependency. Increasing a pool can move pressure to memory or a downstream service, so I would retest with the same representative workload.

How would you validate the result safely in production when sampling and tracing may miss some events?

I would combine several forms of evidence for the same target Java service operation and use a controlled rollout. I would compare application metrics, operating system metrics, distributed traces, and a low overhead sampling profiler rather than trusting one source. I would keep the same latency, throughput, error, CPU, and dependency measurements used for the baseline. A canary or staged release can limit risk while showing whether the change works with real traffic. Sampling may miss short events and tracing may omit some requests, so trends across enough traffic matter more than one profile. I would also verify output correctness and watch for a moved bottleneck in queues, pools, memory, databases, or remote services.

110. How would you reduce GC pauses in a Java backend?PerformanceHard

Question Details

Explain the evidence you would gather, the GC-related changes you would consider, and how you would validate improvement.

Short Interview Answer (30-60 seconds)

I would first prove that the request latency spikes coincide with garbage collection pauses. Under the same representative and warmed workload, I would record p95 and p99 latency, pause duration and frequency, allocation rate, old generation occupancy after collection, throughput, CPU, memory, and errors. I would combine GC logs, Java Flight Recorder with JDK Mission Control, and heap histograms or dumps when retention is suspected. The evidence would tell me whether to reduce allocation churn, correct retained objects, give the live set more heap headroom, or consider a different collector. I would then repeat the same load test, verify correctness, and check whether the bottleneck moved elsewhere.

Detailed Explanation

The goal is to reduce the times when the Java service briefly stops normal request work to manage memory. I would not begin by changing heap settings or collectors. I would first prove that garbage collection pauses are causing the slow requests. Then I would determine whether the service creates too many temporary objects, keeps objects alive too long, or lacks enough heap space for the objects it must retain. I would change only the measured cause and compare the same representative workload before and after.

Useful Questions to Ask the Interviewer
  1. Which latency target matters most, such as p95 or p99?
  2. What traffic mix, concurrency, payload size, and data shape represent production?
  3. Which Java version, garbage collector, heap limits, and container memory limits are currently used?
  4. Are the pauses mainly young collections, mixed collections, or full collections?
  5. What is the old generation occupancy after each collection?
  6. Can Java Flight Recorder run safely during a representative test?
How would you reduce GC pauses in a Java backend? diagram
How to Explain It in an Interview

I would begin with the user visible symptom. For this Java backend, request latency spikes occur at the same time as garbage collection pauses. My measurement boundary includes the complete request handling path and the JVM memory behavior that can interrupt it.

First, I would capture a baseline. I would record p95 and p99 request latency, garbage collection pause duration and frequency, allocation rate, old generation occupancy after collection, throughput, CPU use, memory footprint, and error rate. Percentiles matter because a short pause may affect only a portion of requests while still causing severe tail latency.

Next, I would reproduce the behavior under the same representative load. The test should use the same traffic mix, concurrency, payload sizes, data shape, and dependency behavior as production. The JVM should be warmed so that class loading and just in time compilation do not distort the comparison.

I would combine several evidence sources because each tool answers a different question. Application metrics show latency percentiles and garbage collection trends over time. GC logs show the collection type, cause, duration, and frequency. Java Flight Recorder with JDK Mission Control can correlate allocation hot spots, promotion activity, safepoints, and other JVM events with the pause periods. A heap histogram or heap dump is useful when retained objects, unbounded caches, or long lived references are suspected. A heap dump should be collected carefully because it can consume significant disk space and may disturb a large production process.

The evidence should lead to a specific cause.

If the allocation rate is high and young collections are frequent while old generation occupancy remains low, the likely cause is allocation churn. I would inspect the hot request paths and reduce unnecessary temporary objects or large object creation. Examples include repeated conversions, duplicate buffers, unnecessary intermediate collections, and avoidable serialization objects.

If old generation occupancy remains high after collection and mixed or full collections become longer, the likely cause is retained objects or old generation pressure. I would inspect retained references, correct object lifetimes, bound caches, and remove references that keep data alive longer than required. High memory usage alone does not prove a leak. The important evidence is what remains alive after collection and whether retained memory continues to grow.

If the retained objects are valid but old generation fills again quickly, the heap may be too small for the live set. I would give the live set adequate headroom while remaining within container and host memory limits. I would not increase the heap blindly because a larger heap consumes more memory and may increase some collection work.

Collector choice comes after understanding allocation, retention, and heap sizing. G1 is a common balanced default for many services. ZGC or Shenandoah can be considered when very low pause times are a major requirement and the Java version, heap size, CPU budget, and operational environment support them. A collector change can alter pause behavior, but it does not remove excessive allocation or incorrect object retention.

After applying one targeted change, I would rerun the same representative and warmed workload. I would compare the complete pause distribution, p95 and p99 latency, throughput, CPU use, memory footprint, and error rate. I would verify that responses and business behavior remain correct. I would also check whether the pressure moved to CPU, memory, database connections, another dependency, or another stage of request handling.

Finally, I would monitor the same metrics after deployment. A sampling profiler can miss very short events, recording adds some overhead, and a microbenchmark may not represent the complete service. Representative load testing is therefore more important than relying on a microbenchmark alone.

Technical Approach
  1. Define the symptom as request latency spikes that coincide with garbage collection pauses.
  2. Capture baseline p95 and p99 latency, pause duration and frequency, allocation rate, old generation occupancy after collection, throughput, CPU, memory, and errors.
  3. Reproduce the behavior with the same representative traffic mix, concurrency, payload sizes, data shape, dependency behavior, and a warmed JVM.
  4. Use application metrics to compare latency percentiles and garbage collection trends.
  5. Use GC logs to identify collection types, causes, durations, and frequency.
  6. Use Java Flight Recorder with JDK Mission Control to inspect allocation hot spots, promotion, safepoints, and correlated JVM events.
  7. Use a heap histogram or heap dump when retained objects or long lived references are suspected.
  8. Classify the main cause as allocation churn, retained objects and old generation pressure, or insufficient heap headroom for the valid live set.
  9. Apply one targeted change that matches the evidence.
  10. Consider collector tuning only after allocation, retention, and sizing causes are understood.
  11. Retest with the same representative and warmed workload.
  12. Compare pause distribution, p95 and p99 latency, throughput, CPU, memory footprint, and errors.
  13. Verify correctness and check whether the bottleneck moved to another resource or dependency.
  14. Continue monitoring the same metrics after deployment.
Practical Insights

This investigation has operational cost rather than traditional algorithm complexity. Application metrics and GC logs usually have low overhead. Java Flight Recorder is designed for practical runtime observation, but detailed event settings increase recording overhead and data volume. Heap dumps can require a large amount of disk space and may disturb the running process. Reducing temporary objects can lower allocation and collection work, but unnecessary object reuse can make code harder to understand or introduce unsafe shared state. Increasing heap headroom uses more memory and can increase some collection work. Low pause collectors can consume more CPU and require additional testing and operational knowledge. Representative load testing also requires enough time and infrastructure to reproduce realistic traffic safely.

Why Interviewers Ask This

Interviewers ask this question to see whether a candidate measures the real problem before changing JVM settings. They evaluate whether the candidate can connect request latency to garbage collection evidence, select appropriate JVM tools, distinguish allocation churn from retained objects and insufficient heap headroom, choose a targeted change, explain collector tradeoffs, and validate the result safely under representative production load.

Common interview mistakes

Common mistakes include changing heap settings before proving that garbage collection causes the latency problem, looking only at average latency, testing with a cold JVM, and comparing different workloads before and after. Another mistake is treating all high memory usage as a leak without checking old generation occupancy after collection or retained object growth. Candidates may confuse high allocation with high retention, assume that a larger heap is always better, or change collectors without correcting object churn. A heap histogram does not answer the same question as an allocation profile. One profiler sample is not complete proof. JMH can answer a small isolated timing question, but it cannot prove service level improvement. It is also a mistake to ignore correctness, error rate, CPU cost, container limits, or a bottleneck that moved elsewhere.

Interview tip

Present the answer as a measurement and decision flow. Start with the latency symptom and baseline metrics. Explain what each tool measures. Classify the evidence as allocation churn, retained objects, or insufficient heap headroom. Apply one targeted change, then finish with the same load retest, correctness verification, and a check for a moved bottleneck. Do not begin by listing JVM flags.

Interviewer may ask next
What would you conclude if young collections are frequent but old generation occupancy stays low after each collection?

I would suspect allocation churn in the Java backend request path rather than retained objects. Under the same representative and warmed workload, I would confirm a high allocation rate and frequent young collections with GC logs and Java Flight Recorder allocation evidence. I would inspect the hot request paths for unnecessary temporary objects, duplicate buffers, repeated conversions, intermediate collections, or large object creation. I would reduce only the unnecessary allocations and then compare pause distribution, p95 and p99 latency, throughput, CPU, memory, and correctness. The main tradeoff is that aggressive object reuse can add complexity or unsafe shared state, so simple allocation reductions are usually safer.

When would you consider moving from G1 to ZGC or Shenandoah?

I would consider it only when the Java backend still misses its pause target after allocation churn, retained objects, and heap headroom have been addressed, and the remaining evidence shows that collector pause behavior is the limiting factor. I would test the candidate collector with the same warmed traffic mix, concurrency, payloads, data shape, and memory limits. I would compare pause distribution, p95 and p99 latency, throughput, CPU, memory footprint, and errors. The main tradeoff is that a low pause collector may use more CPU, behave differently across Java versions and heap sizes, and add operational complexity. I would use a controlled rollout and continue monitoring the same metrics.

More questions load as you scroll

Disclaimer: This interview guide is for educational and informational purposes only. It is designed to help readers prepare, but it does not guarantee any interview result, hiring decision, offer, or outcome. Interview questions, hiring criteria, and preferred answers can vary by employer, interviewer, industry, location, and time. The examples and explanations reflect the authors' research and judgment, are provided without warranties of any kind, and should not be treated as the only correct approach. Diagrams are simplified illustrations intended to highlight the main components and their interactions; actual systems and implementations may be more complex. Alternative approaches may be equally valid or better suited to a particular question, context, or interviewer. To the fullest extent permitted by applicable law, the author, contributors, and publisher are not liable for decisions made, actions taken, or losses incurred based on this guide.