This interview guide is for educational and informational purposes only. It is designed to help readers prepare, but it does not guarantee any interview result, hiring decision, offer, or outcome. Interview questions, hiring criteria, and preferred answers can vary by employer, interviewer, industry, location, and time. All answers, examples, and explanations in this guide are suggested examples for interview preparation, not definitive answers or instructions for professional practice. They are based on research and judgment, are provided without warranties of any kind, and should be adapted to the question, role, and applicable laws and professional requirements. Diagrams are simplified illustrations intended to highlight the main concepts and their relationships; actual situations, systems, and practices may be more complex. Alternative approaches may be equally valid or better suited to a particular question, context, or interviewer. To the fullest extent permitted by applicable law, the contributors and publisher are not liable for decisions made, actions taken, or losses incurred based on this guide.
State Laws and Professional Responsibilities
Laws and requirements governing an occupation vary by state and jurisdiction. You are responsible for checking the current laws, licensing requirements, and scope-of-practice rules that apply to your location and role, and for ensuring that your answers and actions comply with them. Adapt examples in this guide to those requirements. This guide is not legal advice.
Identity, Image, and Privacy Notice
To respect individual privacy, some names, profile photographs, avatars, biographical details, and other identifying information displayed in this guide may be replaced with pseudonyms, licensed stock images, illustrative avatars, composite images, or representative descriptions. Unless a person is expressly identified as an actual contributor, a displayed name, image, or profile should not be understood as depicting or identifying a specific candidate, interviewer, employee, or other real individual. These representations are provided for editorial and illustrative purposes only and do not imply endorsement, employment, participation, or affiliation with this guide or any company mentioned in it. Any resemblance to an actual person is coincidental.
Company Notice
This guide is an independent educational resource and is not affiliated with, endorsed by, sponsored by, or approved by the company named in this guide. Company names identify reported interview experiences or the employer context of clearly labeled original practice exercises. Interview practices can change without notice, and inclusion of company-specific content does not mean these questions are official, complete, or guaranteed to be asked. To the fullest extent permitted by law, the author, contributors, and publisher are not responsible for outcomes related to use of this material.
Content Accuracy and Verification
To the fullest extent permitted by applicable law, we do not represent or warrant that interview guides, questions, answers, examples, or diagrams are accurate, complete, current, error-free, or suitable for any particular purpose. You are responsible for independently reviewing and verifying the information before relying on it.
Questions or comments?
Contact us for general questions, or share feedback, technical corrections, and comments with the community.
111. How do you measure whether object allocation is hurting throughput?PerformanceHard
i Question Details
Describe how you would observe allocation rate, GC activity, and throughput impact in a Java service.
Short Interview Answer (30-60 seconds)
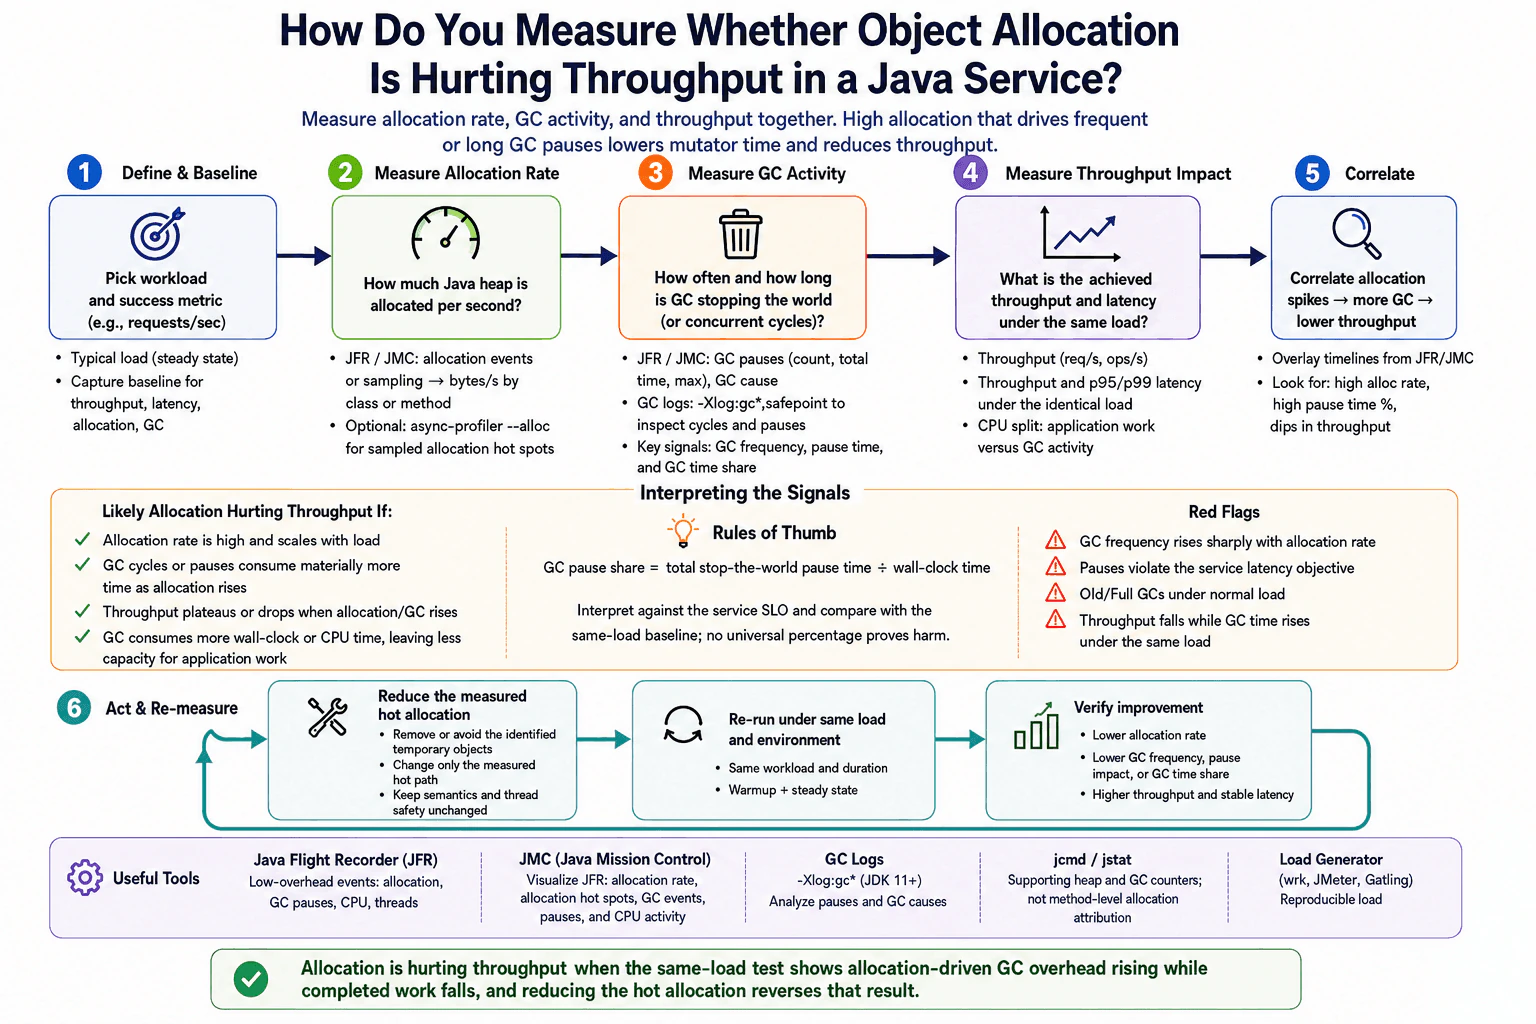
I would establish a representative load and record a baseline for throughput, p95 and p99 latency, allocation rate, garbage collection frequency, pause impact, garbage collection time share, processor use, and errors. I would use Java Flight Recorder with Java Mission Control, garbage collection logs, and async profiler allocation sampling to find the classes and methods creating temporary objects. I would align the timelines and check whether higher allocation causes more garbage collection work while completed throughput falls. I would then reduce only the measured hot allocation and repeat the identical test. The change is successful only when allocation and garbage collection overhead fall, throughput improves, latency remains acceptable, and behavior stays correct.
Detailed Explanation
This question asks how to prove that creating many temporary objects is reducing the useful work completed by a Java service. The correct approach is to test one realistic workload, record how much work finishes, observe how quickly new memory is created, and watch how much time and processor capacity are used to reclaim that memory. A high creation rate alone does not prove a problem. It becomes important when cleanup activity increases, completed work falls, response time becomes worse, or the service has less capacity for normal application work.
Useful Questions to Ask the Interviewer
Which Java service workload should I test?
Is the main success metric requests per second, operations per second, latency, or a combination?
Which Java version and garbage collector are being used?
Can I enable Java Flight Recorder and garbage collection logs during a representative test?
Is there an existing production symptom or only a suspected allocation hot spot?
How to Explain It in an Interview
I would begin by defining one representative workload and one measurement boundary. The boundary starts when the service accepts work and ends when that work completes. I would keep traffic mix, payload size, data volume, dependency behavior, Java version, garbage collector, heap settings, test duration, and warmup consistent.
First, I would capture a baseline. I would measure completed requests or operations per second, p95 and p99 latency, error rate, processor use, allocation rate, garbage collection frequency, pause duration, total pause share, and total garbage collection time share. Pause share is the total stop the world pause time divided by wall clock time. It is only one signal because a concurrent collector can also consume processor capacity outside pauses.
Next, I would measure allocation. Java Flight Recorder can capture allocation events or samples. Java Mission Control can show allocation rate and help identify classes and methods that create many objects. Async profiler allocation sampling can provide another view of hot allocation paths. Sampling has practical overhead and may miss short events, so I would use it as supporting evidence rather than complete proof.
I would inspect garbage collection activity with Java Flight Recorder and garbage collection logs. I would look at collection frequency, pause duration, concurrent cycles, collection causes, and the amount of processor or wall clock time spent in garbage collection. Jcmd and jstat can provide supporting heap and garbage collection counters, but they do not provide method level allocation attribution.
Then I would correlate the signals on the same timeline. The important pattern is that allocation rises, garbage collection becomes more frequent or consumes more time, and completed throughput falls under the same load. Latency may also become worse. High allocation is not automatically harmful when garbage collection remains cheap and throughput stays stable. There is no universal pause percentage that proves allocation is the cause. The result must be interpreted against the service objective and the same load baseline.
If the evidence identifies one hot allocation path, I would make one limited change. I would remove or avoid the identified temporary objects in that path while keeping behavior, object ownership, and thread safety unchanged. I would avoid broad object pooling because it can increase retained memory, shared state, contention, and maintenance cost.
After the change, I would repeat the same workload, duration, warmup, heap settings, and dependencies. I would compare allocation rate, garbage collection frequency, pause impact, garbage collection time share, throughput, p95 and p99 latency, processor use, memory use, and errors. I would also verify that responses and business behavior remain correct.
Finally, I would check whether the bottleneck moved. Lower allocation may expose processor saturation, database limits, network delays, connection pool waits, lock contention, or queue buildup. After deployment, I would continue monitoring the same allocation, garbage collection, throughput, latency, error, and saturation metrics.
Technical Approach
Choose one representative Java service workload and define the success metric.
Warm up the JVM and capture a baseline under stable load.
Record throughput, p95 and p99 latency, errors, processor use, allocation rate, garbage collection frequency, pause impact, and garbage collection time share.
Use Java Flight Recorder with Java Mission Control to inspect allocation events, garbage collection events, pauses, and processor activity.
Use async profiler allocation sampling when class or method hot spots need another view.
Use garbage collection logs to inspect cycles, causes, pauses, and overall collection behavior.
Align the measurements and look for allocation growth followed by more garbage collection work and lower completed throughput under the same load.
Confirm the exact hot allocation path by class and method.
Remove or avoid only the measured temporary allocations while keeping behavior and thread safety unchanged.
Repeat the identical workload after the same warmup.
Verify correctness and check whether the bottleneck moved to another resource.
Monitor the same metrics after deployment.
Practical Insights
The investigation has measurement cost. Java Flight Recorder is designed for low practical overhead, but recording more events can use additional processor time, memory, and storage. Allocation sampling also adds overhead and can miss very short events. Garbage collection logs require storage and analysis. A representative load test consumes application and dependency capacity, so it should run within safe limits. Reducing temporary objects can lower garbage collection work, but object reuse can increase retained memory, shared state, contention, thread safety risk, and maintenance effort. The optimization is worthwhile only when the measured allocation path materially affects completed work.
Why Interviewers Ask This
Interviewers ask this question to test whether a candidate can prove a Java performance problem instead of guessing. They want to see whether the candidate can measure allocation rate, garbage collection activity, completed work, and latency under the same workload. The question also tests correct profiler selection, safe interpretation of JVM evidence, targeted optimization, correctness checks, and production validation.
Common interview mistakes
Common mistakes include treating a high allocation rate as proof of poor throughput, changing code before recording a baseline, comparing different traffic levels, skipping JVM warmup, and using only average latency. Another mistake is measuring only stop the world pauses while ignoring concurrent garbage collection processor use. Native memory tracking should not be treated as a method level heap allocation profiler. A single profiler sample or a microbenchmark does not prove whole service impact. Broad object pooling can add retained memory, shared state, contention, and thread safety problems. Candidates also forget to verify correctness, repeat the same workload, or check whether the bottleneck moved to a database, network dependency, lock, queue, or processor limit.
Interview tip
Present the answer as a proof chain. Establish the same load baseline, connect allocation growth to increased garbage collection work, connect that work to reduced completed throughput, change one measured hot allocation, and repeat the identical test. State clearly that high allocation alone does not prove harm.
Interviewer may ask next
What if the allocation rate is high but throughput and latency remain stable?
Then allocation is not proven to be the current throughput bottleneck for that Java service workload. I would check whether garbage collection frequency, pause impact, garbage collection time share, processor use, and completed work remain stable within the same measurement boundary. High allocation may reduce future capacity, but I would not change the hot path until evidence shows a meaningful service impact.
How would you validate the allocation reduction after deployment?
I would use a staged release and compare equivalent production traffic for the same service boundary. I would monitor allocation rate, garbage collection frequency, pause impact, garbage collection time share, throughput, p95 and p99 latency, processor use, memory use, and errors. I would also verify response and business correctness. Production traffic is less controlled than a load test, so I would require repeated evidence and check that the bottleneck did not move to a database, network dependency, lock, queue, or processor limit.
112. When would you choose concurrent structures over synchronized code for performance?PerformanceHard
i Question Details
Explain the measurement-driven tradeoffs between built-in synchronization and concurrent data structures.
Short Interview Answer (30-60 seconds)
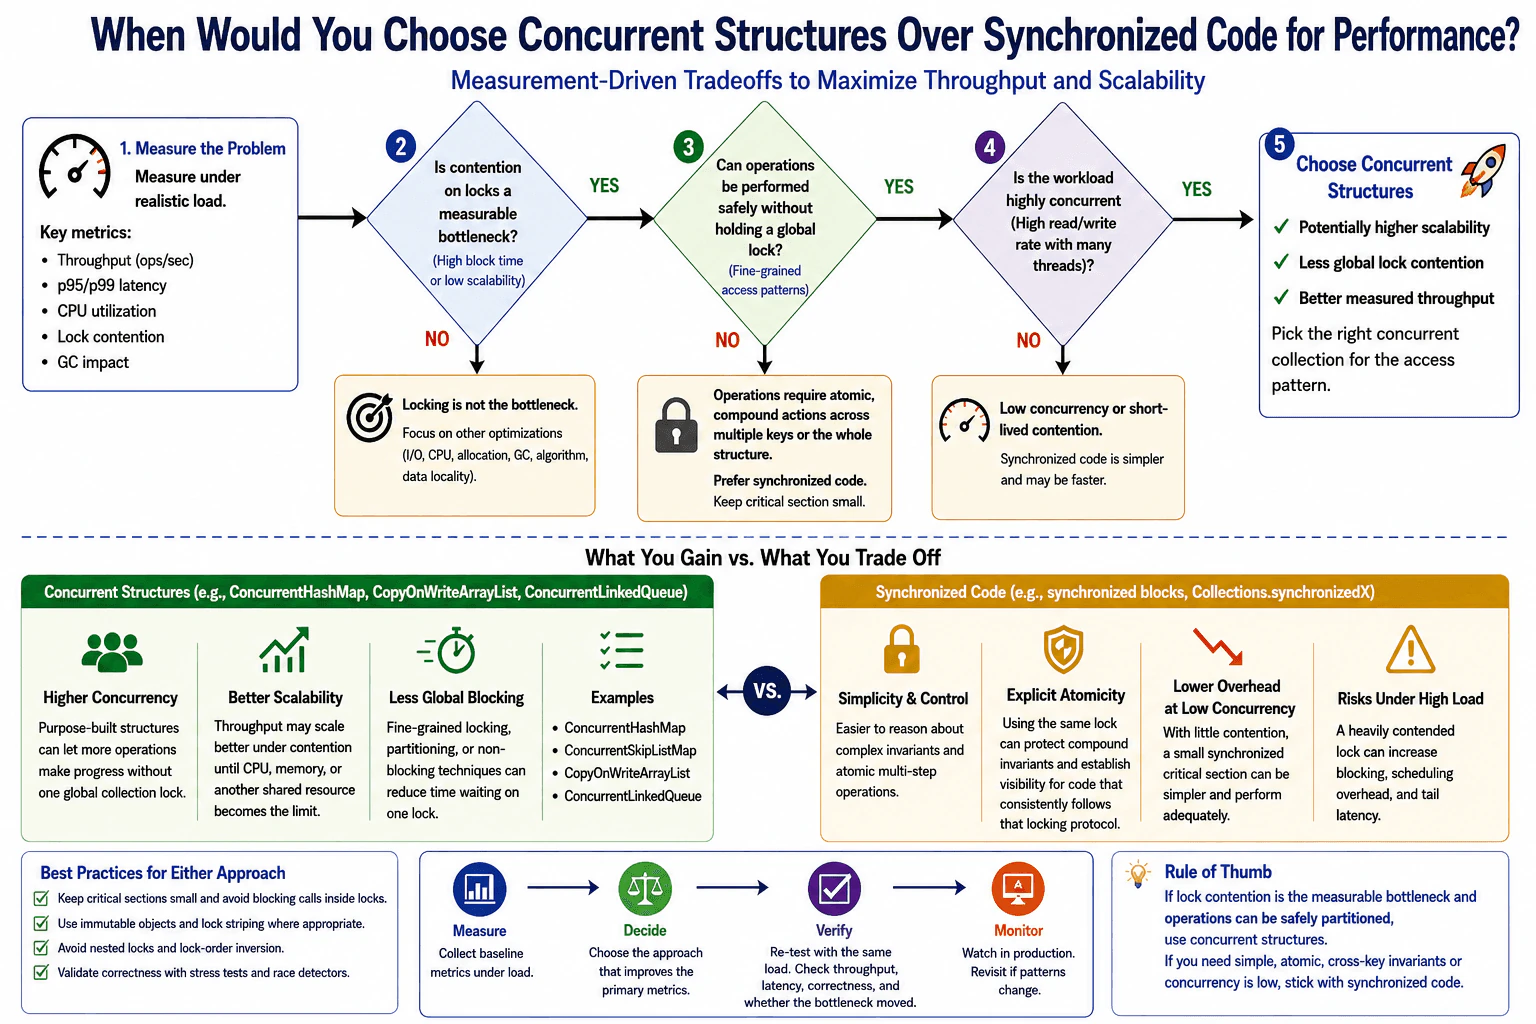
I would choose a concurrent structure when measurements under realistic load show that one shared lock is limiting throughput or increasing latency, and the operations can safely make progress without holding that global lock. For example, ConcurrentHashMap can help when many threads access mostly independent keys. I would keep synchronized code when contention is low, the critical section is small, or one lock must protect a compound rule across several values. I would then retest with the same workload and verify throughput, latency, correctness, and whether the bottleneck moved.
Detailed Explanation
This question asks when a Java program should use a collection designed for many threads instead of protecting shared data with one lock. The goal is not to choose the more advanced option. The goal is to choose the simplest correct option that performs well for the real workload. The decision depends on how many threads use the data, how often they read or update it, whether they access separate items, and whether several actions must happen together.
Useful Questions to Ask the Interviewer
What shared data structure is protected today?
How many threads access it during normal and peak load?
Is the workload mostly reads, mostly writes, or a balanced mix?
Do operations usually touch independent keys or the whole structure?
Must several operations happen as one atomic action?
Which metric is failing, such as throughput, p95 latency, or blocked thread time?
How will correctness be tested after the change?
How to Explain It in an Interview
Start by measuring the current synchronized implementation under representative load. Record throughput, p95 or p99 latency, CPU use, garbage collection activity, blocked thread time, and lock contention. The measurement boundary should include the code that accesses the shared structure, while separating database time, network time, queue delay, and other dependency waits. A slow request alone does not prove that the lock is the cause.
If the evidence shows that many threads spend meaningful time waiting for the same lock, inspect the access pattern. Concurrent structures are useful when operations can proceed on separate keys, buckets, or queue positions without one global collection lock. ConcurrentHashMap supports concurrent access to shared keys and values. ConcurrentLinkedQueue supports concurrent queue operations. ConcurrentSkipListMap supports sorted concurrent access. CopyOnWriteArrayList is useful when reads are very frequent and writes are rare.
These structures can reduce global blocking through internal partitioning, finer locking, or nonblocking techniques. This can improve measured throughput and tail latency under contention. The improvement is not unlimited. CPU, memory, garbage collection, cache effects, connection limits, or another shared resource can become the next bottleneck.
Keep synchronized code when contention is low and the protected section is small. It is often easier to reason about and may perform adequately. It is also appropriate when one lock must protect a compound invariant across several keys or the whole structure. A concurrent collection does not automatically make a sequence such as check, read, update, and write atomic. Methods such as compute, merge, putIfAbsent, and replace can provide atomic operations for one key when their behavior matches the required rule. An external lock may still be needed when one rule spans several values.
After choosing a concurrent structure, test correctness under concurrency. Check for lost updates, duplicate work, race conditions, incorrect ordering, invalid compound state, and unexpected iteration behavior. Some concurrent iterators are weakly consistent. They can continue while updates happen, but they do not promise one exact snapshot in time.
Retest with the same traffic mix, thread count, payload size, data size, warmup, and dependency behavior. Compare throughput, latency, CPU use, blocked thread time, garbage collection, errors, and resource saturation. Confirm that the original lock bottleneck was reduced rather than moved to CPU, memory, a connection pool, or another dependency. Monitor the same metrics after deployment and revisit the decision when the workload changes.
Technical Approach
Define the failing metric, such as low throughput, high p95 latency, or excessive blocked thread time.
Capture a baseline from the synchronized implementation under representative load.
Separate lock waiting from CPU work, garbage collection, database time, network time, queue delay, and other dependency waits.
Confirm that synchronization is a measurable bottleneck rather than assuming it is the cause.
Study the access pattern, including the read and write ratio, number of threads, independent key access, iteration needs, ordering needs, and compound atomic operations.
Keep synchronized code when contention is low, the critical section is small, or one lock must protect a complex invariant.
Choose a matching concurrent structure when many operations can proceed independently and lock contention limits throughput or latency.
Use atomic collection methods when they express the required operation correctly.
Test the changed implementation for races, lost updates, duplicate work, ordering errors, iteration behavior, and invariant violations.
Retest with the same workload and compare throughput, latency, CPU use, blocked threads, garbage collection, errors, and saturation.
Check whether the bottleneck moved to CPU, memory, a connection pool, or another dependency.
Monitor the same measurements after deployment and revisit the choice if the workload changes.
Practical Insights
The cost depends on the selected structure and access pattern. Synchronized code may use one lock, so the design is simple, but many threads can wait when contention is high. That waiting can increase latency and scheduling work. A concurrent structure may use more internal state, memory, atomic operations, or coordination so more operations can make progress at the same time. CopyOnWriteArrayList makes reads simple, but each write copies the backing array, so frequent writes can use significant CPU and memory. ConcurrentHashMap supports safe individual operations, but a compound rule across several keys may still require an external lock. Measurement, load testing, correctness testing, and production monitoring also add engineering and maintenance cost.
Why Interviewers Ask This
Interviewers ask this question to see whether a candidate measures lock contention before changing code. They also test whether the candidate understands access patterns, atomicity, visibility, scalability, correctness, and the limits of concurrent collections. A strong answer shows that the choice depends on evidence from a realistic workload rather than an assumption that one option is always faster.
Common interview mistakes
Common mistakes include replacing synchronized code before proving that lock contention is the bottleneck, comparing different workloads before and after the change, and using average latency while ignoring p95 or p99 latency. Another mistake is assuming that every concurrent collection is lock free or always faster. Developers may choose CopyOnWriteArrayList for a workload with frequent writes, use a concurrent map with a separate check then update sequence that is not atomic, or assume that a weakly consistent iterator is a fixed snapshot. They may also remove a lock that protects a compound invariant across several keys. Other mistakes include adding unbounded concurrency, ignoring CPU and memory costs, treating one profiler sample as complete proof, and failing to check whether the bottleneck moved to a database, connection pool, queue, or another shared resource.
Interview tip
State the decision rule first. Measure contention, inspect the access pattern, choose the simplest correct structure, and verify with the same load. Give one case for concurrent structures and one case for synchronized code. Mention compound atomic operations and correctness testing so the answer does not imply that concurrent collections are an automatic performance upgrade.
Interviewer may ask next
What would you do if p95 latency is high but lock contention is low?
I would not replace the synchronized structure based on latency alone. For the same request workload, I would separate application execution from database time, network time, queue delay, garbage collection, CPU work, and pool waits. Low lock contention suggests that synchronization is probably not the main bottleneck. The next change should target the measured source of delay. Replacing the collection could add complexity without improving the failing metric.
What tradeoff would you check after replacing a synchronized map with ConcurrentHashMap?
I would first verify that operations on the shared map are still correct. ConcurrentHashMap supports safe individual operations, but a sequence across several keys is not automatically atomic. I would use methods such as compute, merge, or putIfAbsent when they match the rule, or keep an external lock when one invariant spans several values. I would then retest the same workload and compare throughput, latency, CPU use, blocked threads, memory, and errors. The main tradeoff is better progress under contention in exchange for more complex semantics and possible changes in iteration behavior.
113. How do you analyze thread pool saturation and queue buildup?PerformanceHard
i Question Details
Explain how you would inspect pool utilization, queue growth, and task wait time in a Java application.
Short Interview Answer (30-60 seconds)
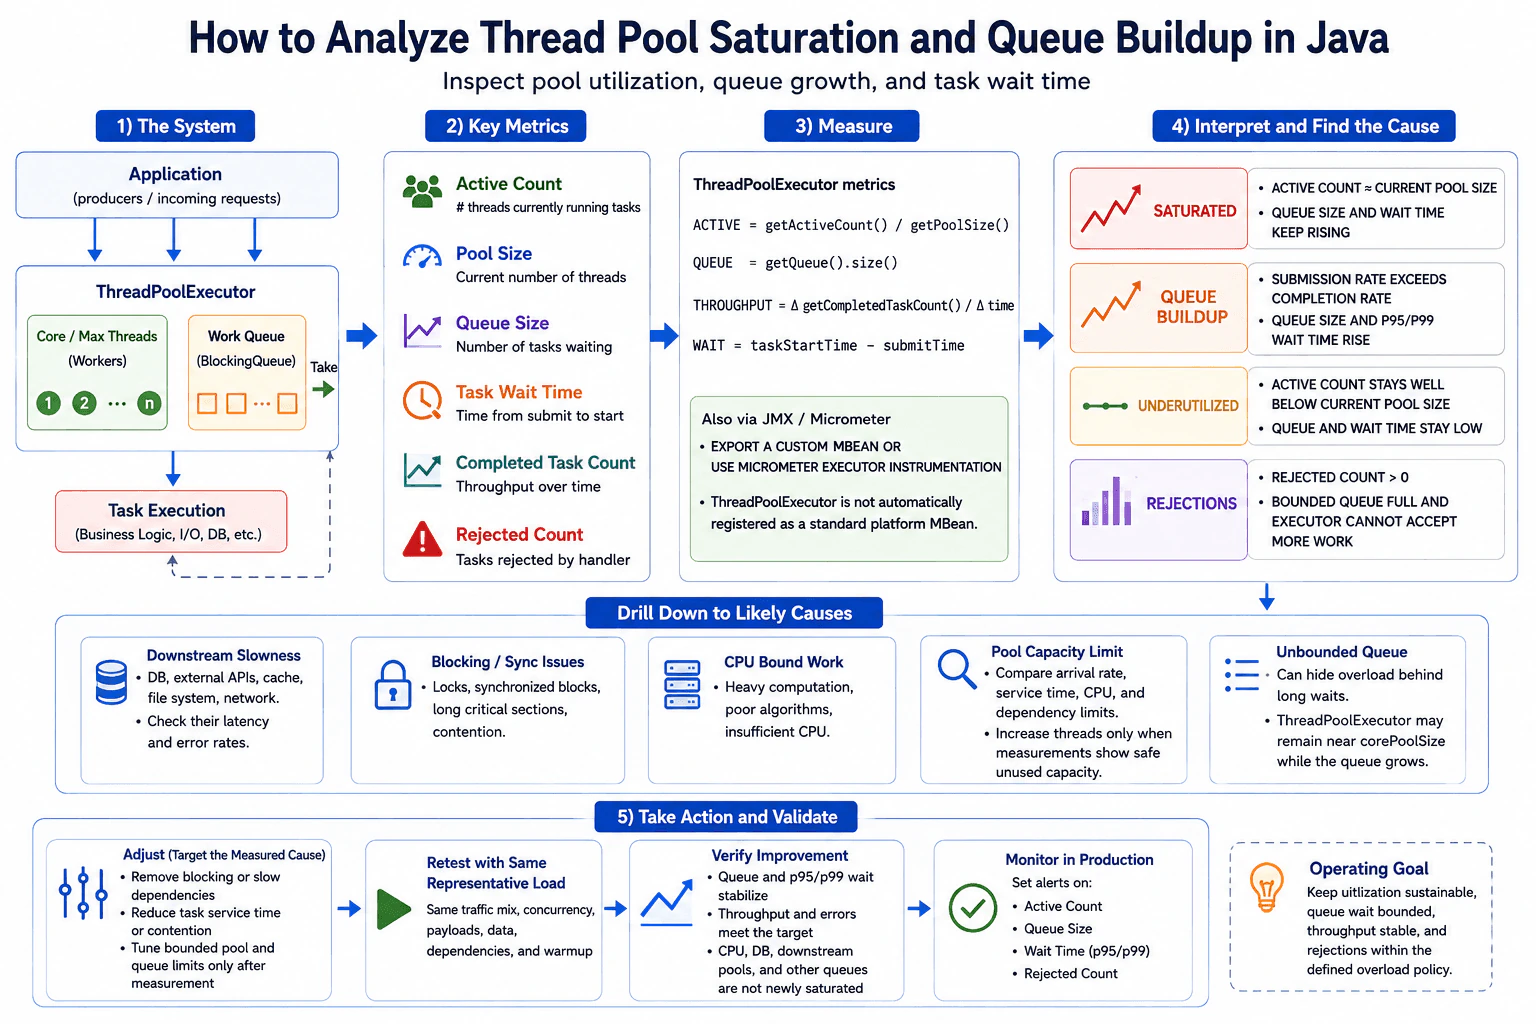
I start by measuring active count, current pool size, queue size, completed task count, rejected task count, and the time from task submission to task start. I graph those values over time under representative load. If active count stays close to the current pool size while queue size and p95 or p99 wait time keep rising, the executor is saturated. I then check whether the cause is downstream slowness, blocking calls, lock contention, CPU intensive work, limited pool capacity, or an unsuitable queue. I change only the measured cause, retest with the same load, verify correctness, and confirm that no other resource becomes saturated.
Detailed Explanation
This question asks how I would find out why work is waiting longer inside a Java application. I need to watch how many workers are busy, how much work is waiting, how quickly tasks finish, and whether new tasks are refused. I must compare these values over time because one reading can be misleading. The goal is to learn whether the executor lacks safe capacity, whether each task takes too long, or whether another resource is slowing the workers and causing the queue to grow.
Useful Questions to Ask the Interviewer
Is this executor serving user requests, background jobs, or both?
Which queue implementation and queue capacity are configured?
What are the core pool size, current pool size, and maximum pool size?
Which latency, throughput, and error targets matter?
What traffic mix, payloads, data, dependency behavior, and concurrency should the test reproduce?
Which databases, external services, locks, and resource pools can limit task progress?
How to Explain It in an Interview
I would begin with production metrics rather than changing the pool size. For the same ThreadPoolExecutor, I would record active count, current pool size, queue size, completed task count, rejected task count, task submission time, and task start time.
Task wait time is task start time minus submission time. Throughput is the change in completed task count divided by the measurement interval. I would view p95 and p99 wait time because averages can hide a small group of tasks that wait much longer.
I would graph these measurements together over time. High active count alone does not prove saturation. Stronger evidence appears when active count remains close to the current pool size while queue size and task wait time continue rising. Queue buildup means the task submission rate is greater than the task completion rate. Rejected tasks show that the executor cannot accept more work under its configured pool, queue, and rejection rules.
The measurement boundary must separate queue wait from task execution. A task can wait before a worker starts it, then spend time in business logic, database calls, external network calls, disk access, synchronized sections, lock contention, or CPU intensive computation. Executor metrics reveal the saturation symptom, but they do not prove which activity inside the task is slow.
I would export the executor measurements through Micrometer executor instrumentation or a custom MBean. ThreadPoolExecutor is not automatically registered as a standard platform MBean. I would use traces, dependency metrics, logs, Java Flight Recorder with JDK Mission Control, or a suitable sampling profiler only when each tool answers a specific question.
Distributed traces can show time spent in database and external service calls. Java Flight Recorder can help correlate thread activity, locks, CPU use, and other JVM events. A sampling profiler can help find CPU or wall clock hot paths. Sampling can miss very short events, tracing can be sampled, and instrumentation adds some overhead. I would therefore combine several signals instead of treating one tool result as complete proof.
Next, I would drill down into likely causes. Slow databases, external APIs, file systems, caches, or networks can keep workers blocked. Locks and synchronized sections can serialize tasks. Heavy computation or inefficient algorithms can consume available CPU. The pool may have insufficient capacity for the measured workload. An unbounded queue can hide overload behind long waits and may keep ThreadPoolExecutor near corePoolSize while the queue continues growing.
The change must target the measured cause. I may remove a blocking call, reduce dependency latency, shorten task service time, reduce lock contention, improve CPU intensive work, or tune a bounded pool and queue. I would increase the thread count only when CPU, memory, database connections, network capacity, and downstream services show that additional concurrency is safe. More threads can increase stack memory, scheduling work, contention, and pressure on dependencies.
I would retest with the same representative traffic mix, concurrency, payloads, data, dependency behavior, and warmup. I would compare active count, queue size, p95 and p99 wait time, throughput, errors, rejected tasks, CPU, and downstream pool use. I would verify that task outputs remain correct and that timeout, cancellation, rejection, and overload behavior still work as intended.
Finally, I would check whether the bottleneck moved to CPU, a database, a downstream executor, another queue, or an external service. After deployment, I would monitor the same measurements and alert on sustained utilization, queue growth, wait time, and rejection count. The operating goal is sustainable utilization, bounded queue wait, stable throughput, and rejection behavior that follows the defined overload policy.
Key Insight / Why This Solution Works
Identify the exact ThreadPoolExecutor and the workload it serves.
Define the symptom using queue wait, throughput, rejection count, error rate, or user visible latency.
Capture a baseline for active count, current pool size, queue size, completed task count, rejected task count, and p95 or p99 task wait time.
Reproduce the workload with representative concurrency, payloads, data, dependency behavior, and warmup.
Graph the measurements over time and compare task submission rate with task completion rate.
Treat active count near the current pool size together with rising queue size and rising wait time as evidence of saturation.
Separate queue wait from task execution time.
Inspect downstream latency, blocking calls, lock contention, CPU use, and queue behavior to identify the cause.
Apply one change that targets the measured cause.
Retest with the same workload and compare the same measurements.
Check that CPU, databases, downstream pools, and other queues are not newly saturated.
Monitor the same measurements after deployment.
Why Interviewers Ask This
Interviewers ask this question to see whether a candidate measures a concurrency problem before changing executor settings. A strong answer separates queue wait from task execution, connects worker utilization with queue growth and completion rate, and investigates downstream limits such as databases, external services, locks, and CPU. It also shows whether the candidate understands bounded capacity, rejection behavior, realistic load testing, production monitoring, and the risk of moving the bottleneck to another resource.
Common interview mistakes
Common mistakes include changing the pool size before collecting a baseline, watching only active count, using average wait time instead of p95 or p99, and confusing queue wait with task execution time. Another mistake is assuming that a Java profiler alone proves a database or network cause. Teams may also use an unbounded queue, add more threads without checking CPU and connection limits, compare tests with different workloads, ignore rejected tasks, or declare success without checking whether the bottleneck moved to a database, downstream pool, lock, CPU, or another queue.
Interview tip
Explain the investigation as one evidence chain: measure the executor, identify the trend, separate waiting from execution, find the real cause, change only that cause, and retest with the same load. Mention that adding threads can increase memory use, contention, and pressure on downstream resources.
Interviewer may ask next
What if the queue stays small but task wait time is still high?
A small queue does not rule out a concurrency problem. For the same ThreadPoolExecutor, I would first confirm that wait time is measured from submission to actual task start. I would then inspect synchronized sections, locks, worker scheduling, task handoff, and blocking work. A SynchronousQueue does not store tasks, so queue size can remain near zero while submissions wait, trigger new worker creation, or get rejected. This matters because queue size alone can hide contention or a queue strategy that has little visible storage.
Would increasing the maximum pool size solve the saturation?
Not automatically. For the measured ThreadPoolExecutor, I would increase capacity only when the evidence shows available CPU, acceptable memory cost, enough database and network capacity, and tasks that benefit from more concurrency. More threads may reduce queue wait for blocking work, but they can also increase scheduling work, stack memory, lock contention, connection pressure, and downstream saturation. I would make a bounded change, retest with the same representative load, and verify that the bottleneck did not move.
114. How would you compare caching strategies in a Java application?PerformanceHard
i Question Details
Describe how you would benchmark different caching approaches and evaluate correctness, hit rate, and latency.
Short Interview Answer (30-60 seconds)
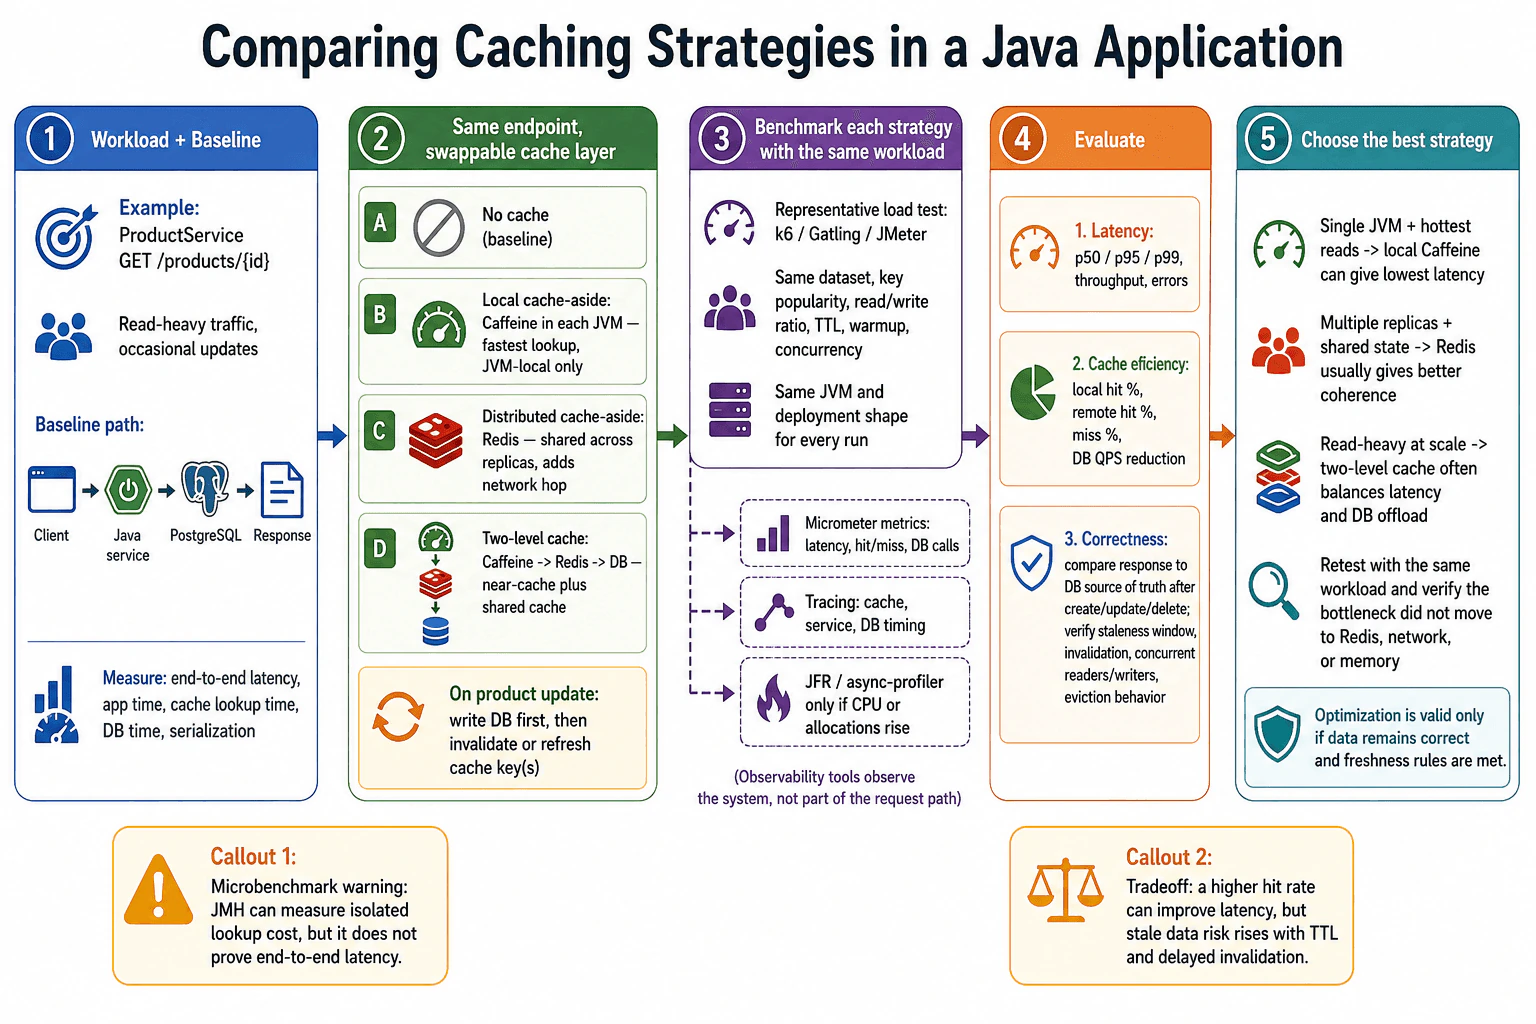
I would benchmark every strategy against the same ProductService GET /products/{id} workload. I would first record a database only baseline, then test local Caffeine, shared Redis, and a two level Caffeine plus Redis design with the same dataset, key popularity, read and write ratio, time to live value, warmup, concurrency, Java settings, and deployment shape. I would compare p50, p95, and p99 latency, throughput, errors, local and remote hit rates, misses, and database call reduction. I would also verify that responses match PostgreSQL after create, update, delete, expiry, eviction, invalidation, and concurrent access. The best strategy is the one that lowers latency and database load while preserving correctness and freshness.
Detailed Explanation
This question asks how to test several ways of storing frequently requested product data near a Java service. The goal is not only to find the fastest option. The service must still return correct product information after data changes. A fair comparison sends the same traffic to every design and measures response speed, cache use, and database work. It also checks whether old or incorrect values appear. The chosen design should match the number of Java replicas, the freshness requirement, available memory, and acceptable network cost.
Useful Questions to Ask the Interviewer
Does ProductService run in one Java process or across several replicas?
How quickly must an updated product become visible?
What traffic mix, concurrency, and data volume should the benchmark reproduce?
Are a small number of product keys much hotter than the rest?
What latency, error, and database load targets define success?
How to Explain It in an Interview
I would use one fixed workload for the complete comparison. The workload is a read heavy ProductService endpoint, GET /products/{id}, with occasional product updates. The measurement boundary begins when the client sends the request and ends when the response is returned. Within that boundary, I would separate Java service time, cache lookup time, PostgreSQL time, and response serialization time.
I would first capture a database only baseline. This control run shows p50, p95, and p99 latency, throughput, error rate, and database calls before caching changes the request path.
I would then make the cache layer replaceable and test four alternatives against the same endpoint.
The first alternative is no cache. It remains the baseline.
The second alternative is local cache aside with Caffeine inside each Java process. On a hit, the value is returned from local memory. On a miss, ProductService reads PostgreSQL and stores the result in Caffeine. This can provide the lowest lookup latency, but every Java replica owns a separate cache and may temporarily contain a different value.
The third alternative is distributed cache aside with Redis. ProductService checks Redis before PostgreSQL. Redis gives multiple replicas access to shared cached state, but each lookup adds network and serialization work.
The fourth alternative is a two level cache. ProductService checks Caffeine first, Redis second, and PostgreSQL last. A local hit avoids a network call. A Redis hit avoids a database call. This design can balance low latency with database protection, but it adds more memory use, more cache states, and more invalidation logic.
For product updates, PostgreSQL remains the source of truth. The service writes PostgreSQL first and then invalidates or refreshes the related cache key. This order matches the diagram, but it still creates a possible staleness window between the database commit and cache invalidation. The benchmark must test that window instead of assuming invalidation is immediate.
Every strategy must run under identical conditions. I would keep the dataset, key popularity, read and write ratio, time to live value, warmup period, concurrency, Java configuration, and deployment shape unchanged. I would run representative traffic with k6, Gatling, or JMeter. Warmup is important because Java compilation and cache population can distort early measurements.
I would use Micrometer metrics to record request latency, cache hits, cache misses, and database calls. I would use tracing to separate cache time, Java service time, and PostgreSQL time. If a cached design unexpectedly raises CPU use or allocation activity, I would use Java Flight Recorder or async profiler to investigate that specific evidence. These tools observe different parts of the system and should not be treated as interchangeable.
I would compare three result groups.
First, I would compare latency and capacity. This includes p50, p95, and p99 latency, throughput, and errors.
Second, I would compare cache efficiency. This includes local hit percentage, remote hit percentage, miss percentage, and reduction in PostgreSQL calls. A high hit rate is useful only when it also reduces useful work and does not return stale data.
Third, I would compare correctness. I would compare returned values with the PostgreSQL source of truth after create, update, and delete operations. I would test time to live expiry, eviction, delayed invalidation, and concurrent readers and writers. I would also check what happens when Redis is slow or unavailable, because the service must not silently return incorrect data or create an uncontrolled database surge.
The final choice depends on the workload. Local Caffeine can be best for one Java process or extremely hot reads. Redis usually fits better when several replicas need shared cached state. A two level cache can balance local speed with shared state for a read heavy service, but it has the highest operational complexity.
I would not use JMH alone to choose the production design. JMH can measure an isolated cache lookup, but it cannot prove end to end behavior with network delay, PostgreSQL access, realistic traffic, cache population, invalidation, and multiple replicas.
After choosing a strategy, I would repeat the exact same workload and compare the same metrics. I would verify that product values remain correct and that the original bottleneck was reduced rather than moved to Redis, network latency, memory use, or another dependency. After deployment, I would continue monitoring latency, errors, cache hit and miss rates, PostgreSQL calls, Redis latency, and Java memory use.
Technical Approach
Define one workload. Use ProductService GET /products/{id} with read heavy traffic and occasional updates.
Define the measurement boundary. Measure client latency, Java service time, cache lookup time, PostgreSQL time, and serialization time.
Capture the database only baseline. Record p50, p95, p99, throughput, errors, and PostgreSQL calls.
Make the cache layer replaceable. Test no cache, local Caffeine, shared Redis, and two level Caffeine plus Redis.
Keep the benchmark fair. Use the same dataset, key popularity, read and write ratio, time to live value, warmup, concurrency, Java settings, and deployment shape.
Run representative load with k6, Gatling, or JMeter.
Collect Micrometer metrics for latency, hits, misses, and PostgreSQL calls.
Use tracing to separate cache, Java service, and PostgreSQL timing.
Use Java Flight Recorder or async profiler only when CPU or allocation evidence requires deeper analysis.
Compare p50, p95, p99, throughput, errors, local hit percentage, remote hit percentage, miss percentage, and PostgreSQL call reduction.
Validate create, update, delete, expiry, eviction, delayed invalidation, and concurrent access against PostgreSQL.
Test slow or unavailable Redis behavior and watch for uncontrolled PostgreSQL load.
Select the strategy that best matches replica count, latency goals, freshness rules, memory limits, and operational complexity.
Retest with the same workload and verify that the bottleneck did not move to Redis, the network, memory, or another dependency.
Monitor the same signals after deployment.
Practical Insights
A Caffeine lookup normally uses local memory, so it avoids network delay. Its cost is additional heap use in every Java process, duplicate cached values across replicas, and more difficult cross replica invalidation. A Redis lookup adds a network round trip and serialization work, but it provides shared cached state. A two level design uses both local and remote memory. It can reduce Redis and PostgreSQL calls, but it adds another lookup path, more possible stale states, and more monitoring and invalidation work. Benchmarking also has a practical cost. Larger datasets, longer warmup, higher concurrency, and repeated runs require more time and infrastructure. Tracing and profiling can add overhead, so they should be used only for the specific evidence being investigated.
Why Interviewers Ask This
Interviewers ask this question to see whether a candidate can compare cache designs with controlled evidence instead of assuming that caching is automatically faster. They are testing benchmark discipline, understanding of local and shared caches, correctness validation, latency analysis, hit rate interpretation, and awareness that an optimization can move pressure to Redis, the network, memory, or the database.
Common interview mistakes
Common mistakes include testing each strategy with different data, traffic, warmup, concurrency, or deployment settings. Another mistake is using average latency while ignoring p95 and p99. Candidates may compare a warm cache with a cold cache, report hit rate without checking freshness, or assume that a high hit rate proves success. They may forget that each Java replica has its own Caffeine entries, while Redis adds network and serialization cost. Other mistakes include using JMH as proof of service performance, treating a profiler as proof of PostgreSQL behavior, changing several variables in one run, ignoring create, update, delete, expiry, eviction, delayed invalidation, and concurrent access, and declaring success without checking whether pressure moved to Redis, the network, Java memory, or PostgreSQL.
Interview tip
Present the answer as one controlled experiment. Start with the ProductService endpoint and database only baseline. Name the four strategies, explain the identical test conditions, and compare correctness, hit rate, and latency. End by saying that the winning design depends on replica count, freshness rules, memory cost, network cost, and operational complexity. Mention that the final decision must be retested with the same workload.
Interviewer may ask next
What would you do if Caffeine gives the best p99 latency but some requests return an old product after an update?
I would not select that result as the winner because ProductService GET /products/{id} is failing the correctness requirement. I would measure the time between the PostgreSQL commit and invalidation or refresh of the Caffeine entry in every Java replica. I would test concurrent readers during that window and compare each response with PostgreSQL. If reliable cross replica invalidation is too complex, I would consider shared Redis or a two level design with a short local time to live value. The tradeoff is additional network and operational cost in exchange for stronger shared freshness control.
How would you validate a two level cache when Redis becomes slow or unavailable?
I would run the same ProductService GET /products/{id} workload while injecting Redis latency and failures. I would measure local Caffeine hits, Redis timing, misses, PostgreSQL calls, p95 and p99 latency, errors, and Java memory use. I would verify that local hits still return correct values and that Redis failures do not cause an uncontrolled surge of identical PostgreSQL requests. The service may need bounded timeouts, limited fallback work, and protection against repeated cache misses. The tradeoff is that stronger failure protection adds complexity, but it prevents the cache layer from becoming a larger production bottleneck.
115. How would you investigate database latency from a Java service?PerformanceHard
i Question Details
Explain how you would separate application time from database time and identify where latency is introduced.
Short Interview Answer (30-60 seconds)
I would first reproduce the slow Java service request with representative load and record a p95 latency baseline. Then I would trace the request from start to response and separate application work from connection pool wait, database execution or lock wait, result transfer, row mapping, and response preparation. I would combine tracing with pool metrics, query timing, slow query logs, execution plans, network metrics, and JVM profiling. I would change only the measured bottleneck, retest with the same workload and metrics, verify correctness, and confirm that the delay did not move to another resource.
Detailed Explanation
This question asks how to find the exact part of a Java service request that makes users wait. I would first measure how slow the request is and repeat it with realistic traffic and data. Then I would divide the total request time into smaller parts. This shows whether the delay happens in the Java application, while waiting for a database connection, while the database is running the query, while rows travel back, or while Java converts and prepares the result.
Useful Questions to Ask the Interviewer
Which request pattern and data size reproduce the problem?
Which latency target matters, such as p95 or p99?
Does the slowdown affect every request or only certain inputs?
Are tracing, connection pool metrics, query logs, and execution plans available?
Which correctness checks must still pass after a change?
How to Explain It in an Interview
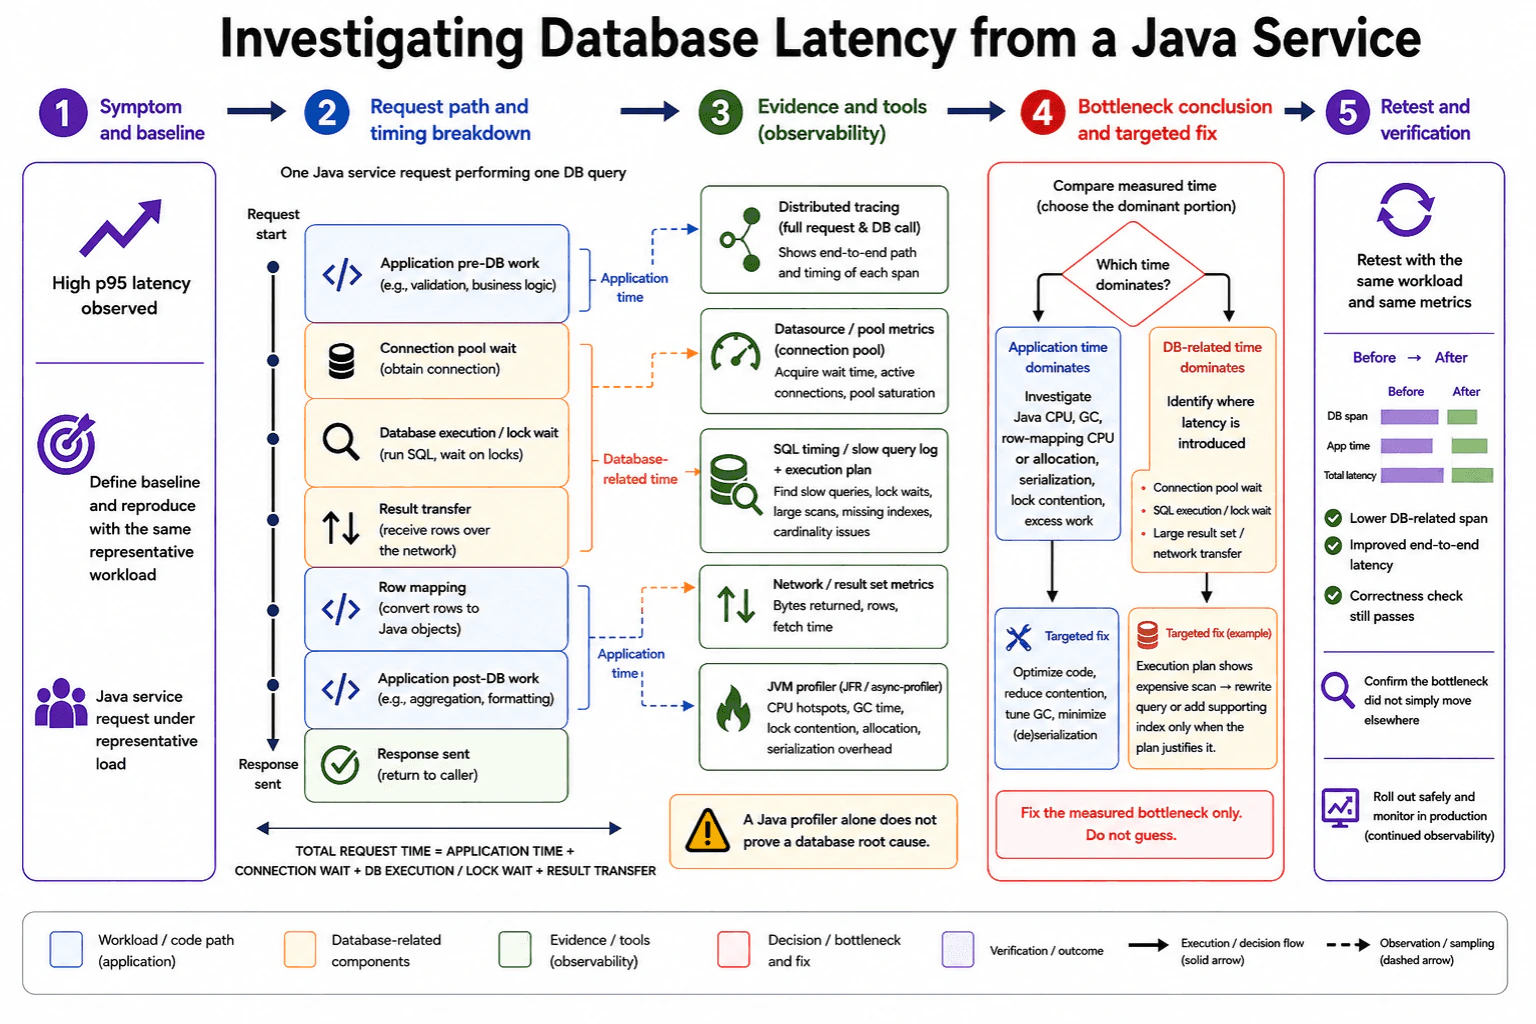
I would begin with the symptom and baseline. In this case, the symptom is high p95 latency for one Java service request that performs one database query. I would reproduce it with representative traffic, realistic data volume, normal payload size, dependency behavior, and sufficient warmup. I would record total latency, throughput, errors, connection pool saturation, query duration, rows returned, and bytes returned.
Next, I would define the measurement boundary from request start to response completion. I would separate application time from database related time.
Application time includes validation, business logic, row mapping, aggregation, formatting, serialization, Java CPU work, allocation, garbage collection, lock contention, and unnecessary application work.
Database related time includes connection pool wait, database execution, transaction or lock wait, and result transfer over the network.
I would use distributed tracing to see the full request path and the database call timing. The trace helps show whether the delay appears before connection acquisition, during the database call, during result transfer, or after rows return to Java. Tracing may be sampled, so I would combine it with metrics, logs, and database evidence instead of treating one trace as final proof.
For connection acquisition, I would inspect datasource and pool metrics. Important signals include connection acquire wait time, active connections, idle connections, queueing, saturation, and timeouts. A long acquire wait may mean the pool is exhausted, but increasing the pool is not automatically correct. The database may already be near its safe connection limit, or application code may be holding connections longer than necessary.
For database execution, I would inspect query duration, query count, slow query logs, transaction contention, lock waits, and the execution plan. The plan may reveal an expensive scan, poor join order, weak selectivity, or an index that is not useful. I would rewrite the query or add a supporting index only when the query and execution plan justify that change.
For result transfer, I would measure rows returned, bytes returned, and fetch time. A query may execute quickly but still produce high latency when it returns too much data. In that case, useful changes may include filtering earlier, returning fewer columns, pagination, or streaming. These changes target transfer volume rather than Java CPU work.
For Java side work, I would use Java Flight Recorder with JDK Mission Control or async profiler during a controlled representative run. I would inspect CPU hot spots, allocation, garbage collection, lock contention, serialization, row mapping, and post database processing. A sampling profiler can miss very short events, and a Java profiler alone cannot prove a database root cause. It only explains work that is visible inside or around the Java process.
I would then compare the measured portions. If application time dominates, I would investigate Java CPU, garbage collection, row mapping CPU or allocation, serialization, lock contention, and excess work. If database related time dominates, I would determine whether the main cause is connection wait, database execution or lock wait, or result transfer.
I would apply one change that targets the measured bottleneck. For example, if the execution plan shows an expensive scan, I may rewrite the query or add a supporting index when the plan supports that decision. If row mapping dominates, I may reduce returned columns, reduce object creation, or simplify the mapping. If connection wait dominates, I would first determine why connections remain busy before changing pool size.
Finally, I would repeat the same representative load test and compare the same metrics. I would verify that the affected timing portion and total p95 latency improve without increasing errors or damaging throughput. I would confirm that returned data and service behavior remain correct. I would also inspect Java CPU, memory, connection usage, database load, locks, and downstream latency to make sure the bottleneck did not move. After a controlled rollout, I would continue monitoring the same production metrics and alerts.
Technical Approach
Define the symptom as high p95 latency for one Java service request that performs one database query.
Record a baseline with representative traffic, realistic data, normal payloads, dependency behavior, warmup, throughput, and errors.
Measure the complete boundary from request start to response completion.
Use distributed tracing to separate application work, connection pool wait, database execution or lock wait, result transfer, row mapping, and post database work.
Inspect pool metrics for acquire wait time, active connections, saturation, queueing, and timeouts.
Inspect query duration, query count, slow query logs, transaction contention, lock waits, and the execution plan.
Inspect result transfer metrics for rows returned, bytes returned, and fetch time.
Use Java Flight Recorder with JDK Mission Control or async profiler for Java CPU, allocation, garbage collection, locks, serialization, row mapping, and excess work.
Compare the measured portions and identify the dominant source of latency.
Apply one targeted change that addresses that measured source.
Retest with the same representative workload and the same metrics.
Verify correctness, confirm that latency improved, check whether the bottleneck moved, and monitor the controlled rollout.
Practical Insights
The main cost of this approach is measurement overhead and investigation time rather than algorithmic complexity. Tracing and application metrics use some CPU, memory, network bandwidth, and storage. Query logging may add database and log volume. Java Flight Recorder and sampling profilers are usually suitable for controlled or production observation, but they still have overhead and visibility limits. A realistic load test consumes Java service capacity, database connections, database resources, and network bandwidth. The final change may introduce tradeoffs such as more index storage, slower writes, more memory use, additional database connections, or greater maintenance complexity.
Why Interviewers Ask This
Interviewers ask this question to test whether a candidate can measure a complete request before changing code. They want to see whether the candidate can separate Java application work from connection pool wait, database execution, lock wait, and result transfer. They also evaluate tool selection, evidence based diagnosis, production awareness, and the ability to verify that a targeted change improves latency without breaking correctness or moving the bottleneck elsewhere.
Common interview mistakes
Common mistakes include optimizing before measuring, using average latency instead of p95 or p99, testing with unrealistic traffic or data, and comparing different workloads before and after a change. Another mistake is treating database time as one single block and ignoring connection pool wait, execution time, lock wait, result transfer, and Java row mapping. Candidates may increase the connection pool without checking database capacity, suggest an index without reading the execution plan, or treat a Java profiler as proof of a database problem. They may also ignore large result sets, query count, profiler limitations, correctness checks, and the possibility that the bottleneck moves to another resource.
Interview tip
Explain the request as a measured timeline. Name each timing boundary, state which tool measures it, and propose one change only after the evidence identifies the dominant portion. End by saying that you will retest with the same representative workload, verify correctness, and check whether the bottleneck moved.
Interviewer may ask next
What would you investigate if the database execution span is short but the Java service still has high p95 latency?
I would not conclude that database execution is the cause. For the same Java service request, I would inspect connection pool wait, result transfer, row mapping, serialization, request queueing, Java CPU, allocation, garbage collection, lock contention, and post database work. Distributed tracing would show the timing boundaries, while pool metrics, network metrics, Java Flight Recorder, or async profiler would explain the suspected portion. This matters because a fast query can still return many rows, wait for a connection, or create expensive Java object mapping. The main tradeoff is that deeper instrumentation adds overhead, so I would use representative sampling and confirm the conclusion with several signals.
How would you validate and roll out an index or query change after finding an expensive scan?
I would validate the change with the same query, data distribution, and representative Java service workload. I would compare the execution plan, query duration, result correctness, p95 latency, throughput, errors, connection usage, database CPU, locks, and write cost. Then I would use a controlled rollout and monitor the same metrics. This matters because an index can improve reads while increasing storage use and the cost of inserts or updates. I would also verify that reducing database execution time did not move the bottleneck to result transfer, row mapping, Java memory, or another dependency.
116. How do you tune JSON or serialization throughput in Java?PerformanceHard
i Question Details
Explain how you would measure serialization cost and compare implementation choices for throughput.
Short Interview Answer (30-60 seconds)
I would first isolate the conversion from the completed OrderSummary DTO to UTF 8 JSON bytes. I would compare every option with the same DTO, payload size, JVM setup, warmup, and concurrency. JMH can compare operations per second and allocations per operation. JFR or async profiler can show CPU and allocation hot spots. I would compare per call ObjectMapper work, a reused ObjectWriter writing directly to an OutputStream, and JsonGenerator streaming. For this endpoint, I would usually select the reused ObjectWriter, then retest the full request and verify that the JSON output remains correct.
Detailed Explanation
The service receives a request for an order and sends the order details back in a structured text response. The problem is that the number of completed requests stops increasing while processor use rises. I would first measure only the work that changes the completed order data into response bytes. I would compare several ways of doing that work under the same conditions. After selecting the better option, I would test the whole request again and confirm that the returned information has not changed.
Useful Questions to Ask the Interviewer
What payload sizes are common, and what is the largest expected payload?
Is the main symptom low throughput, high CPU use, high allocation, or slow response time?
Must the field order remain stable, or is equivalent JSON acceptable?
Does the framework write directly to an OutputStream, or does it require a byte array?
What traffic level, concurrency, and warmup should the test reproduce?
How to Explain It in an Interview
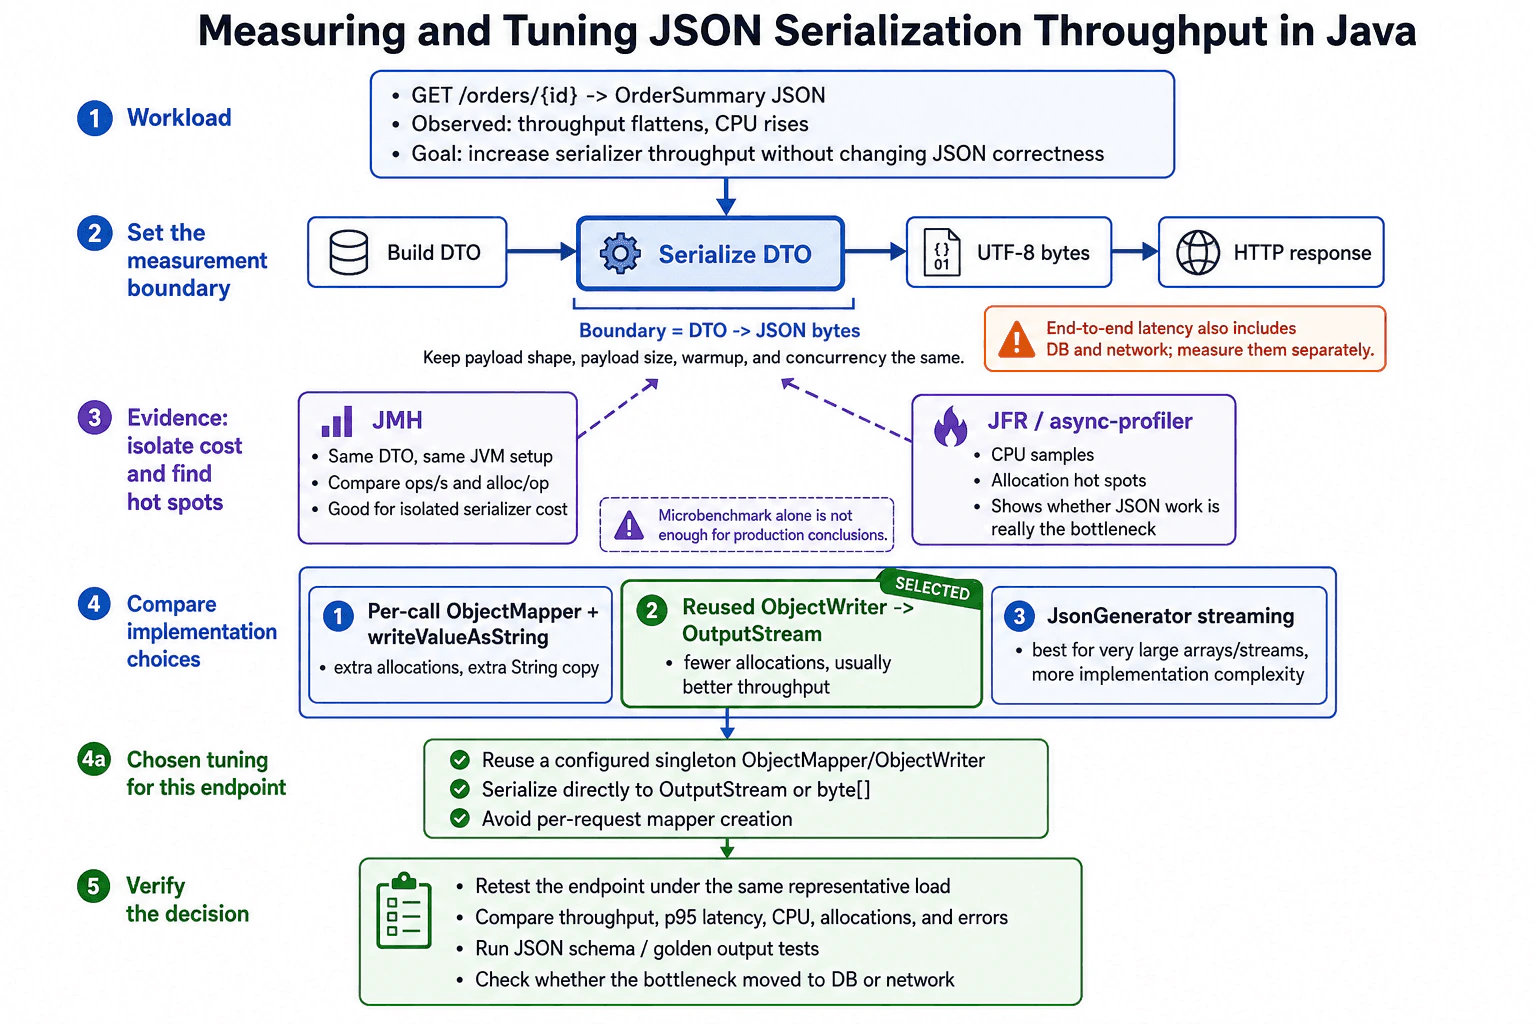
I would start with the exact workload. The endpoint is GET /orders/{id}. It builds an OrderSummary DTO and returns JSON. The observed symptom is that throughput flattens while CPU use rises. The success condition is higher serializer throughput without changing JSON correctness, increasing errors, or making p95 latency worse.
Next, I would define the measurement boundary. The isolated boundary starts with a completed OrderSummary DTO and ends with UTF 8 JSON bytes. DTO construction, database access, business logic, HTTP response handling, and network transfer are outside this isolated boundary. They still affect the complete request, so I would measure them separately before blaming serialization.
Every implementation comparison must use the same DTO shape, payload size, JVM configuration, garbage collector, warmup period, and concurrency. JVM warmup matters because JIT compilation can make early measurements misleading.
I would use JMH to measure the isolated serialization cost. I would compare operations per second and allocations per operation. Each benchmark would serialize the same DTO and produce equivalent JSON. JMH is useful for this narrow comparison, but a microbenchmark alone is not proof of a production improvement.
I would also use JFR with JDK Mission Control or async profiler during a controlled representative run. CPU samples can show whether JSON serialization is a meaningful hot spot. Allocation profiling can show temporary Strings, byte arrays, buffers, and mapper related objects. Sampling can miss short events, so I would combine profiler evidence with application metrics and the load test.
I would compare three choices. The first choice creates or configures an ObjectMapper for each call and uses writeValueAsString. This can repeat setup work, create a complete String, and require another conversion to bytes. The second choice reuses one fully configured ObjectMapper or ObjectWriter and writes directly to an OutputStream or byte array. This usually reduces setup cost, String intermediates, and temporary allocations. The third choice uses JsonGenerator streaming. It can help with very large arrays or streams, but it requires more manual code and increases correctness and maintenance risk.
For this endpoint, I would select the reused ObjectWriter approach. I would create and configure the ObjectMapper during application startup, derive the ObjectWriter from that stable configuration, and safely reuse it across requests. I would not change the mapper configuration while requests are using it. I would write directly to the framework OutputStream when possible, or to a byte array when the framework requires bytes.
After the change, I would rerun the same representative endpoint load. I would compare throughput, p95 latency, CPU use, allocations, garbage collection, and errors. I would run JSON schema or golden output tests to confirm field names, values, null handling, date formatting, and any required field order. I would then inspect database and network timing to confirm that the limiting resource was reduced rather than moved elsewhere. I would continue monitoring the same metrics after deployment.
Technical Approach
Define the workload as GET /orders/{id} returning an OrderSummary DTO as JSON.
Record baseline throughput, p95 latency, CPU use, allocation rate, garbage collection, and errors.
Separate DTO construction, serialization, database work, HTTP handling, and network transfer.
Set the isolated measurement boundary from the completed DTO to UTF 8 JSON bytes.
Keep the DTO, payload size, JVM setup, warmup, and concurrency identical for every comparison.
Use JMH to compare operations per second and allocations per operation.
Use JFR or async profiler to identify CPU and allocation hot spots around serialization.
Compare per call ObjectMapper work, a reused ObjectWriter writing directly to an OutputStream, and JsonGenerator streaming.
Select the reused ObjectWriter when the evidence shows lower setup and allocation cost for the normal OrderSummary payload.
Retest the full endpoint under the same representative load.
Verify the response with JSON schema or golden output tests.
Check whether the limiting resource moved to the database, network, memory, or another service component.
Monitor the same metrics after deployment.
Practical Insights
Serialization must inspect and write the values included in the response. Its CPU work therefore grows with the amount of JSON produced. For an output containing n bytes, the work is normally proportional to n. Creating a complete String and then converting it to bytes can require additional memory close to the payload size and can create more garbage. Writing directly to an OutputStream can reduce temporary objects, although the web framework may still buffer some data. Reusing an ObjectWriter reduces repeated setup work. JsonGenerator can reduce memory use for very large streams, but it adds implementation and maintenance cost. Profiling and realistic load testing also require time and controlled test resources.
Why Interviewers Ask This
Interviewers ask this question to test whether a candidate measures the real cost before changing code. They want to see a clear serialization boundary, a fair comparison of implementation choices, correct use of JMH and JVM profiling tools, and awareness that an isolated benchmark does not prove a complete request improvement. They also evaluate whether the candidate preserves JSON correctness, controls the workload, understands allocation cost, and checks whether the limiting resource moves to the database, network, or another part of the service.
Common interview mistakes
Common mistakes include optimizing before measuring, creating and configuring a new ObjectMapper for every request, comparing different payloads, and skipping JVM warmup. Another mistake is treating database or network time as serialization cost. Some candidates use JMH results as proof that the complete endpoint will become faster, or treat one profiler sample as complete proof of the cause. Writing to a String before producing bytes can add avoidable allocation. Manual JsonGenerator code can introduce missing fields, different null handling, or different date formatting. Teams may also improve serialization while failing to notice that the database, network, response buffer, garbage collector, or another resource becomes the new bottleneck.
Interview tip
Present the answer as a measurement story. Name the GET /orders/{id} workload, define the OrderSummary DTO to UTF 8 JSON byte boundary, explain what JMH measures, explain what JFR or async profiler measures, compare the three implementation choices, select the reused ObjectWriter, and finish with the same load retest plus JSON correctness checks. State clearly that an isolated benchmark must be confirmed in the complete endpoint.
Interviewer may ask next
What would you do if JMH shows a large serialization improvement but GET /orders/{id} throughput does not change?
I would conclude that serialization is not the limiting resource for the complete endpoint, or that the saved serialization time is too small to change total throughput. JMH measured only the OrderSummary DTO to UTF 8 JSON byte boundary. I would use request metrics and tracing to separate database time, connection pool wait, business logic, serialization, HTTP buffering, and network time. I would also compare CPU saturation, allocation rate, garbage collection, and errors under the same load. The serializer change may still reduce CPU or memory use, but I would not claim an endpoint throughput gain without complete request evidence.
When would you choose JsonGenerator streaming instead of the reused ObjectWriter?
I would choose JsonGenerator streaming when the response contains a very large array or a stream of values that should be written incrementally instead of building the complete JSON payload in memory. I would measure the same DTO or value to UTF 8 JSON byte boundary and then verify the complete endpoint under representative load. Streaming can reduce peak memory and may begin sending data sooner, but it adds manual field writing, more complex failure handling, and a greater risk of changing field names, null behavior, date formatting, or output structure. For a normal OrderSummary response, the reused ObjectWriter remains the simpler first choice.
117. How would you design a load test to validate a Java performance fix?PerformanceHard
i Question Details
Explain how you would choose workload, metrics, duration, and success criteria for a performance validation.
Short Interview Answer (30-60 seconds)
I would treat the validation as a controlled before and after experiment. First, I would define the exact service path, the problem, the expected improvement, and measurable pass criteria. I would build a production like workload with realistic request mix, data, user behavior, concurrency, and request rate. I would run a warmed baseline, apply only the fix, and repeat the same ramp, duration, environment, and metrics. I would compare latency percentiles, throughput, errors, JVM resources, database behavior, and external calls. I would accept the fix only if every performance and correctness target passes without moving saturation elsewhere.
Detailed Explanation
This question asks how I would prove that a speed improvement still works when many people use the system together. I need to choose actions that resemble real use, decide which results matter, run the test long enough to reveal unstable behavior, and define clear pass rules before testing. I must compare the old and new versions under the same conditions. I also need to confirm that responses remain correct, data stays safe, resources recover after load, and no different part of the system becomes the new problem.
Useful Questions to Ask the Interviewer
Which Java service, endpoint, or user journey is in scope?
What problem did the fix target, and what changed?
What request mix, user count, request rate, data size, and peak load represent production?
Which latency, throughput, error, and resource targets define success?
Which database, cache, and external services are included in the measurement boundary?
How long must the service remain stable before the result is trusted?
How to Explain It in an Interview
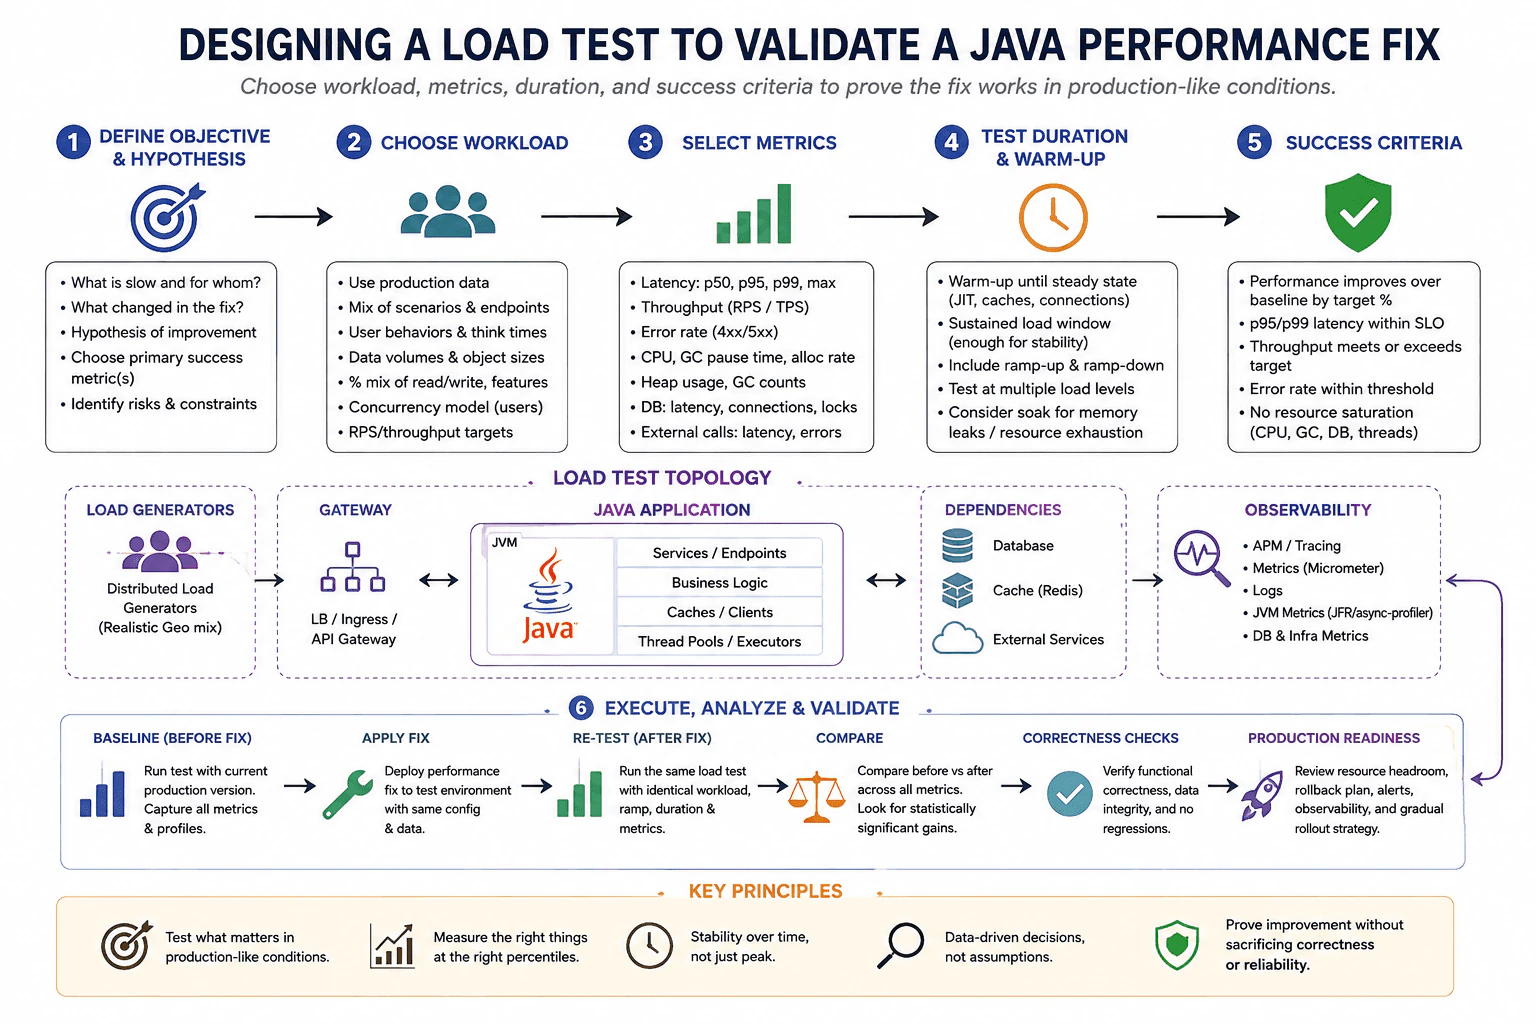
I would begin by defining the objective and hypothesis. I would state what is slow, who is affected, what changed in the Java application, and which primary metric should improve. I would also define the measurement boundary. End to end latency can include load balancer or gateway delay, Java application execution, thread pool waiting, database calls, cache calls, external service calls, and response serialization. I would not assign all delay to Java code without evidence.
Next, I would model the workload from production data. The workload should contain the real mix of scenarios and endpoints, realistic user behavior and think time, representative payload sizes, normal data volumes, read and write ratios, concurrency, and request rate. Distributed load generators may be needed when one generator cannot create the target traffic reliably. I would monitor the generators so they do not become the limiting resource.
The test environment should be isolated, repeatable, and as close to production as practical. I would match service sizing, Java version, JVM settings, garbage collector, application configuration, connection limits, and data shape. The path would include the load generators, gateway, Java application, database, cache, and external services. Observability tools would watch this path but would not be treated as business request stages.
I would run the current production version first to create the baseline. I would capture latency at p50, p95, and p99, throughput, error rate, CPU use, heap use, allocation rate, garbage collection pauses, thread pool saturation, connection pool waits, database latency, cache behavior, and external service latency. Micrometer metrics, application performance monitoring, tracing, logs, Java Flight Recorder, async profiler, and database or infrastructure metrics provide complementary evidence. A sampling profiler may miss very short events, and instrumentation may affect timing, so no single tool should be treated as complete proof.
The test should have clear phases. I would warm up until JIT compilation, caches, class loading, and connections reach steady behavior. I would then ramp traffic gradually, hold a sustained load long enough to observe stable performance, test expected peak levels, and include a soak period when memory growth or resource exhaustion is a concern. I would also ramp down and confirm that threads, connections, queues, memory, and other resources recover. A short burst alone can hide garbage collection pauses, queue growth, connection exhaustion, and gradual memory problems.
Success criteria must be written before the test. They should include the required improvement over the baseline, p95 and p99 latency limits, a throughput target, an acceptable error rate, and resource limits for CPU, heap, garbage collection, threads, connections, database capacity, and other dependencies. The criteria must also require correct responses, valid data, and no reliability regression. I would use the service level objectives and capacity plan to choose exact thresholds rather than inventing universal numbers.
After applying the performance fix, I would repeat the same workload, environment, data, warmup, ramp, duration, and measurement setup. I would compare the full baseline and fixed test windows. For noisy systems, I would repeat the runs and compare stable ranges or confidence intervals instead of selecting one favorable sample. I would check whether the original bottleneck improved and whether pressure moved to the database, cache, external services, thread pools, queues, or another resource.
I would then verify functional correctness, response content, data integrity, and regression behavior. If every predefined criterion passes, I would document the evidence and use a gradual production rollout with monitoring, alerts, and a rollback plan. I would continue watching the same latency, throughput, error, JVM, database, cache, and external service metrics after release. A realistic test costs more time and infrastructure, but it provides much stronger evidence than code inspection, one local request, or an isolated microbenchmark.
Technical Approach
Define the exact Java service path, user impact, measured problem, fix, and test boundary.
Choose the primary success metric and write a testable hypothesis.
Build a production like workload from real scenario mix, endpoint mix, user behavior, request rate, concurrency, payload size, and data volume.
Prepare an isolated and repeatable environment with matching Java version, JVM settings, application configuration, dependency limits, and seeded data.
Confirm that the load generators can create the required traffic without becoming saturated.
Run the current version as the baseline and collect latency percentiles, throughput, errors, CPU, heap, allocations, garbage collection, thread pools, connection pools, database timing, cache behavior, and external call timing.
Warm up until the JVM, caches, and connections reach steady behavior.
Ramp traffic gradually, hold sustained load, test expected peak load, and add a soak period when gradual resource problems matter.
Apply only the performance fix while keeping unrelated variables unchanged.
Repeat the same workload, environment, data, warmup, ramp, duration, and metrics.
Compare the full before and after results and repeat noisy runs when needed.
Verify functional correctness, data integrity, resource recovery, and whether the bottleneck moved elsewhere.
Accept the fix only when every predefined performance and correctness criterion passes.
Document the evidence and use a gradual rollout with monitoring, alerts, and a rollback plan.
Practical Insights
The main cost is test time and infrastructure rather than algorithmic complexity. Large tests may require several load generator machines, production like Java service capacity, realistic databases, caches, external service substitutes, and monitoring storage. Longer warmup, sustained load, peak testing, repeated runs, and soak testing consume more compute and dependency capacity. Profiling and tracing can add overhead, so they must be used carefully and interpreted with normal application metrics. The process also has maintenance cost because traffic patterns, data, service objectives, dependencies, and Java runtime behavior change over time. A smaller test costs less but may miss garbage collection pauses, memory growth, queue saturation, or dependency exhaustion.
Why Interviewers Ask This
Interviewers ask this question to see whether the candidate can prove a performance improvement through a controlled experiment instead of relying on code review or one fast local request. They are evaluating workload design, metric selection, Java runtime awareness, fair baseline comparison, correctness checks, dependency analysis, and production rollout judgment.
Common interview mistakes
Common mistakes include testing only one request, using average latency instead of p95 and p99, choosing unrealistic traffic or data, skipping JVM warmup, changing several variables between the baseline and retest, and running the test for too little time. Other mistakes include ignoring database, cache, network, queue, thread pool, and connection pool delays, treating one profiler as complete proof, and using a microbenchmark as proof of service performance. A candidate may also increase concurrency without measuring downstream limits, select only the best test interval, overlook load generator saturation, or declare success while errors, CPU, memory, garbage collection, or dependency saturation becomes worse. Skipping output and data correctness checks is another serious mistake.
Interview tip
Explain the test as a controlled experiment. State the hypothesis, workload, measurement boundary, baseline, warmup, load phases, success criteria, identical retest, correctness check, bottleneck movement check, and rollout decision. Emphasize that all important variables must remain the same before and after the fix.
Interviewer may ask next
What would you do if average latency improves but p99 latency and error rate become worse during the same load test?
I would reject the fix in its current form. For the same Java service workload and end to end measurement boundary, worse p99 latency means some requests are much slower even though the average looks better. A higher error rate also shows that the system may be failing under pressure. I would inspect time aligned JVM, thread pool, connection pool, database, cache, and external service metrics. I would also review traces, logs, and profiles from the affected periods. The tradeoff is that optimizing the common path may have harmed rare or overloaded paths, so every predefined latency, throughput, error, resource, and correctness target must pass.
How would you validate the fix safely when the test environment cannot reproduce full production traffic?
I would preserve the production workload shape, including request mix, payload sizes, data characteristics, user behavior, and measurement boundary, but run at the highest reliable scale the environment supports. I would test several load levels and identify where latency, throughput, errors, JVM resources, and dependencies begin to change. I would then use a gradual production rollout with strong monitoring, alerts, and a rollback plan to validate the remaining scale gap. The tradeoff is that reduced scale gives weaker proof about absolute capacity, so I would not claim full validation until controlled production evidence confirms the same behavior.
118. What is a unit test?TestingEasy
i Question Details
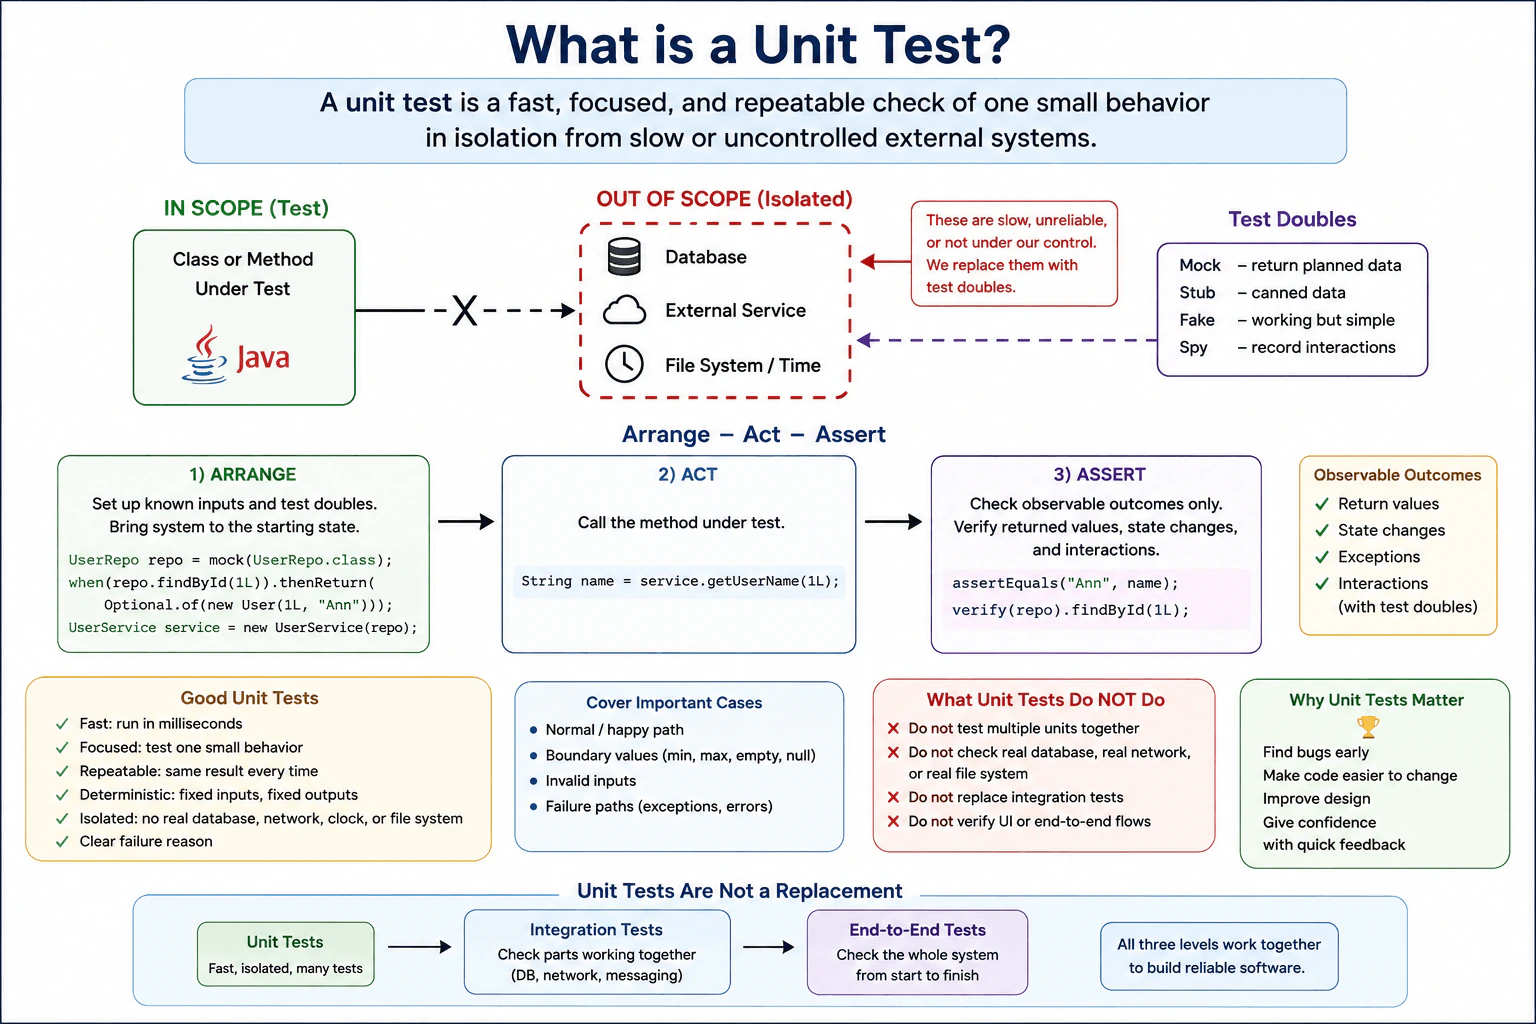
Define a unit test as a fast, focused, repeatable check of one small behavior in isolation from slow or uncontrolled external systems. Explain arrange-act-assert, observable outcomes, test doubles, deterministic inputs, boundary and failure cases, and why unit tests do not replace integration or end-to-end tests.
Short Interview Answer (30-60 seconds)
I use a unit test to check one small behavior quickly and repeatedly while keeping slow or uncontrolled external systems outside the test boundary. I arrange known inputs and test doubles, act by calling the method, and assert observable results such as a return value, state change, exception, or important interaction. The tradeoff is that this gives fast and focused feedback, but it does not prove that the real database, network, or complete application works together.
A unit test is a small check that answers one simple question about a piece of code. I give it known information, run one action, and check the result. The check should give the same result every time when the input is the same. Slow or unpredictable things outside the code are kept away from this check. I also try normal values, values at important limits, bad values, and expected failures. This gives quick feedback, but larger checks are still needed to prove that different parts work together.
Useful Questions to Ask the Interviewer
Should I explain the answer with a small Java example?
Do you want me to discuss test doubles such as mocks, stubs, fakes, and spies?
How to Explain It in an Interview
A unit test checks one small behavior, usually a method or a small class behavior. The unit under test stays inside the boundary. A real database, external service, file system, system clock, or similar uncontrolled dependency stays outside that boundary.
A common structure is Arrange, Act, Assert. During Arrange, I create deterministic inputs and put the object into a known starting state. If the class depends on something outside the boundary, I replace that dependency through an explicit boundary such as constructor injection. In the diagram example, UserService receives a UserRepo. The test can provide a Mockito replacement for UserRepo instead of calling a real database.
During Act, I call the behavior being tested once. For example, the test calls service.getUserName with a known id.
During Assert, I check an observable outcome. This can be the returned value, a visible state change, an expected exception, or an important interaction with a test double. In the example, the test checks that the returned name is Ann and can verify that the repository lookup was called with the expected id.
A stub returns controlled data. A mock can return controlled data and verify expected interactions. A fake is a small working implementation. A spy records calls and may keep real behavior. These are all forms of test doubles, but they are not identical.
Good unit tests are fast, focused, repeatable, deterministic, and isolated. Test data should be small and explicit. Fixtures should normally belong to one test or one test instance so mutable state is not accidentally shared. This example creates its objects inside the test, so no database cleanup or rollback is needed. After the method returns, the local objects can simply be discarded.
I cover the normal path, boundary values such as minimum, maximum, empty, or null when valid for the behavior, invalid inputs, and expected failure paths such as exceptions. I avoid real time, random values, network calls, and shared mutable state unless they are explicitly controlled.
The test should also run the same way in CI. I use the project Maven or Gradle wrapper and the test dependencies declared by the project. Unit tests are useful in CI because they normally finish quickly and give a clear failure close to the changed behavior.
The limitation is important. A mocked repository does not prove that UserService can communicate with the real repository implementation or database. That requires an integration test. A full user flow requires an end to end test. Unit, integration, and end to end tests therefore solve different problems and work together.
Key Insight / Why This Solution Works
Define one observable behavior to check.
Put only the class or method responsible for that behavior inside the unit test boundary.
Arrange deterministic inputs and replace slow or uncontrolled dependencies through explicit dependency injection.
Act by calling the method under test once.
Assert the observable result, such as a return value, state change, expected exception, or important dependency interaction.
Add normal, boundary, invalid input, and failure cases that belong to the same behavior.
Keep fixture state local and independent so another test cannot change the result.
Run the test with the project test command locally and in CI.
Use integration or end to end tests for behavior that depends on real components working together.
Code
importstatic org.junit.jupiter.api.Assertions.assertEquals;
importstatic org.mockito.Mockito.mock;
importstatic org.mockito.Mockito.verify;
importstatic org.mockito.Mockito.when;
import java.util.Optional;
import org.junit.jupiter.api.Test;
classUserServiceTest {
// The repository is an external boundary for this unit test.interfaceUserRepo {
Optional<User> findById(long id);
}
recordUser(long id, String name) {}
staticclassUserService {
privatefinal UserRepo repo;
UserService(UserRepo repo) {
this.repo = repo;
}
String getUserName(long id) {
return repo
.findById(id)
.map(User::name)
.orElseThrow(() -> newIllegalArgumentException("User not found"));
}
}
@TestvoidgetUserName_returnsNameFromRepository() {
// Arrange: replace the repository with a controlled test double.UserReporepo= mock(UserRepo.class);
when(repo.findById(1L)).thenReturn(Optional.of(newUser(1L, "Ann")));
UserServiceservice=newUserService(repo);
// Act: execute the one behavior being tested.Stringname= service.getUserName(1L);
// Assert: check the observable result and the important interaction.
assertEquals("Ann", name);
verify(repo).findById(1L);
// Cleanup: no action is needed because the test created only local objects.
}
}
Why Interviewers Ask This
Interviewers ask this to see whether I understand the correct boundary for a unit test. They want to know whether I can check one small behavior, isolate slow or uncontrolled dependencies, use deterministic inputs, make useful assertions, and recognize when a wider integration or end to end test is required.
Common interview mistakes
Common mistakes include calling a real database or network service in a test that is supposed to be a unit test, mocking simple value objects, mocking private implementation details, using too many mocks, sharing mutable fixtures between tests, depending on test execution order, using random or time based values without controlling them, checking weak or unrelated assertions, ignoring boundary and failure cases, and assuming that a successful mocked test proves the real integration works. Another mistake is treating high coverage as proof that the tests are useful.
Interview tip
Start with the boundary. Say what is inside the unit test and what stays outside. Then explain Arrange, Act, Assert with one small Java example. Mention deterministic inputs and test doubles, then finish by saying that unit tests are fast and focused but do not replace integration or end to end tests.
Interviewer may ask next
What would you do if this unit test sometimes passed and sometimes failed because it used the real system clock?
I would keep the clock outside the unit test boundary and inject a controllable Clock or another small time provider. The test would supply a fixed value during Arrange, call the behavior during Act, and assert the result against that known time. This matters because the same inputs should produce the same result on every run. The tradeoff is a small amount of extra design around dependency injection, but the test becomes deterministic and much easier to debug.
When would you stop using a mock for UserRepo and use a real database instead?
I would change the test level when the behavior I need to verify includes the real repository and database working together. At that point the boundary is no longer only UserService, so I would write an integration test with a controlled test database rather than calling it a unit test. That test can verify mappings, queries, constraints, and transactions. The tradeoff is greater realism with slower setup and execution, so I would keep the focused unit tests as well.
119. What is JUnit?TestingEasy
i Question Details
Define JUnit as the standard testing framework family commonly used for Java code. Explain test methods, lifecycle methods, assertions, parameterized tests, tags, extensions, test discovery and execution, and the roles of the JUnit Platform and JUnit Jupiter. Distinguish JUnit from mocking libraries and from the build tools that run tests.
Short Interview Answer (30-60 seconds)
I would use JUnit as the standard framework family for writing and running automated Java tests. With JUnit Jupiter, I can define test methods, prepare and clean up test state, make assertions, run parameterized tests, group tests with tags, and add extensions. The JUnit Platform discovers tests and coordinates execution through test engines. Mockito is separate and creates test doubles. Maven, Gradle, an IDE, or a console launcher can start a test run, but those tools are not JUnit itself.
JUnit gives Java developers a standard way to write repeatable checks for their code. A developer prepares the values needed by a test, runs some Java behavior, and checks the result. JUnit also controls when setup and cleanup code runs. One test can run with several input values. Tests can be grouped and discovered automatically. Other tools can start the test process, while the JUnit Platform and its test engines handle discovery and execution. Mocking libraries solve a different problem by replacing selected dependencies during tests.
Useful Questions to Ask the Interviewer
Are you asking about the modern JUnit Jupiter programming model and the JUnit Platform?
Would you like a small example showing lifecycle methods, assertions, parameterized tests, and tags?
How to Explain It in an Interview
JUnit is the standard testing framework family commonly used for Java code. Its practical purpose is to make automated tests easy to write, discover, execute, and report.
A test method represents one behavior that we want to check. With JUnit Jupiter, a method marked with @Test is treated as a test method. The test prepares the required state, runs the behavior, and then uses an assertion such as assertEquals, assertTrue, or assertThrows to verify the result.
Lifecycle methods control fixture setup and cleanup. @BeforeAll runs once before the tests in a class. @BeforeEach runs before each test method. @AfterEach runs after each test method. @AfterAll runs once after all tests in the class. These methods are useful for preparing reusable test state and releasing resources. Per test setup is normally safer for mutable state because one test should not affect another test.
Parameterized tests let one test method run several times with different input values. This is useful when the same behavior must be checked for several cases. In Jupiter, @ParameterizedTest defines the test and a source such as @CsvSource supplies the values.
Tags let a project classify tests. For example, @Tag("fast") can mark tests that a runner may include or exclude. Extensions add reusable behavior to Jupiter through its extension model. They can support concerns such as custom setup or integration with another testing library.
The JUnit Platform is the foundation that discovers tests and coordinates execution. A test engine runs tests that belong to its programming model. The Jupiter engine runs JUnit Jupiter tests. The diagram also shows that another engine can support older JUnit tests. JUnit Vintage is relevant only when a project has a stated legacy migration need.
JUnit Jupiter provides the programming model used to write modern JUnit tests. This includes annotations, assertions, lifecycle methods, parameterized tests, tags, and the extension model. The JUnit Platform provides discovery and execution services that IDEs, build tools, and console launchers can use.
JUnit is not a mocking library. A library such as Mockito creates mocks, stubs, spies, and other test doubles when a dependency needs to be replaced. JUnit can execute a test that uses Mockito, but the two libraries have different responsibilities.
JUnit is also not a build tool. Maven and Gradle compile the project, manage dependencies, and can start test execution through their test support. An IDE or console launcher can also start tests. These tools integrate with the JUnit Platform rather than replacing it.
For the calculator example shown in the diagram, the test boundary is the Calculator behavior. No database, network service, or external system is needed. Each test gets predictable state. The action is a calculator operation. The assertion checks the expected value. Cleanup is simple because there are no external resources. Parameterized tests cover several inputs without copying the same test logic.
In CI, the project should use its Maven or Gradle wrapper and the JUnit versions declared by the project or its dependency management. In 2026, JUnit 6 is the current generation and requires Java 17 or newer, while many maintained projects still use JUnit 5. The diagram uses the familiar JUnit 5 and Jupiter model, whose core Platform and Jupiter responsibilities remain the same conceptually. A team should not silently change the project major version just to write a test.
The important tradeoff is that JUnit provides structure and repeatability, but JUnit alone does not make a test useful. Tests still need good boundaries, deterministic data, focused assertions, isolated state, and suitable dependency choices.
Technical Approach
Define the Java behavior that the test should verify.
Choose the correct test boundary. For a simple class with no external dependencies, use a focused unit test.
Create predictable fixture state before the test. Use @BeforeEach when each test needs fresh mutable state.
Mark normal test methods with @Test. Use @ParameterizedTest when the same behavior should run with several inputs.
Execute the Java behavior under test.
Verify the observable result with focused assertions such as assertEquals, assertTrue, or assertThrows.
Use @AfterEach or @AfterAll when resources need cleanup.
Add tags when the project needs groups that runners can include or exclude.
Let the JUnit Platform discover the tests and let the appropriate test engine execute them.
Run the same tests through the project Maven or Gradle wrapper in CI so local and CI execution use the declared project dependencies.
Practical Insights
Algorithmic time complexity is not the main concern for this question. The practical cost depends on how many tests run and what each test does. A small JUnit unit test usually starts quickly and uses little memory. Parameterized tests run once for every supplied input, so more cases increase test time. Tests that start databases, servers, or external resources cost much more. Maintenance cost also matters. Small fixtures, isolated state, and focused assertions make a test suite easier to understand and keep reliable in CI.
Code
importstatic org.junit.jupiter.api.Assertions.assertEquals;
import org.junit.jupiter.api.AfterAll;
import org.junit.jupiter.api.AfterEach;
import org.junit.jupiter.api.BeforeAll;
import org.junit.jupiter.api.BeforeEach;
import org.junit.jupiter.api.Tag;
import org.junit.jupiter.api.Test;
import org.junit.jupiter.api.TestInstance;
import org.junit.jupiter.params.ParameterizedTest;
import org.junit.jupiter.params.provider.CsvSource;
@TestInstance(TestInstance.Lifecycle.PER_CLASS)classCalculatorTest {
private Calculator calculator;
@BeforeAllvoidsetUpAll() {
// This fixture action runs once before all tests in this class.
System.out.println("Starting Calculator tests");
}
@BeforeEachvoidsetUp() {
// Create fresh mutable state so each test starts independently.
calculator = newCalculator();
}
@TestvoidaddTwoNumbersReturnsSum() {
// Run the behavior under test with a small deterministic input.intresult= calculator.add(2, 3);
// Verify the observable result rather than an internal detail.
assertEquals(5, result);
}
@ParameterizedTest@CsvSource({ "1,2,3", "-1,1,0", "0,0,0" })voidaddParameterized(int a, int b, int expected) {
// Run the same behavior for several controlled input combinations.intresult= calculator.add(a, b);
// Check the expected result for the current parameter set.
assertEquals(expected, result);
}
@Tag("fast")@TestvoidsubtractNumbersReturnsDifference() {
// Run another small Calculator behavior in the same test boundary.intresult= calculator.subtract(3, 2);
// Check the public result of subtraction.
assertEquals(1, result);
}
@AfterEachvoidtearDown() {
// Release the per test fixture so no mutable state is reused.
calculator = null;
}
@AfterAllvoidtearDownAll() {
// This class scoped cleanup runs once after all tests finish.
System.out.println("Finished Calculator tests");
}
staticclassCalculator {
intadd(int a, int b) {
return a + b;
}
intsubtract(int a, int b) {
return a - b;
}
}
}
Why Interviewers Ask This
Interviewers ask this question to check whether a Java developer understands the basic structure of automated testing. They want to know whether the candidate can separate JUnit from mocking libraries and build tools. They also want to see whether the candidate understands test methods, lifecycle methods, assertions, parameterized tests, tags, extensions, test discovery, and test execution.
Common interview mistakes
A common mistake is treating JUnit, Mockito, and a build tool as the same thing. JUnit provides the testing model and execution infrastructure. Mockito creates test doubles. Maven or Gradle manages the build and can start the tests. Another mistake is sharing mutable fixture state between tests, which can make results depend on execution order. Developers also write weak assertions that only check that code did not crash. Other mistakes include testing private implementation details, using too many mocks, depending on test order, forgetting cleanup for real resources, and assuming a high coverage number proves that the tests are good.
Interview tip
Start with the separation of responsibilities. Say that Jupiter is the programming model used to write modern JUnit tests and that the JUnit Platform handles discovery and coordinates execution through test engines. Then give one small example using @Test, lifecycle methods, and an assertion. Finish by saying that Mockito is separate for test doubles and Maven or Gradle is separate for building the project and starting the test run.
Interviewer may ask next
What can make a JUnit test flaky even when the production code is correct?
The test boundary can become flaky when it depends on uncontrolled state or timing. Examples include shared mutable fixtures, the current clock, random values, network services, file state, or test execution order. For the Calculator boundary shown here, each test should create fresh state with @BeforeEach and use deterministic inputs. This matters because the same test should produce the same result locally and in CI. The tradeoff is that stronger isolation may require more setup when a real external dependency is actually part of the behavior being tested.
When would you move from a small JUnit unit test to an integration test?
I would change the test boundary when the behavior depends on real collaboration between components that a small unit test cannot prove. For example, if correctness depends on a real database mapping or communication between configured components, I would keep JUnit as the test framework but run an integration test with those selected components kept real. The tradeoff is that integration tests provide higher fidelity but usually need more setup, run more slowly, and require stronger cleanup and isolation in CI.
120. What is the difference between unit, integration, and end-to-end tests?TestingMedium
i Question Details
Explain the purpose of each test level and how they work together in a Java project.
Short Interview Answer (30-60 seconds)
I use unit tests for small business rules, integration tests for real collaboration between selected components, and end to end tests for a complete critical user journey. In this order example, the unit test isolates OrderService and replaces PaymentGateway with a stub and OrderRepository with a mock. The integration test keeps OrderController, OrderService, OrderRepository, and the PostgreSQL test database real while controlling payment with a stub. The end to end test runs the full application with a realistic payment sandbox and a production like database. I use many unit tests, fewer integration tests, and a small set of end to end tests because broader tests give more confidence but cost more time and maintenance.
Detailed Explanation
The question asks how three kinds of checks protect the same application at different depths. One check looks closely at a small rule. Another checks whether important parts work together. The last follows a complete customer action from the starting request to the saved result. Together, they give quick feedback, confidence between connected parts, and confidence in important user journeys. The main decision is how much of the real application should run in each check and which outside parts should be controlled.
Useful Questions to Ask the Interviewer
Which order path is most important to protect?
Should the payment service be real, controlled, or unavailable during the test?
Does the integration test need the real PostgreSQL engine and migrations?
Which test levels must run on every code change?
How to Explain It in an Interview
A unit test checks one small behavior in isolation. In the diagram, the system under test is OrderService.placeOrder(). OrderController is outside the unit test boundary and is not used. PaymentGateway is replaced with a stub that returns an approved payment result. OrderRepository is replaced with a mock so the test can verify save(order). The test calls placeOrder(), checks that the returned status is CONFIRMED, and verifies that the repository saved the order. This test is fast and deterministic, but it does not verify the real database contract or the real payment integration.
An integration test checks real collaboration between selected components. In this example, the test sends a valid POST /api/orders request through OrderController. OrderController, OrderService, OrderRepository, and the PostgreSQL test database are real. PaymentGateway remains a controlled stub, so the test does not depend on the external payment system. The test checks that the response is HTTP 201 Created and that the order exists in the test database. The database should use required migrations, controlled fixture data, and an isolation method such as rollback, truncation, or recreation. This test can reveal wiring, request handling, mapping, query, transaction, and persistence problems.
An end to end test checks one complete critical user journey through the running application. A realistic client calls the real application endpoint. The request passes through OrderController and OrderService. OrderService calls the realistic PaymentGateway sandbox and the real OrderRepository. OrderRepository writes to a production like PostgreSQL database. The test checks HTTP 200 OK, the returned confirmation, and the persisted order. This gives broad confidence in the critical path, but it is slower and usually needs more setup and maintenance.
The three levels work together. Unit tests catch business logic problems quickly. Integration tests show whether selected real components collaborate correctly. End to end tests protect a small number of critical user paths. Passing unit tests does not prove that the database or payment integration works. Passing end to end tests also does not replace the fast and focused feedback from unit tests.
For success cases, I test an approved payment and a saved order. For failure cases, I test payment rejection or a database failure at the level where that behavior belongs. For example, a unit test can configure the PaymentGateway stub to reject the payment and verify that save(order) is not called. A database failure that depends on a real transaction or constraint belongs in an integration test. Tests should control time, randomness, environment values, and network access so repeated runs produce the same result.
In CI, unit tests normally run on every change. Integration tests also run regularly with an isolated PostgreSQL test database. End to end tests usually run as a smaller suite because they take longer and are more sensitive to environment problems.
Technical Approach
Define the behavior being protected, such as placing an order.
Choose the smallest test level that can prove that behavior.
For a unit test, isolate OrderService, stub PaymentGateway, and mock OrderRepository.
Call OrderService.placeOrder(), assert the returned status, and verify save(order).
Add a separate unit test for payment rejection and verify that save(order) is not called.
For an integration test, keep OrderController, OrderService, OrderRepository, and the PostgreSQL test database real.
Control PaymentGateway with a stub, send POST /api/orders, check HTTP 201 Created, and verify the saved order.
Reset database state with rollback, truncation, or recreation.
For an end to end test, run the complete application with a realistic payment sandbox and a production like PostgreSQL database.
Assert HTTP 200 OK, the confirmation response, and the persisted order.
Run many unit tests, fewer integration tests, and a small set of end to end tests in CI.
Practical Insights
Algorithmic complexity does not meaningfully apply to this question. The important cost is test runtime, setup, and maintenance. Unit tests are usually very fast because they run one class with controlled dependencies. Integration tests cost more because the framework and database must start, migrations may run, and test data must be created and removed. End to end tests cost the most because the full application and realistic external boundaries must be available. A balanced suite keeps CI useful by placing most checks at the smallest reliable level.
Why Interviewers Ask This
Interviewers ask this question to see whether a candidate can choose the correct test boundary instead of using one test type for every problem. They are evaluating isolation, real component collaboration, realistic user journeys, reliability, debugging value, and CI cost. A strong answer also shows that the candidate understands when to replace a dependency with a stub or mock, when to keep a real database, and why passing one test level does not prove that every other boundary works.
Common interview mistakes
Common mistakes include calling every test a unit test, mocking the wrong dependency boundary, and treating a mocked repository as proof that database mappings or queries work. Another mistake is using stub, mock, fake, and spy as if they mean the same thing. A stub returns controlled data. A mock also verifies an expected interaction. Teams also create misleading tests when they assert only that no exception occurred, depend on test order, reuse mutable shared fixtures, connect to production data, leave database state behind, or ignore failure paths. Too many slow end to end tests can make CI expensive and difficult to debug. High coverage also does not prove that the assertions are useful.
Interview tip
Explain all three levels with one consistent order example. State the test boundary, name which dependencies are real or replaced, describe the main assertion, and finish with the tradeoff. A clear summary is many fast unit tests for logic, fewer integration tests for collaboration, and a small set of end to end tests for critical user journeys.
Interviewer may ask next
How would you test a payment failure without depending on the real payment system?
I would keep the boundary at OrderService and configure the PaymentGateway stub to return a rejected result or throw the expected gateway exception. I would call OrderService.placeOrder() and assert the visible failure behavior, such as the returned status or mapped exception. I would also verify that OrderRepository.save(order) was not called when persistence must not happen after payment failure. This matters because the unit test remains deterministic and focused. The tradeoff is that it does not verify the real payment contract, so that boundary still needs an integration or contract test.
Which tests should run on every pull request when the full end to end suite is slow?
I would run the complete unit suite and the important integration tests on every pull request because those boundaries give fast feedback on logic, wiring, database behavior, and persistence. I would also run a small end to end smoke set for the most critical order path when the environment supports it. The larger end to end suite can run on a scheduled build or before release. This keeps CI useful while still protecting the main user journey. The tradeoff is that less frequent broad testing may discover some environment problems later.
More questions load as you scroll
Disclaimer: This interview guide is for educational and informational purposes only. It is designed to help readers prepare, but it does not guarantee any interview result, hiring decision, offer, or outcome. Interview questions, hiring criteria, and preferred answers can vary by employer, interviewer, industry, location, and time. All answers, examples, and explanations in this guide are suggested examples for interview preparation, not definitive answers or instructions for professional practice. They are based on research and judgment, are provided without warranties of any kind, and should be adapted to the question, role, and applicable laws and professional requirements. Diagrams are simplified illustrations intended to highlight the main concepts and their relationships; actual situations, systems, and practices may be more complex. Alternative approaches may be equally valid or better suited to a particular question, context, or interviewer. To the fullest extent permitted by applicable law, the contributors and publisher are not liable for decisions made, actions taken, or losses incurred based on this guide.
State Laws and Professional Responsibilities: Laws and requirements governing an occupation vary by state and jurisdiction. You are responsible for checking the current laws, licensing requirements, and scope-of-practice rules that apply to your location and role, and for ensuring that your answers and actions comply with them. Adapt examples in this guide to those requirements. This guide is not legal advice.
Content Accuracy and Verification: To the fullest extent permitted by applicable law, we do not represent or warrant that interview guides, questions, answers, examples, or diagrams are accurate, complete, current, error-free, or suitable for any particular purpose. You are responsible for independently reviewing and verifying the information before relying on it.