9 Google Cloud Engineer Interview Questions & Answers

google icon

Questions with Detailed ExplanationsWith Detailed Explanations

(Last Updated: September 3, 2026)

1. How would you design a caching server?Cloud ArchitectureMediumGoogle

Question Details

Design a provider-neutral caching service used by application clients in front of an authoritative data source. Define the request and key-value contract, read and write behavior, misses, invalidation, eviction and capacity, consistency, partitioning, replication, hot-key handling, failure recovery, and observability. State assumptions rather than inventing scale.

Short Interview Answer (30-60 seconds)

At a high level, this cache server keeps frequently used data close to applications so reads stay fast. The main challenge is serving cache hits quickly while keeping misses and writes correct. I would explain three flows: reads, writes, and invalidation. Requests pass through security checks, then a stateless Cache Frontend Service talks to a sharded and replicated in-memory cluster. The Authoritative Data Sources remain the official copy. The trade-off is faster reads and better availability, but more consistency and recovery work.

Detailed Explanation

The goal is to make repeated data reads fast without replacing the official data source. Applications should usually get values from memory instead of loading them again from slower storage or services. The difficult part is keeping cached data useful when values change, nodes fail, memory fills up, or one key becomes very popular. The diagram handles this with secure request checks, a stateless Cache Frontend Service, a distributed in-memory cache, Authoritative Data Sources, invalidation, Background Workers, and monitoring.

Useful Questions to Ask the Interviewer
  1. How fresh must cached values be after the official data changes?
  2. Should writes prefer write-through or write-behind?
  3. How much memory can each cache node use?
  4. Which keys need TTL expiration?
  5. Can reads briefly return an older replica value?
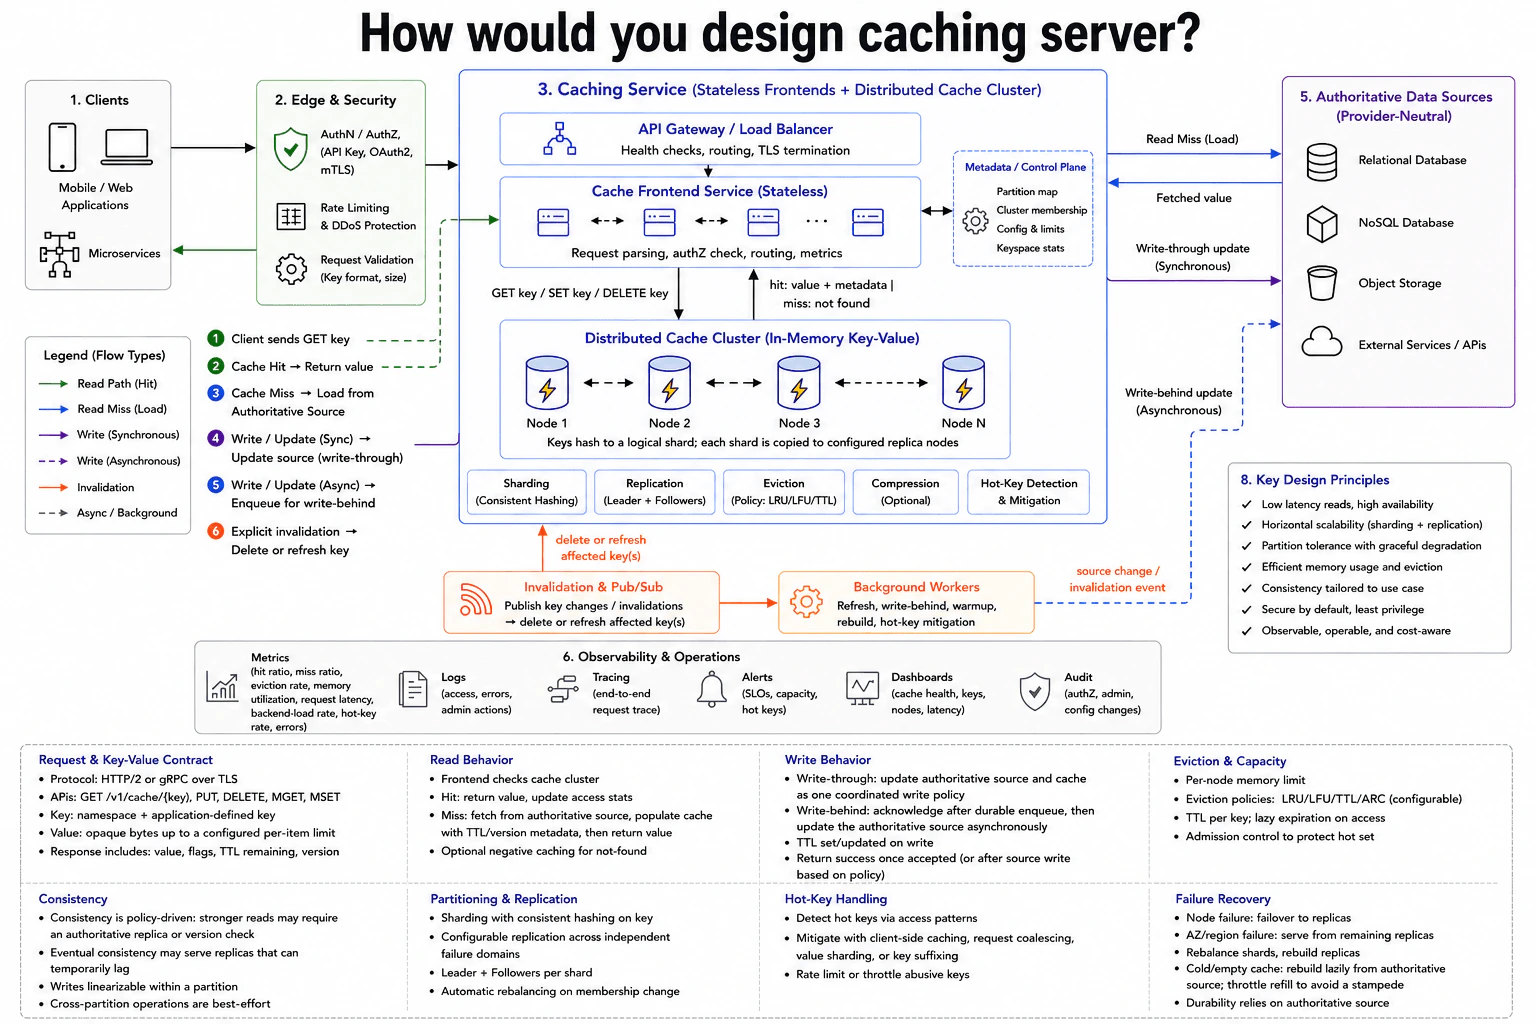
How would you design a caching server? diagram
How to Explain It in an Interview
1. Define the request and key-value contract

I would start by defining what the cache accepts. The key is a namespace plus an application-defined key. The value is opaque bytes with a configured per-item limit. A response can include the value, flags, remaining TTL, and version information.

Requests cross the Edge & Security layer for authentication, authorization, rate limiting, DDoS protection, and validation. The API Gateway / Load Balancer routes healthy requests to the stateless Cache Frontend Service.

2. Explain the read path

For a read, the frontend sends a GET key request to the Distributed Cache Cluster. Consistent hashing maps the key to a logical shard, and each shard has configured replica nodes.

On a hit, the cluster returns the value and metadata. On a miss, the Cache Frontend Service loads the value from the Authoritative Data Sources. It then puts the value in cache with TTL or version metadata and returns it.

3. Explain writes and invalidation

The design supports two write choices. With write-through, the Cache Frontend Service coordinates updating the Authoritative Data Sources and the cache. This keeps cached data fresher, but the write does more work before finishing.

With write-behind, the request can be acknowledged after the write is durably enqueued. Background Workers later update the Authoritative Data Sources. This can reduce foreground delay, but recovery is harder.

Explicit invalidation uses Invalidation & Pub/Sub to delete or refresh affected keys. TTL also limits how long a cached item can remain.

4. Explain capacity, hot keys, and consistency

Each node has a memory limit, so the cache needs eviction. The diagram allows LRU, LFU, TTL, or ARC policies. Admission control protects useful cached data.

Hot-Key Detection & Mitigation can use client-side caching, request coalescing, value sharding, key suffixing, or rate limits. Consistency is policy-driven. Stronger reads may require an authoritative replica or version check, while other replicas can be briefly behind.

5. Explain failures and operations

If a cache node fails, traffic can move to replicas. Shards can rebalance and replicas can be rebuilt. After a cold cache, data is rebuilt lazily from the Authoritative Data Sources, while refill is throttled to avoid a stampede.

Metrics track hit ratio, miss ratio, eviction rate, memory use, request latency, backend-load rate, hot-key rate, and errors. Logs, tracing, alerts, dashboards, and audit records help find problems. Sharding and replication improve speed and availability, but they add consistency, recovery, and operational complexity.

Practical Complexity & Trade-offs

The benefit is fast reads because most requests can stay inside the in-memory cache. Sharding spreads keys across nodes, and replication keeps data available when a node fails. The downside is that replicas can be a little behind. Invalidation, TTL, and version checks help control stale data. Write-through keeps the cache closer to the latest value, but writes take longer. Write-behind can return sooner, but recovery is harder. Eviction keeps memory bounded, but useful items may be removed. Hot-key controls protect overloaded shards, but they add more cache logic and operational work.

Why Interviewers Ask This

Interviewers ask this to see whether you can separate a caching problem into clear read, write, failure, and scaling paths. They want to know if you understand that the cache improves speed but is not the official data source. A strong answer also shows judgment around misses, invalidation, sharding, replication, memory limits, hot keys, recovery, consistency, and monitoring. The goal is clear trade-off thinking, not memorizing one product.
Interviewer may ask next
What would you change if cached values must reflect important writes almost immediately?

I would keep the same architecture, but I would favor write-through for the keys that need very fresh reads. The Cache Frontend Service would coordinate updating the Authoritative Data Sources and the cache before the write is treated as complete. I would also keep version information with cached values. Stronger reads could use an authoritative replica or a version check when freshness matters most.

Invalidation & Pub/Sub would still handle explicit invalidation. If data changes, affected cache keys would be deleted or refreshed instead of waiting only for TTL expiration. Replicas could still be used for availability, but a stronger read should not depend on a replica that may be briefly behind.

The main downside is higher write latency. Each important write now does more work before finishing. We gain fresher reads and clearer correctness, but we give up some of the speed benefit that write-behind can provide.

How would you handle one key becoming so popular that its cache shard starts getting overloaded?

I would keep the same distributed cache and use the Hot-Key Detection & Mitigation controls already shown. Metrics would first identify the key through unusual request rate, latency, or backend-load patterns. That shows whether one shard is receiving much more work than the others.

For a read-heavy hot key, client-side caching can reduce requests reaching the cluster. Request coalescing can also help. Many requests for the same missing key can share one load instead of all reaching the Authoritative Data Sources. If the value itself creates too much load, value sharding or key suffixing can spread work. Rate limiting can protect the service from abusive traffic.

Replication still helps availability, and monitoring shows whether the mitigation works. The downside is extra cache logic. Some techniques also make invalidation and consistency harder because more copies or derived keys must be managed.

2. How would you design your own cloud service like Google Cloud, starting from scratch?Cloud ArchitectureHardGoogle

Question Details

Assume no existing cloud-provider services are available. Define the tenant and resource hierarchy and the control-plane and data-plane boundaries for compute, networking, storage, identity, provisioning, metering, observability, and failure isolation. Explain the APIs, state ownership, regional placement, security boundaries, reliability model, and major architecture tradeoffs without inventing traffic volumes.

Short Interview Answer (30-60 seconds)

At a high level, I would build a cloud platform that safely lets many tenants create and run resources. The main challenge is separating global management from regional customer workloads while keeping failures isolated. I would explain three parts: how requests enter the platform, how the global control plane manages desired state, and how regional data planes run workloads. Strong control-plane state and multi-zone regional placement improve reliability. The trade-off is more safety and isolation at the cost of greater complexity and infrastructure.

Detailed Explanation

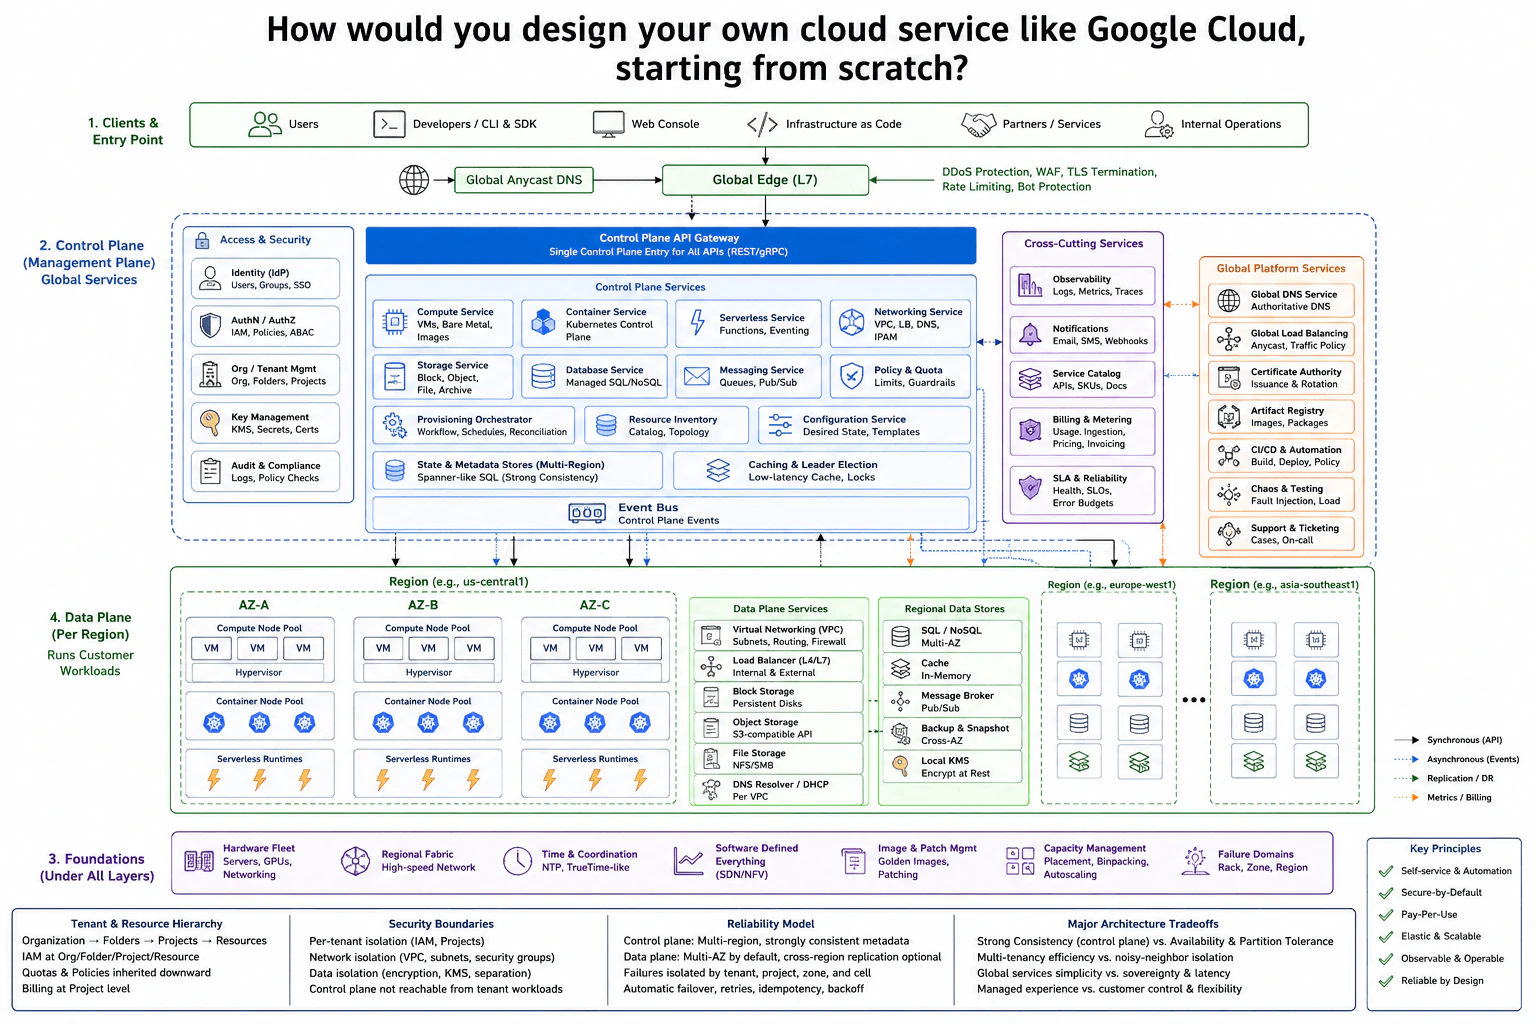
The goal is to build a cloud platform where many customers can safely create compute, networking, storage, database, container, and serverless resources. The difficult part is keeping management reliable without putting customer workloads inside the management system. The design solves this by separating a global control plane from regional data planes. The control plane decides what resources should exist. Regional data planes run those resources. Clear tenant, project, region, zone, and security boundaries also stop one failure from spreading across the whole platform.

Useful Questions to Ask the Interviewer
  1. Which resource types must the first version support?
  2. Should customers choose the region for every regional resource?
  3. Which data-plane resources need optional cross-region copies?
  4. How much networking and security control should each tenant receive?
How would you design your own cloud service like Google Cloud, starting from scratch? diagram
How to Explain It in an Interview
1. Start with tenants and ownership

I would start by defining who owns each resource. The hierarchy is Organization, then Folders, then Projects, then Resources. Projects are important isolation boundaries. IAM, quotas, and policies can be applied above a resource and inherited downward. Billing and Metering also track usage at the project level. This gives every later service a clear tenant and ownership context.

2. Explain the global entry path

Management requests first reach Global Anycast DNS. They then pass through the Global Edge at layer 7. The edge handles DDoS protection, WAF checks, TLS termination, rate limiting, and bot protection. The request then reaches the Control Plane API Gateway. Access and Security services check identity, authorization, policies, keys, and audit requirements before the requested operation continues.

3. Explain the control plane

The control plane manages desired state. Compute Service, Container Service, Serverless Service, Networking Service, Storage Service, Database Service, and Messaging Service expose management operations. Policy and Quota applies limits and guardrails.

The Provisioning Orchestrator turns requests into workflows, schedules, and repeated checks. Resource Inventory tracks the catalog and topology. Configuration Service stores desired state and templates. Multi-region State and Metadata Stores keep strongly consistent control information. Caching and Leader Election support fast access and coordination. The Event Bus carries control-plane events between services.

Cross-Cutting Services provide observability, notifications, the service catalog, Billing and Metering, and SLA and reliability information. Global Platform Services provide global DNS, global load balancing, certificate management, the artifact registry, CI/CD automation, chaos testing, and support functions.

4. Explain the regional data plane

The control plane sends work to the selected region. Each region contains availability zones. Compute Node Pools run virtual machines. Container Node Pools run container workloads. Serverless Runtimes run functions and event-driven work.

Regional Data Plane Services provide virtual networking, load balancing, block storage, object storage, file storage, and DNS or DHCP. Regional Data Stores provide SQL or NoSQL storage, cache, messaging, backup and snapshots, and Local KMS. Customer workload execution stays in this regional data plane rather than inside the global control plane.

5. Explain foundations, reliability, and trade-offs

Under every layer are the hardware fleet, regional network fabric, time and coordination, software-defined infrastructure, image and patch management, capacity management, and failure domains. These foundations let the higher services operate consistently.

The control plane keeps multi-region, strongly consistent metadata. Data-plane resources use multiple availability zones by default, while cross-region replication is optional. Failures are isolated by tenant, project, zone, and cell. Automatic failover, retries, idempotency, and backoff help the platform recover safely.

The main trade-off is consistency versus availability and latency. Strong control-plane consistency makes management safer but requires more coordination. More regions and replication improve resilience but increase cost and operational complexity.

Practical Complexity & Trade-offs

The benefit is strong separation between management and customer workloads. A problem in one region or zone does not need to stop the entire platform. Multi-zone placement also protects regional workloads from smaller failures. The downside is more infrastructure and more operational work. Strong consistency for control-plane state makes resource management safer, but coordination across regions can add delay. Optional cross-region replication can improve recovery, but it costs more. Global services make the platform easier to use, but they can increase latency and make data-location rules harder. More tenant isolation also improves safety, but it reduces how much infrastructure can be shared.

Why Interviewers Ask This

Interviewers ask this question to see whether you can break a very large platform into understandable boundaries. They want to test how you separate management from workload execution, decide who owns state, isolate tenants and failures, place services across regions and zones, and protect access. They also want to hear sensible trade-offs instead of promises about perfect availability, instant recovery, or unlimited scale.

Interviewer may ask next
How would the design change if an important customer workload must survive a full regional outage?

I would keep the same control-plane and data-plane separation, but I would use the diagram's optional cross-region replication for the important data-plane resources. The workload would still run inside regional data planes. I would place the required workload resources in another region so a healthy regional data plane can continue serving traffic.

The control plane already keeps its important metadata across regions with strong consistency. That means the platform still knows which resources exist and what their desired configuration should be. Data such as database records, object data, or backups would need the appropriate cross-region copy before the second region could take over safely.

Global DNS and Global Load Balancing can direct traffic toward a healthy region. Retries, idempotency, backoff, and automatic failover help the control system repeat recovery work without creating unwanted duplicate resources.

The main downside is cost and complexity. Extra regional resources and replicated data need more infrastructure, and regional recovery must be tested carefully.

How would you stop one tenant from using enough resources to affect other tenants?

I would use the existing tenant, project, policy, quota, and regional isolation boundaries. Every resource belongs to the Organization, Folder, Project, and Resource hierarchy. Projects give the platform a clear place to apply isolation and limits.

Policy and Quota would enforce resource limits and guardrails before more capacity is created. Access and Security would still verify identity and authorization first. The Global Edge would apply rate limiting so one client cannot flood the management path. Billing and Metering would record usage by project so unusually high consumption is visible.

Inside the data plane, networking, compute, storage, and Local KMS remain separated by project and regional boundaries. Capacity Management also helps the platform plan and allocate the underlying fleet. Observability exposes health, logs, metrics, and traces when pressure appears.

The downside is that strict quotas can block valid growth. The platform therefore needs controlled quota changes without weakening tenant isolation.

3. Design and diagram an application like Netflix in the cloud.Cloud ArchitectureHardGoogle

Question Details

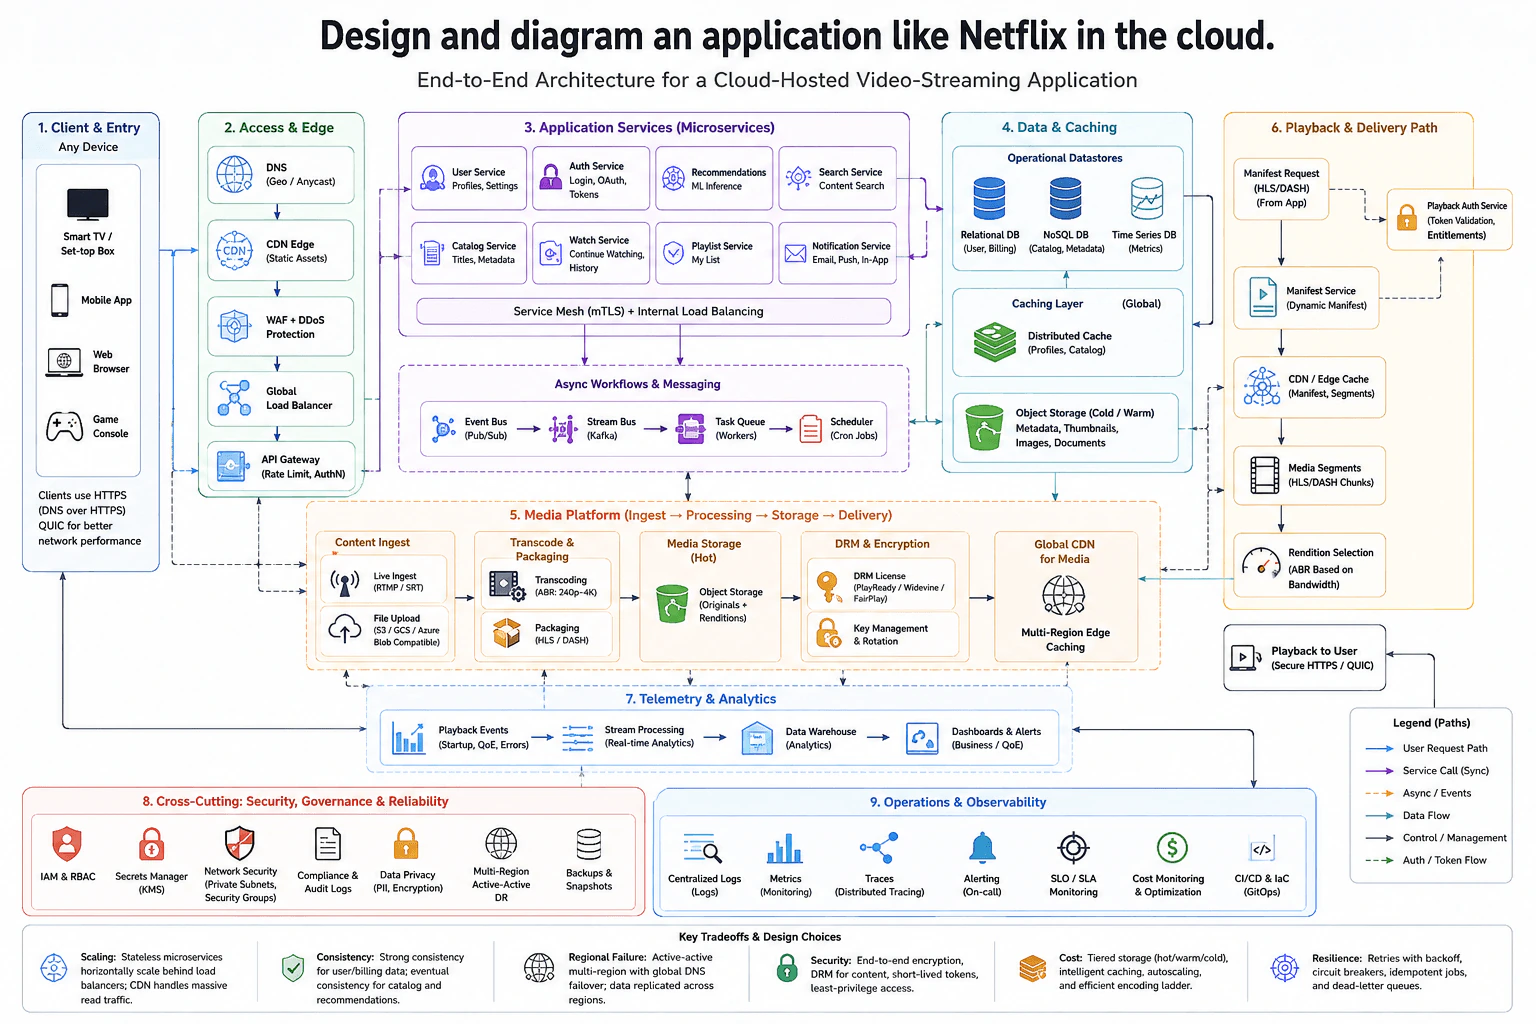
Design a cloud-hosted video-streaming application. Show the paths for users, catalog and playback metadata, media ingest, processing, storage, delivery, playback authorization, and telemetry. Explain the scaling, data-consistency, regional-failure, security, and operational tradeoffs without selecting a cloud provider that the reported prompt did not specify.

Short Interview Answer (30-60 seconds)

At a high level, the goal is to let users discover and stream video smoothly from many devices. The main challenge is keeping playback fast while authorization, metadata, media processing, and analytics scale safely. I would explain three flows: application requests, media ingest and playback delivery, and background telemetry. Stateless services scale behind load balancing, while CDN edge caches handle heavy media reads. The trade-off is that critical user and billing data stays strongly consistent, while catalog and recommendation data can accept small delays.

Detailed Explanation

The system must let people browse titles, manage their accounts, start authorized playback, and watch video smoothly. It must also accept new media, create several streaming versions, protect those files, and deliver them close to viewers. The difficult part is that video creates very heavy read traffic, while account and billing information must remain correct. The diagram separates normal application requests, media ingest and processing, playback delivery, and background telemetry. Security, regional recovery, caching, and operations support all of these paths without choosing one cloud provider.

Useful Questions to Ask the Interviewer
  1. Which user, subscription, and billing data must stay strongly consistent across regions?
  2. How quickly should another region serve traffic after a regional failure?
  3. What playback authorization and DRM rules must every supported device follow?
  4. How long should original media, processed renditions, and analytics data be kept?
Design and diagram an application like Netflix in the cloud. diagram
How to Explain It in an Interview
1. Start with the user request path

I would begin with the path used by normal viewers. Smart TVs, mobile apps, web browsers, and game consoles enter through DNS using geo or Anycast routing. Static assets can be served from the CDN Edge. Traffic then passes WAF and DDoS Protection, the Global Load Balancer, and the API Gateway. The gateway applies rate limits and authentication checks.

The Application Services are separate microservices. User Service handles profiles and settings. Auth Service handles login, OAuth, and tokens. Catalog Service handles titles and metadata. Watch Service stores continue-watching history. Playlist Service manages My List. Recommendations, Search, and Notification Service handle their own work. The Service Mesh uses mTLS, which means internal service calls are encrypted and authenticated.

2. Explain data and background work

Different data uses different stores. The Relational DB keeps user and billing data. The NoSQL DB keeps catalog metadata. The Time Series DB keeps metrics. A Distributed Cache keeps frequently used profiles and catalog data close to the services.

Object Storage keeps metadata, thumbnails, images, and documents. Background work goes through Event Bus, Stream Bus, Task Queue, and Scheduler components. The diagram shows Pub/Sub, Kafka, workers, and cron jobs as examples. This work runs separately so slower background jobs do not block normal requests.

3. Explain media ingest and processing

For new content, media enters through Live Ingest or File Upload. Transcoding creates several bitrate and resolution versions, from lower quality through 4K. Packaging creates HLS or DASH output. Media Storage keeps the original files and processed renditions in Object Storage.

DRM and Encryption protect the content. DRM licensing supports PlayReady, Widevine, and FairPlay. Key Management handles key rotation. The Global CDN for Media then places media closer to viewers with multi-region edge caching.

4. Explain playback and telemetry

For playback, the app sends a Manifest Request. Playback Auth Service validates the token and entitlements. Manifest Service creates the Dynamic Manifest. CDN or Edge Cache serves manifests and HLS or DASH media segments. Rendition Selection chooses an appropriate bitrate based on available bandwidth. Playback reaches the user through secure HTTPS, with QUIC shown as an option.

Playback Events such as startup, quality-of-experience data, and errors enter the Telemetry and Analytics pipeline. Stream Processing handles real-time analytics. The Data Warehouse supports longer-term analysis. Dashboards and Alerts show business and playback health.

5. Explain scaling, failures, security, and operations

Stateless microservices scale horizontally behind load balancers. CDN capacity absorbs massive read traffic. Strong consistency is used for user and billing data, while catalog and recommendation data can accept small delays. Regional failure uses active-active multi-region service, global DNS failover, and replicated data. IAM and RBAC, Secrets Manager, private networking, audit logs, encryption, compliance controls, backups, and snapshots protect the system. Operations use centralized logs, metrics, traces, alerting, SLO monitoring, cost monitoring, CI/CD, and infrastructure as code. Retries use backoff, circuit breakers, idempotent jobs, and dead-letter queues for resilience.

Practical Complexity & Trade-offs

The benefit is that each part can scale for its own workload. CDN caching keeps most video reads away from the application services and media storage. The downside is that many services, queues, caches, and data stores create more operational work. Strong consistency keeps user and billing data correct, but cross-region coordination can add delay and cost. Catalog and recommendation data can accept small delays, which makes scaling easier. Active-active regions improve availability, but duplicated capacity and replicated data cost more. Tiered hot, warm, and cold storage lowers storage cost. Retries improve resilience, but they need backoff and circuit breakers to avoid making failures worse.

Why Interviewers Ask This

Interviewers ask this to see whether a candidate can break a very large system into clear flows. They want judgment about video delivery, caching, data consistency, background processing, security, and regional failures. They also want to see whether the candidate can choose different storage patterns for different data. A strong answer explains trade-offs clearly instead of claiming perfect availability or unlimited scale.

Interviewer may ask next
What would you change if one entire region failed during a major streaming event?

I would keep the same active-active multi-region design shown in the diagram. Global DNS failover and the load-balancing path would send new application traffic toward healthy regional capacity. Stateless Application Services can run there because they do not depend on memory from the failed region.

The data path matters most. User and billing information must still follow the diagram's strong-consistency requirement. Replicated catalog data, Object Storage, and media renditions should remain reachable from another region. The Global CDN for Media also reduces the impact because many manifests and media segments are already cached near viewers.

I would use Centralized Logs, Metrics, Traces, Alerting, and SLO monitoring to watch the recovery. Retries should use backoff, and circuit breakers should stop repeated calls toward failed dependencies. The downside is higher cost because active-active regions require duplicated capacity, replicated data, and regular recovery testing.

How would the design handle a sudden traffic spike for one very popular title?

I would rely first on the CDN and edge caching already shown in the design. Media segments are read-heavy, so serving popular HLS or DASH chunks from CDN or Edge Cache keeps repeated requests away from Media Storage. The Global CDN for Media can place those files close to viewers in several regions.

The Application Services stay stateless, so they can scale horizontally behind the Global Load Balancer. The Distributed Cache can absorb repeated profile and catalog reads. API Gateway rate limits protect the service layer from abusive or accidental request spikes.

Playback authorization still follows the normal path. Playback Auth Service checks the token and entitlements before Manifest Service creates the Dynamic Manifest. Metrics, traces, alerts, and Playback Events show whether startup time, errors, or quality are getting worse. The downside is higher CDN, cache, and compute cost during the spike.

4. How does the TCP three-way handshake work?NetworkingEasyGoogle

Question Details

Trace connection establishment between a client and server. Explain the direction and purpose of each segment, the relevant flags and connection states, how initial sequence information is established, what happens when a segment is lost or rejected, and when application data can begin.

Short Interview Answer (30-60 seconds)

At a high level, TCP uses a three-step handshake to open a reliable, two-way connection. The main challenge is confirming both sides can communicate and synchronizing their starting sequence numbers. I would explain it as SYN, SYN-ACK, and ACK. The client sends SYN with sequence x. The server replies with sequence y and acknowledges x + 1. The client then acknowledges y + 1. Both sides reach ESTABLISHED, and application data can flow. The trade-off is extra setup time before normal communication begins.

Detailed Explanation

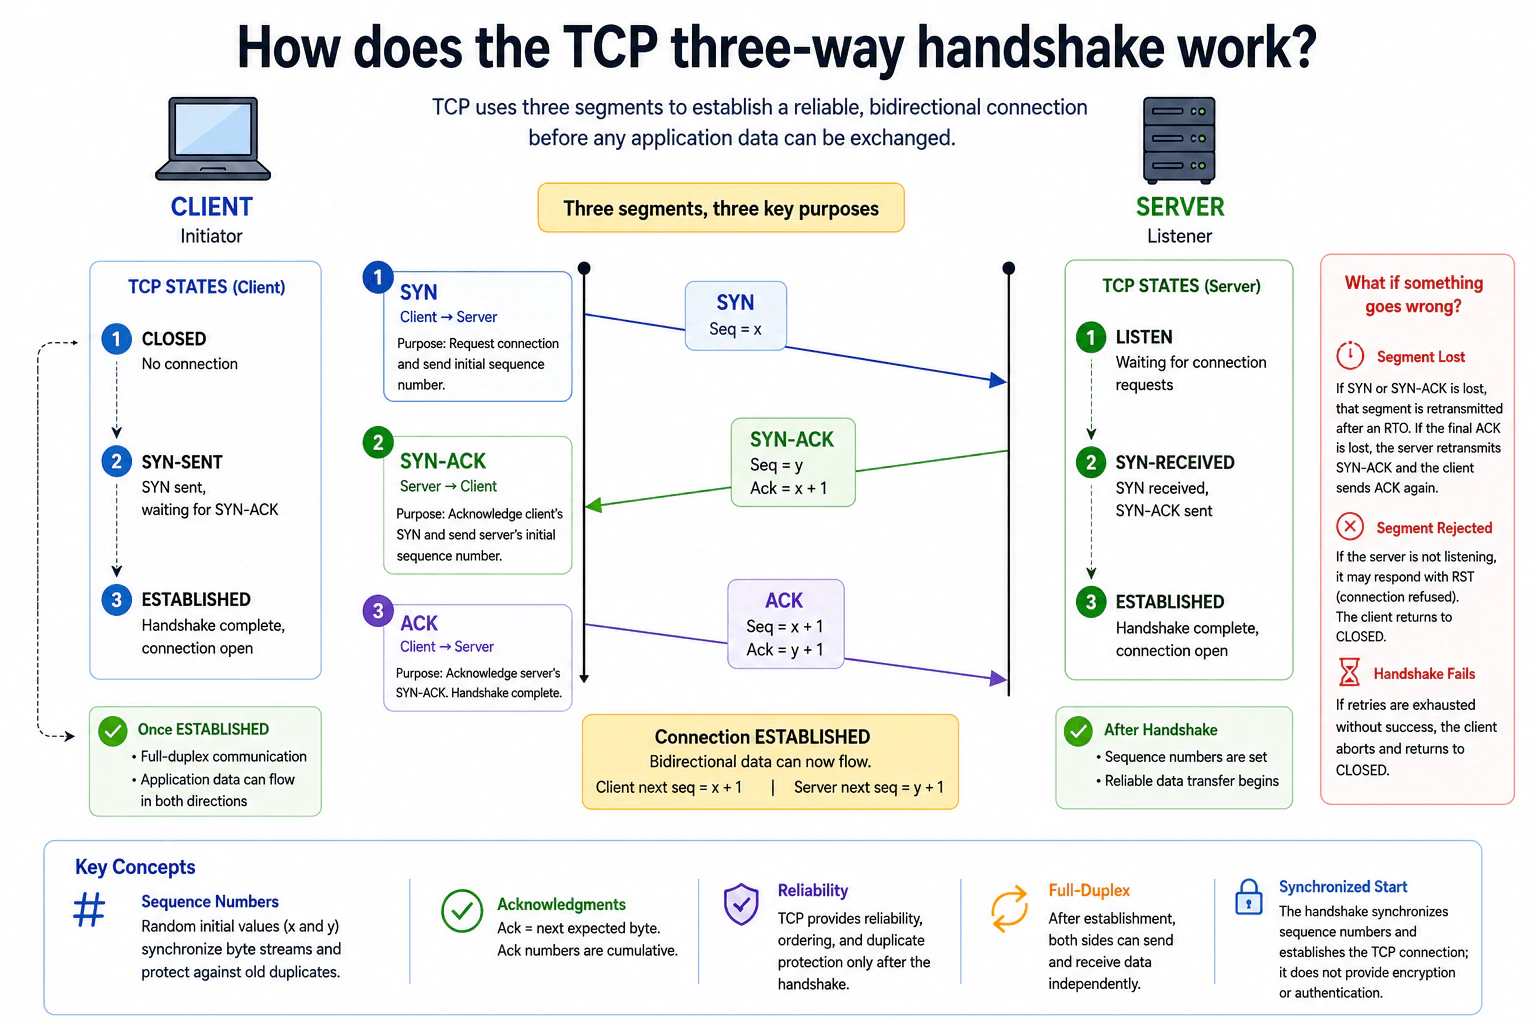
The goal is to let a client and server prepare a connection before normal application data starts flowing. Both sides need to confirm communication and establish starting numbers for tracking data correctly. The diagram organizes this into three messages. First, the client asks to connect. Second, the server confirms that request and sends its own starting number. Third, the client confirms the server's response. The diagram also shows the TCP states, how lost handshake segments are retried, how a connection can be rejected, and when normal data transfer can begin.

Useful Questions to Ask the Interviewer
  1. Should I explain both the normal handshake and common failure cases?
  2. Should I include the TCP connection states on both sides?
  3. Should I explain how the initial sequence numbers are used?
How does the TCP three-way handshake work? diagram
How to Explain It in an Interview
1. Start with the client sending SYN

I would start with the client in the CLOSED state. The server is waiting for connection requests in the LISTEN state.

The client sends a SYN segment to the server. SYN means synchronize. Its purpose is to request a connection and send the client's initial sequence number. In the diagram, that number is x. After sending SYN, the client enters SYN-SENT and waits for the server's response.

2. Explain the server's SYN-ACK

When the server receives SYN, it sends SYN-ACK back to the client. This segment performs two jobs.

The SYN part carries the server's initial sequence number, shown as y. The ACK part confirms the client's SYN. A SYN consumes one sequence number, so the server sends Ack = x + 1. The server then enters SYN-RECEIVED because it received SYN and sent SYN-ACK.

3. Finish with the client's ACK

The client receives SYN-ACK and confirms the server's SYN. It sends an ACK segment back to the server.

The client's next sequence number is x + 1. Its acknowledgment number is y + 1 because the server's SYN also consumes one sequence number. After sending this ACK, the client is ESTABLISHED. When the server receives it, the server also enters ESTABLISHED.

4. Explain when application data can flow

Once the handshake completes, the connection is established. Application data can now flow in both directions.

TCP is full-duplex, which means both sides can send and receive independently. Sequence numbers identify positions in each byte stream. An acknowledgment number tells the sender which byte the receiver expects next. These numbers help TCP provide ordered and reliable data transfer after connection setup.

5. Explain loss and rejection

I would also explain what happens when a handshake segment is lost. If SYN or SYN-ACK is lost, that segment is retransmitted after a retransmission timeout, or RTO. If the final ACK is lost, the server retransmits SYN-ACK, and the client sends ACK again.

If the server is not listening, it may respond with RST, which means reset. The connection is refused, so the client returns to CLOSED. If retries are exhausted without success, the client also gives up and returns to CLOSED. The handshake synchronizes sequence numbers and establishes the TCP connection, but it does not provide encryption or authentication.

Practical Complexity & Trade-offs

The benefit is that both sides confirm communication before normal data transfer begins. They also establish starting sequence numbers for tracking bytes in each direction. The downside is that connection setup needs three segments before both sides are fully established. Lost handshake segments can add delay because TCP may need to retransmit them after a timeout. A rejected connection stops the handshake completely. TCP gives applications reliable and ordered delivery after setup, but the handshake does not encrypt traffic or prove the identity of the other side. Those security features must come from another protocol or layer.

Why Interviewers Ask This

Interviewers ask this to see whether you understand TCP connection setup instead of only memorizing SYN and ACK. They want to know whether you can trace each segment, explain sequence and acknowledgment numbers, follow the client and server states, and reason about packet loss or rejection. A strong answer also explains exactly when the connection becomes established and when application data can begin.

Interviewer may ask next
What happens if the final ACK from the client is lost?

The connection does not immediately fail. The client has already received SYN-ACK and sent its final ACK, so the client moves to ESTABLISHED. The server has not received that confirmation, so it remains in SYN-RECEIVED.

After its retransmission timeout, the server can send SYN-ACK again. The client recognizes that response as belonging to the connection it already knows. It then sends ACK again with acknowledgment number y + 1.

When the server receives that ACK, it moves to ESTABLISHED. This shows how the handshake can recover from a lost final ACK without starting a completely new connection attempt. The main downside is extra delay and extra network traffic while the missing confirmation is recovered.

What happens if the server is not listening for the connection?

The connection does not proceed. The client begins in CLOSED and sends SYN because it wants to create the connection. If the server is not listening, it may respond with RST, which means reset.

That RST tells the client that the connection was actively rejected. The client therefore stops the handshake and returns to CLOSED. It does not continue to SYN-ACK and the final ACK.

This is different from losing SYN or SYN-ACK. With packet loss, TCP can retry after a retransmission timeout because no rejection was received. With RST, the other side has explicitly refused the connection. The application cannot begin normal data transfer. It would need to make a new connection attempt later after a listening service becomes available. The downside is that no application communication can occur until a new handshake succeeds.

5. Explain the OSI model and the responsibility of each layer.NetworkingEasyGoogle

Question Details

Walk through the layers in order and explain the communication responsibility, addressing or framing boundary, and representative protocol behavior associated with each one. Relate the model to diagnosing a client-to-server path without treating the layers as separate physical routes.

Short Interview Answer (30-60 seconds)

At a high level, the OSI model gives us seven logical layers for understanding network communication. The main challenge is knowing what each layer does and where a failure belongs. I would explain it in three parts: the seven layer responsibilities, encapsulation and decapsulation, and top-down troubleshooting. Data moves from Application down to Physical on the sender, then back up on the receiver. The trade-off is that real TCP/IP networks do not map perfectly to every OSI layer.

Detailed Explanation

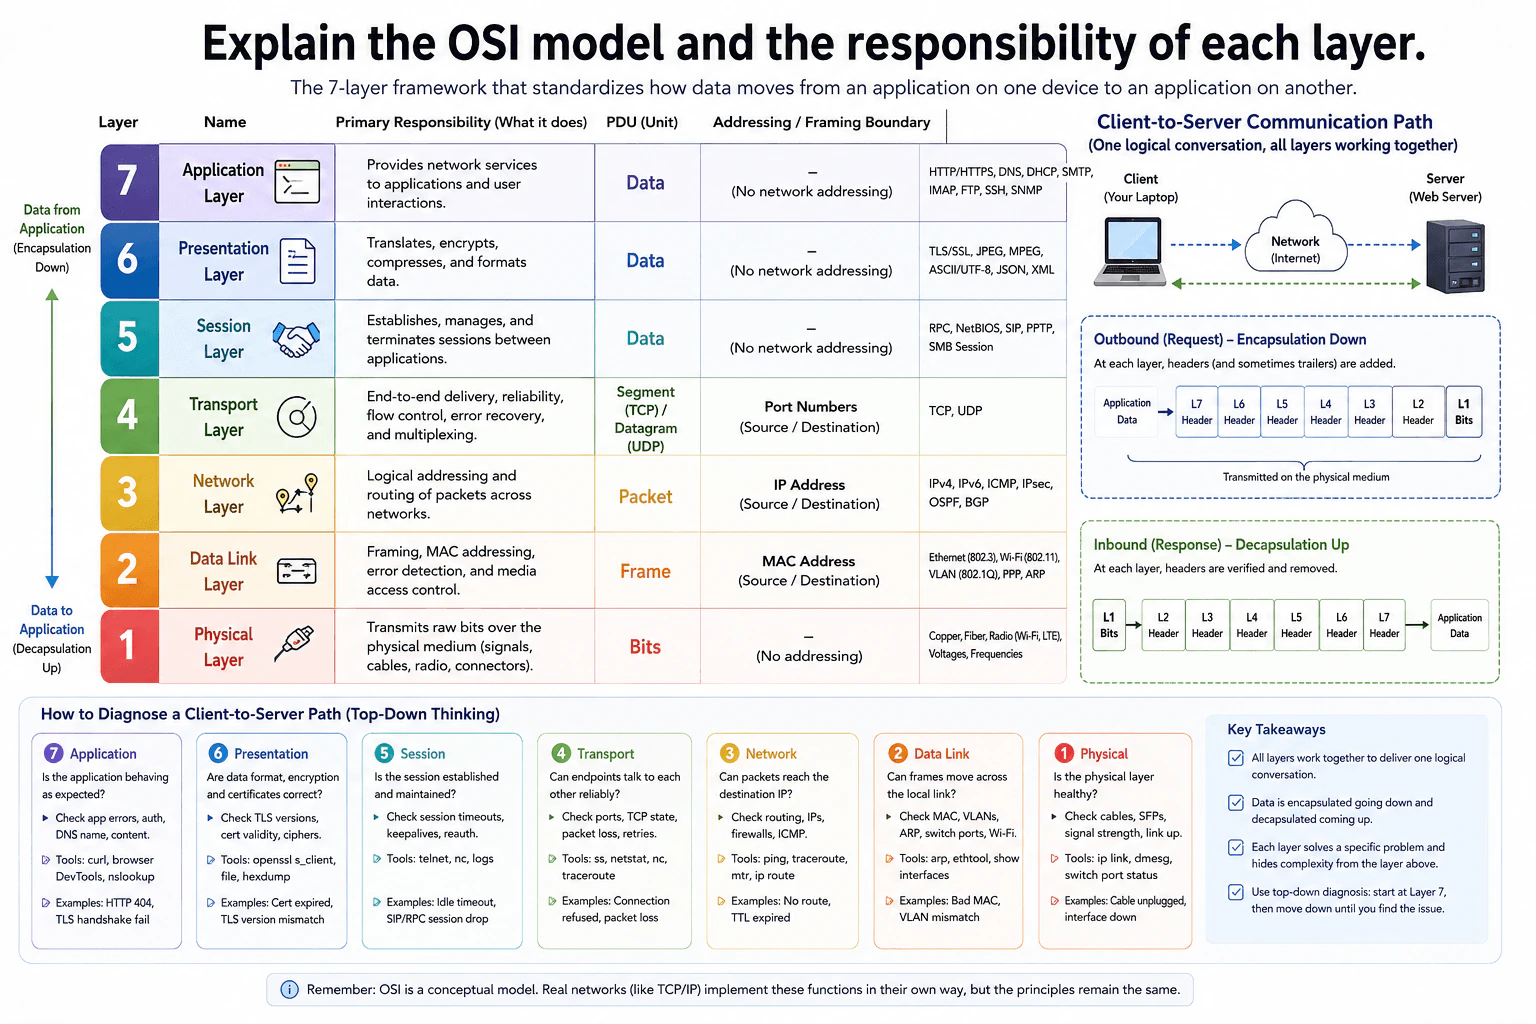
The OSI model is a simple way to organize what happens when one computer communicates with another. It divides communication into seven logical layers. Each layer solves a different part of the problem. These layers are not seven separate physical routes. They describe different responsibilities in one client-to-server conversation. I would first explain what each layer does and what kind of addressing or framing it uses. Then I would show how data moves down and back up the stack. Finally, I would use the same layers to troubleshoot a failed connection.

Useful Questions to Ask the Interviewer
  1. Would you like all seven layers with representative protocol examples?
  2. Should I also explain how I would troubleshoot a client-to-server failure?
Explain the OSI model and the responsibility of each layer. diagram
How to Explain It in an Interview
1. Start with the seven-layer idea

I would say that the OSI model separates networking into seven logical responsibilities. Layers 7 through 5 are closest to applications. Layers 4 through 1 handle transport, routing, local-link delivery, and the physical medium. Each layer serves the layer above it. The model gives us a common way to describe one end-to-end conversation.

2. Explain Application, Presentation, and Session

Layer 7 is the Application layer. It provides network services used by applications and users. The diagram includes HTTP/HTTPS, DNS, DHCP, SMTP, IMAP, FTP, SSH, and SNMP.

Layer 6 is Presentation. It translates, encrypts, compresses, and formats data. Examples shown include TLS/SSL, JPEG, MPEG, ASCII/UTF-8, JSON, and XML.

Layer 5 is Session. It establishes, manages, and ends communication sessions between applications. The diagram shows RPC, NetBIOS, SIP, PPTP, and SMB Session as representative behaviors.

3. Explain Transport and Network

Layer 4 is Transport. It provides end-to-end delivery, multiplexing, flow control, and reliability when the transport protocol supports those features. TCP and UDP are the examples. Port numbers identify source and destination application endpoints. Its data unit is a TCP segment or UDP datagram.

Layer 3 is Network. It provides logical addressing and routes packets across networks. Source and destination IP addresses are the important addressing boundary. Its data unit is a packet. The diagram includes IPv4, IPv6, ICMP, IPsec, OSPF, and BGP.

4. Explain Data Link and Physical

Layer 2 is Data Link. It handles framing, MAC addressing, error detection, and media access on a local link. Its data unit is a frame. The diagram includes Ethernet, Wi-Fi, VLAN, PPP, and ARP. Source and destination MAC addresses describe the current link-level delivery and can change when traffic crosses routed links.

Layer 1 is Physical. It transmits raw bits as electrical, optical, or radio signals. Examples include copper, fiber, and radio. It has no network addressing responsibility.

5. Connect the layers to the real path and troubleshooting

On the client, application data is encapsulated as it moves downward. Relevant layers add control information such as headers. The Physical layer transmits the resulting bits across the medium. The server receives those bits and decapsulates the data upward until the application receives it.

For troubleshooting, I can start at Layer 7 and move downward. I check application behavior, TLS and formatting, session state, ports and TCP state, IP reachability and routing, MAC or VLAN problems, and finally cables, signals, and link status. This gives me a structured diagnosis without pretending each OSI layer is a separate physical route.

Practical Complexity & Trade-offs

The benefit is that the OSI model gives engineers a shared language for network problems. A failed request can be checked one layer at a time instead of treating networking as one large mystery. Encapsulation also explains how application data becomes transport data, packets, frames, and finally bits. The downside is that OSI is a conceptual model. Real TCP/IP networks do not always separate these jobs into seven exact implementation layers. Some protocols also span ideas from more than one OSI layer. We still use the model because it makes responsibilities and troubleshooting easier to explain.

Why Interviewers Ask This

Interviewers ask this to see whether you understand networking as an end-to-end process instead of only memorizing seven layer names. They want to know whether you can connect application behavior, ports, IP addresses, frames, and the physical link. They also want to see whether you can use those responsibilities to troubleshoot a real client-to-server problem in a clear order.

Interviewer may ask next
A client can resolve the server name and reach its IP address, but HTTPS still fails. Which OSI layers would you check next?

I would continue with the same top-down troubleshooting method. DNS resolution and IP reachability show that some Application and Network layer functions are working, but they do not prove that HTTPS can complete successfully.

I would first check the Application layer. I would confirm the correct HTTPS endpoint, expected hostname, and server behavior. Then I would check the Presentation layer because TLS is shown there in this diagram. I would look at the TLS version, certificate validity, certificate hostname, and cipher compatibility.

Next I would check the Transport layer. I would confirm that the required destination port is reachable and that the TCP connection completes. I would also look for resets, retransmissions, or packet loss.

If needed, I would continue down through Network, Data Link, and Physical checks. The downside of strict layer-by-layer thinking is that one real failure can involve more than one logical layer.

How do encapsulation and decapsulation work when a client sends data to a server?

On the sending client, application data moves down through the OSI model. Each relevant layer adds information needed for its responsibility. The Transport layer can create a TCP segment or UDP datagram and uses port numbers. The Network layer carries that information in an IP packet with source and destination IP addresses. The Data Link layer creates a frame for the current local link and uses link-level information such as MAC addresses. The Physical layer sends the result as bits over the medium.

The receiving side performs the reverse process. It receives bits at Layer 1. Layer 2 processes the frame. Layer 3 processes the packet. Layer 4 processes the transport data. The upper layers finally deliver usable data to the application.

The important limitation is that these are logical responsibilities. They do not mean the traffic travels through seven separate physical routes.

6. How would you check whether a user has execute permission on a file or directory?SecurityEasyGoogle

Question Details

On a Linux cloud host, show the exact checks for the target user and path, including identity and group context, the path's effective permission sources, directory traversal requirements, and any extended access rules. Explain how you would verify the effective result without changing permissions.

Short Interview Answer (30-60 seconds)

I first check the user's UID and groups, then inspect the target and every parent directory for normal permissions and ACLs. Finally, I verify access as that user with a read-only test -x. On files, x means executable; on directories, it means searchable or traversable.

Detailed Explanation

See the Code while reading this explanation.

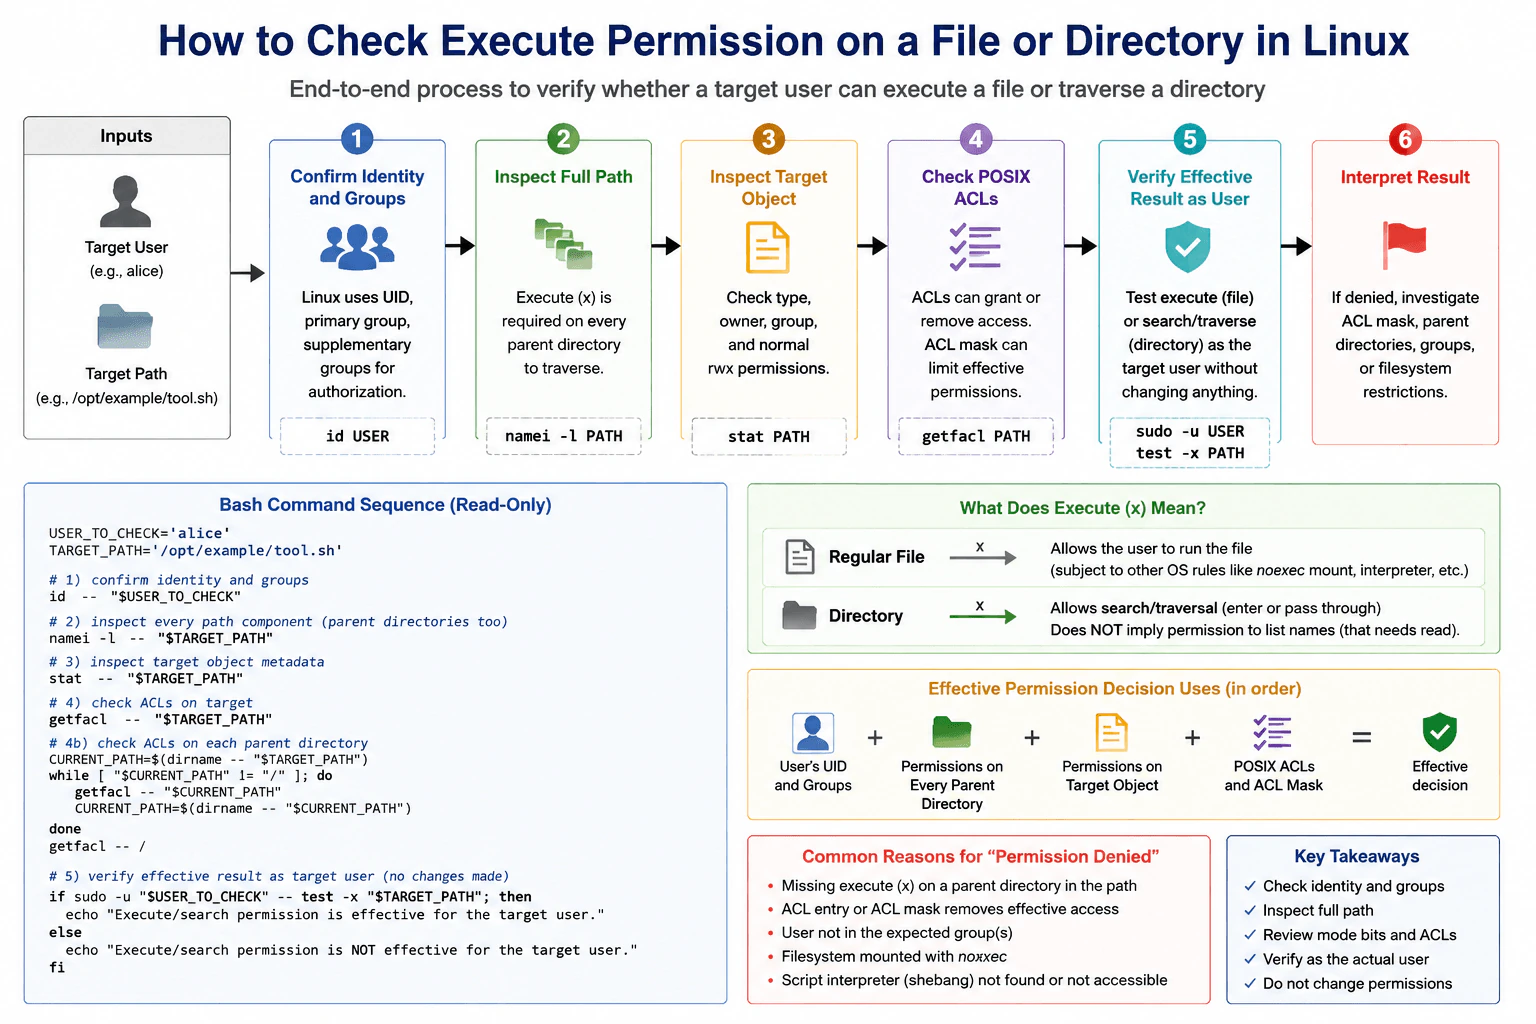
The goal is to find out whether one person is allowed to use a particular item in the required way. I first confirm exactly which person is being checked and which groups apply to that person. Then I inspect the item and every folder leading to it, because access can be blocked before the final item is reached. I also check for extra access rules that may grant or restrict permission. Finally, I safely try the permission check as that person without changing anything, so I can confirm what the system will actually allow.

Useful Questions to Ask the Interviewer
  1. Is the target a regular file, a directory, or should I explain both cases?
  2. Should I include POSIX ACLs in addition to normal owner, group, and other permission bits?
  3. May I assume I have authorized administrative access to perform a read-only check as the target user?
How would you check whether a user has execute permission on a file or directory? diagram
How to Explain It in an Interview

I would separate identity from authorization. Authentication establishes which user is being evaluated. Authorization determines whether that user is allowed to execute a file or traverse a directory.

First, I confirm the target user's UID, primary group, and supplementary groups with id USER. Group membership matters because Linux may authorize access through the owning group, a supplementary group, or a POSIX ACL entry.

Next, I inspect the complete path rather than checking only the final object. namei -l PATH is useful because it shows the owner, group, and mode bits for every component of the path. To reach a file or lower directory, the user needs execute permission on every parent directory. On a directory, execute means search or traversal: the user can pass through it and access a known entry name when other permissions allow it. Directory read permission is different; it normally controls whether directory entry names can be listed.

For the final object, I use stat PATH or ls -ld PATH to examine its type, owner, group, and normal rwx mode bits. Linux evaluates the permissions that apply to the target identity rather than combining owner, group, and other permissions together.

I also inspect POSIX ACLs with getfacl. An ACL, or Access Control List, can define permissions for named users and groups in addition to the normal mode bits. The ACL mask can limit the effective permissions of named-user entries, named-group entries, and the owning-group entry, so I check the effective ACL result rather than assuming the displayed rwx characters alone tell the whole story. Because traversal permission is required on every directory in the path, I would inspect ACLs on parent directories too when normal mode bits do not fully explain access.

After the metadata checks, I verify the effective result without modifying permissions. If I am authorized to run commands as the target identity, I can use sudo -u USER -- test -x PATH and inspect its exit status. This provides a read-only check using the target user's effective credentials instead of testing as root.

For a regular file, test -x checks whether the process has execute permission for that path. For a directory, test -x checks search or traversal permission. It does not mean the user can list the directory; listing generally requires read permission as well.

If the permission metadata appears correct but direct program execution still fails, I would distinguish permission authorization from other execution restrictions. For example, a filesystem mounted with noexec can prevent execution even when the user's file permission check succeeds. A script can also fail because its interpreter is missing or inaccessible. Those are runtime or filesystem restrictions, not evidence that the basic user permission calculation was wrong.

Throughout the investigation, I keep the checks read-only. I do not use chmod, chown, setfacl, or group changes merely to discover whether access exists. That preserves least privilege, avoids changing production state, and gives an auditable result.

Technical Approach
  1. Identify the exact target user and target path.
  2. Run id USER to confirm the user's UID, primary group, and supplementary groups.
  3. Run namei -l PATH to inspect ownership and mode permissions on every path component.
  4. Inspect the final object with stat PATH or ls -ld PATH.
  5. Run getfacl PATH and inspect parent-directory ACLs when needed.
  6. Determine whether the applicable owner, named-user, group, named-group, mask, or other permissions provide execute access.
  7. Verify execute permission on the file or search/traversal permission on every required directory.
  8. When authorized, run a read-only sudo -u USER -- test -x PATH check and inspect its exit status.
  9. If program execution still fails despite a successful permission check, investigate separate restrictions such as a noexec filesystem mount or an unavailable script interpreter.
Practical Insights

These checks are inexpensive. Identity and file metadata commands use very little memory. The amount of work mainly grows with the number of directories in the path and the number of ACL entries that must be examined. A path with more components requires more permission checks. Operational risk is low because the recommended commands are read-only. Maintenance cost is also low because they use standard Linux identity, filesystem, and ACL tools. The main security consideration is that impersonating another user for verification requires explicitly authorized administrative privilege.

Code
import subprocess

BASH_SCRIPT = r"""# Use fixed, reviewed diagnostic inputs instead of building commands from untrusted text.
USER_TO_CHECK='alice'
TARGET_PATH='/opt/example/tool.sh'

# Confirm the identity and all groups Linux may consider during authorization.
id -- "$USER_TO_CHECK"

# Inspect every path component because each parent directory must allow traversal.
namei -l -- "$TARGET_PATH"

# Inspect the final object's type, owner, group, and standard permission bits.
stat -- "$TARGET_PATH"

# Review extended ACL rules on the target; ACL masks can restrict effective access.
getfacl -- "$TARGET_PATH"

# Review each parent directory's ACL too when traversal permissions need explanation.
# dirname is used only on the fixed diagnostic path defined above.
CURRENT_PATH=`dirname -- "$TARGET_PATH"`
while [ "$CURRENT_PATH" != "/" ]; do
  getfacl -- "$CURRENT_PATH"
  CURRENT_PATH=`dirname -- "$CURRENT_PATH"`
done
getfacl -- /

# Verify the effective authorization result as the target identity.
# This is read-only and fails safely: it does not change modes, owners, groups, or ACLs.
if sudo -u "$USER_TO_CHECK" -- test -x "$TARGET_PATH"; then
  printf '%s\n' 'Execute/search permission is effective for the target user.'
else
  printf '%s\n' 'Execute/search permission is not effective for the target user.'
fi

# For a directory, -x means search/traversal permission, not permission to list names."""

result = subprocess.run(["bash", "-c", BASH_SCRIPT], check=False)
raise SystemExit(result.returncode)
Why Interviewers Ask This

This question checks whether the candidate understands Linux authorization beyond simply reading ls -l. A correct answer must account for the target user's UID and groups, owner/group/other mode bits, POSIX ACLs and their masks, execute permission on every parent directory, and the different meaning of execute permission for files and directories. It also tests whether the candidate can verify the effective result safely without changing ownership, mode bits, groups, or ACLs.

Common interview mistakes

A common mistake is checking only ls -l on the final file. That can miss supplementary groups, POSIX ACLs, ACL masks, and blocked traversal on a parent directory. Another mistake is assuming directory execute permission means the same thing as file execute permission; for directories it means search or traversal. Testing as root is also misleading because root does not represent the target user's normal authorization. Candidates should not use chmod, chown, setfacl, or group changes simply to test access. Finally, a successful test -x does not guarantee that a program will run successfully, because separate restrictions such as a noexec mount or a missing script interpreter can still prevent execution.

Interview tip

Present the answer in five layers: identity and groups, every parent directory, final-object mode bits, ACLs, and a read-only verification as the target user. Explicitly explain that execute permission means execution for a regular file but search or traversal for a directory.

Interviewer may ask next
Why can a user appear to have execute permission on a file but still get Permission denied when trying to run it?

The final file is only one part of the access path. The user also needs search or execute permission on every parent directory required to reach it. A POSIX ACL or ACL mask may restrict effective access even when basic mode bits look permissive. If the ordinary permission check succeeds but direct execution still fails, I would investigate separate execution controls such as a filesystem mounted with noexec. For scripts, I would also verify that the interpreter named by the shebang exists and is accessible.

What is the difference between read and execute permission on a directory?

Read permission on a directory generally allows its entry names to be listed. Execute permission means search or traversal: the user can pass through the directory and access a known child name when permissions on the remaining path allow it. A user may therefore have execute permission without read permission and access a known filename while being unable to list all names in that directory. Every directory component in a path normally needs execute permission for traversal.

7. What is the significance of SIGKILL?Observability And TroubleshootingEasyGoogle

Question Details

Explain how SIGKILL affects a Linux process, what opportunity the process has to handle the signal or perform cleanup, which resources or application state may be left inconsistent, how the operating system reports termination, and when it is appropriate compared with a graceful termination signal.

Short Interview Answer (30-60 seconds)

SIGKILL, signal 9, forcibly terminates a Linux process and cannot be caught, blocked, or ignored. The process cannot perform its own cleanup. Prefer SIGTERM for graceful shutdown, and use SIGKILL mainly when graceful termination fails or an immediate forced stop is necessary.

Detailed Explanation

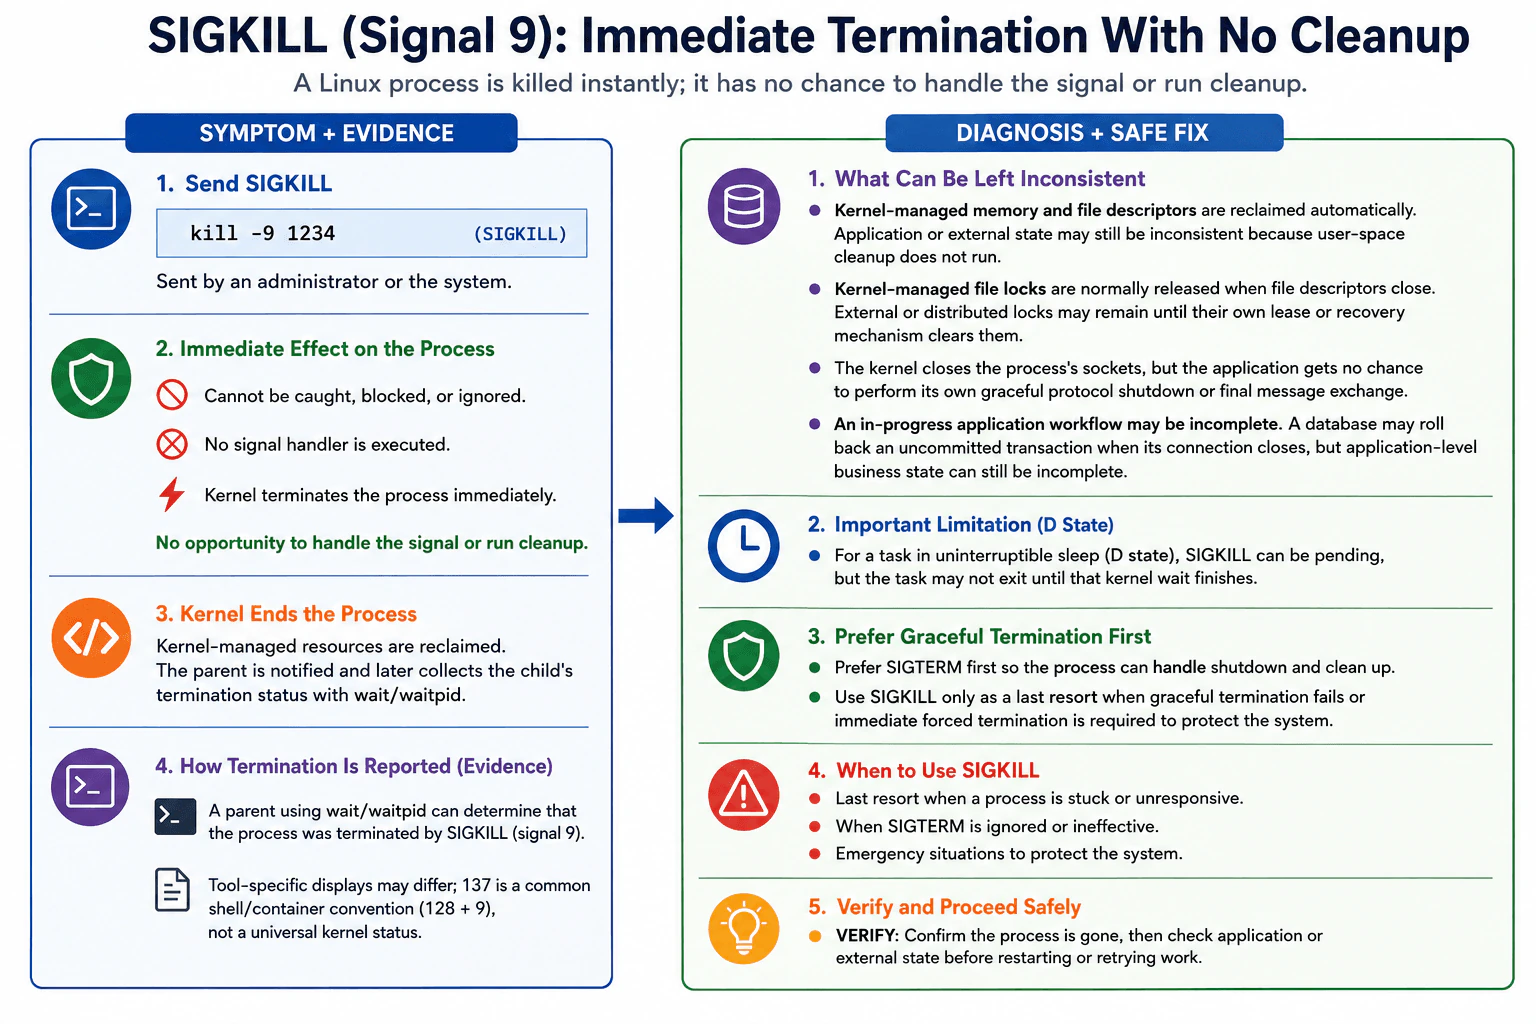
This question asks what happens when a computer program is forced to stop immediately. The important point is that the program gets no warning and no chance to finish its work neatly. It cannot save unfinished work, close things in its normal way, or prepare for shutdown. The computer takes back resources that belong to the stopped program, but work outside the program may still be unfinished or inconsistent. You should also explain why a normal, polite stop request is usually tried first and when an immediate forced stop is justified.

Useful Questions to Ask the Interviewer
  1. Should I explain the difference between SIGKILL and SIGTERM?
  2. Should I include how a parent process observes SIGKILL termination?
  3. Should I discuss the uninterruptible-sleep, or D-state, edge case?
What is the significance of SIGKILL? diagram
How to Explain It in an Interview

SIGKILL is Linux signal 9. Its significance is that it requests forced termination and the target process cannot catch, block, or ignore it. No signal handler runs, so the application has no opportunity to perform user-space cleanup before termination.

The kernel reclaims kernel-managed resources such as the process's memory and file descriptors. Closing file descriptors normally releases kernel-managed file locks. However, application or external state can still be inconsistent because application cleanup did not execute. For example, an application workflow may be only partly complete, user-space buffered data may not have been explicitly flushed by the application, and an external or distributed lock may remain until its own lease or recovery mechanism clears it.

Sockets owned by the process are closed by the kernel, but the application cannot perform its own graceful protocol shutdown or send a final message. For database work, an uncommitted transaction may be rolled back when its connection closes, depending on the database, but a larger application-level business workflow can still remain incomplete.

The kernel records that the process was terminated by signal 9. For a child process, the parent can use wait or waitpid to obtain the termination status and determine that SIGKILL caused the termination. Many shells and container tools commonly represent signal 9 termination as status 137 because 128 + 9 = 137, but 137 is a tool convention rather than a universal kernel exit status.

SIGTERM, signal 15, is normally preferred first. SIGTERM can be caught and handled, so an application can stop accepting work, flush application buffers, close connections gracefully, release application-managed resources, and complete its shutdown logic. SIGKILL is appropriate as a last resort when a process is stuck or unresponsive, ignores SIGTERM or cannot complete graceful termination, or must be stopped immediately to protect the system.

One important edge case is a task in uninterruptible sleep, commonly shown as D state. SIGKILL can be pending for that task, but the task may not actually exit until the kernel wait causing that state finishes.

After using SIGKILL, verify that the process is gone and check application or external state that normally depends on cleanup before restarting the process or retrying work.

Technical Approach
  1. Prefer a graceful termination such as SIGTERM when the situation allows it.
  2. Give the process enough time to run its shutdown handling and exit.
  3. If graceful termination fails, decide whether forced termination is necessary to restore or protect the system.
  4. Use SIGKILL only when that forced stop is justified.
  5. Confirm that the process has actually exited.
  6. Check application and external state that may have depended on cleanup before restarting or retrying work.
  7. If the task is in uninterruptible sleep, understand that SIGKILL may remain pending until the kernel wait finishes.
Practical Insights

SIGKILL itself is operationally simple because the target application does not get a chance to handle it. The main cost is recovery risk rather than CPU or memory complexity. Forced termination can leave unfinished application work, external locks, partial workflows, or state that must be checked before restart. SIGTERM can take longer because it allows graceful cleanup, but that extra time usually reduces recovery work and the chance of inconsistent application state.

Why Interviewers Ask This

Interviewers want to know whether you understand the operational difference between forced and graceful process termination. A Cloud Engineer should know that SIGKILL cannot be caught, blocked, or ignored by the target process, that application cleanup does not run, that some application or external state may remain incomplete, how termination is reported, and why SIGTERM is normally the safer first choice.

Common interview mistakes

Common mistakes are saying SIGKILL can be caught or handled, assuming application cleanup runs, claiming kernel-managed resources remain allocated, or saying every SIGKILL always produces exit code 137. The kernel reclaims kernel-managed resources, while application or external state may remain incomplete. Another mistake is using SIGKILL as the normal first choice instead of trying SIGTERM. Also, SIGKILL does not guarantee immediate disappearance while a task remains blocked in uninterruptible sleep.

Interview tip

Start with the key contrast: SIGTERM asks a process to shut down gracefully, while SIGKILL forces termination with no process-level cleanup. Then explain kernel resource reclamation, possible application-state risks, termination reporting, the D-state edge case, and why SIGKILL should normally be the last resort.

Interviewer may ask next
What is the difference between SIGTERM and SIGKILL?

SIGTERM is signal 15 and is a graceful termination request. A process can catch SIGTERM and run shutdown logic such as flushing application buffers, closing connections, releasing application-managed resources, and completing cleanup. SIGKILL is signal 9 and cannot be caught, blocked, or ignored. The process therefore cannot run a signal handler or application cleanup before termination. SIGTERM is normally preferred first, while SIGKILL is used when graceful termination fails or an immediate forced stop is required.

Why might SIGKILL fail to make a process disappear immediately?

A task can be in uninterruptible sleep, commonly shown as D state, while waiting inside the kernel for an operation such as certain I/O to finish. SIGKILL can become pending, but the task may not complete termination until that kernel wait finishes. Repeatedly sending SIGKILL therefore does not necessarily make a D-state task disappear immediately.

8. How would you check a machine's I/O usage with sar?Observability And TroubleshootingMediumGoogle

Question Details

A Linux cloud host is suspected of storage-related pressure. Use sar over a defined sampling interval, state the command options and output fields you would inspect, and explain how the evidence distinguishes request volume, throughput, queueing, wait time, and device saturation. Do not declare storage the root cause without corroborating evidence.

Short Interview Answer (30-60 seconds)

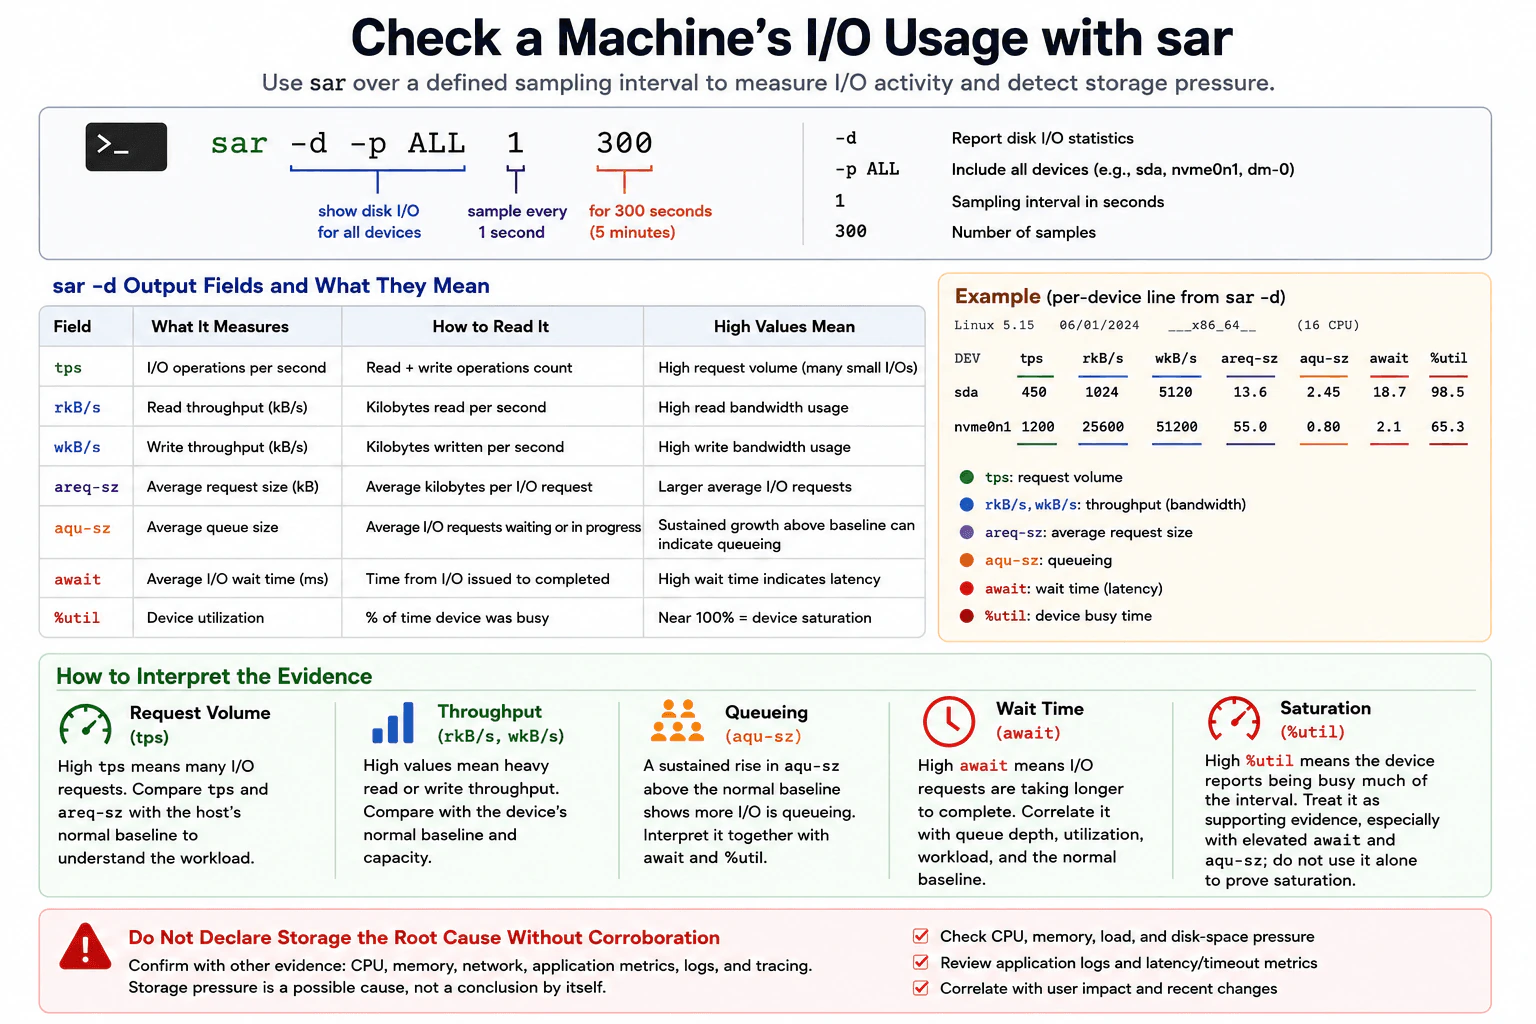
Run sar -d -p 1 300 and inspect tps, rkB/s, wkB/s, areq-sz, aqu-sz, await, and %util. Look for sustained changes from baseline and corroborate them with other host and application evidence before blaming storage.

Detailed Explanation

The goal is to find out whether the part of the machine that reads and saves data is struggling while the slowdown is happening. I would watch it for several minutes instead of judging one moment. I would separate how many jobs are arriving, how much data is moving, whether work is piling up, how long each job takes, and how busy the device stays. Then I would compare those observations with what is normal for that machine and check other parts of the system before deciding what actually caused the problem.

Useful Questions to Ask the Interviewer
  1. Are we investigating a live incident, or should I describe the normal troubleshooting procedure?
  2. Do we have a known healthy baseline for this host or device?
  3. Is the workload using local disks, virtual block storage, or another storage layer that also needs to be checked?
How would you check a machine's I/O usage with sar? diagram
How to Explain It in an Interview

I would start with a defined sampling window rather than a one-time snapshot. On standard sysstat, I would run sar -d -p 1 300. The -d option reports activity for each block device. The -p option makes device names easier to read; it does not take an ALL argument. By default, -d reports all devices unless the command is restricted with a device filter. The final 1 300 means one sample every second for 300 samples, so the observation lasts about five minutes.

For each device, I would read several fields together. tps is the number of I/O transfers per second, so it represents request volume. A high value means many I/O operations, but it does not tell me how much data is moving.

rkB/s and wkB/s show read and write throughput in kibibytes per second. These tell me how much data is being transferred. High throughput may be healthy if it is normal for the workload and within the device's capability.

areq-sz is the average request size in kibibytes. It gives context to tps and throughput. For example, many small requests can produce high tps without equally high throughput. Request size alone does not prove a random or sequential access pattern.

aqu-sz is the average queue length of requests issued to the device. A sustained rise above the normal baseline can indicate that more I/O is outstanding or queueing. I would not use a universal threshold because healthy values depend on the device, concurrency, workload, and storage stack.

await is the average time, in milliseconds, for I/O requests issued to the device to be served. It includes time spent waiting and being serviced. If await rises above baseline while aqu-sz also rises, requests are taking longer to complete and queueing is stronger evidence of storage pressure.

%util is the percentage of elapsed time during which I/O requests were issued to the device. For devices that serve requests serially, a value near 100% can indicate that the device is busy almost continuously. For modern SSDs, RAID, and other devices that handle requests in parallel, %util does not by itself show the device's performance limit. I would treat it as supporting evidence, not proof of saturation.

I would therefore read the signals as one story: tps shows request volume; rkB/s and wkB/s show throughput; areq-sz describes average request size; aqu-sz shows outstanding or queued work; await shows I/O completion delay; and %util shows device busy time.

The final decision must use correlated evidence. If aqu-sz and await rise above baseline, %util is also high where meaningful, and application latency or user impact worsens during the same interval, storage becomes a stronger hypothesis. I would still check CPU, memory, load, disk-space pressure, application metrics, logs, latency or timeout signals, recent changes, and the underlying cloud-storage service. Storage pressure is a possible cause, not a conclusion from one sar field.

Technical Approach
  1. Run sar -d -p 1 300 during the suspected problem window.
  2. Identify the device or devices serving the affected workload.
  3. Read tps for I/O request volume.
  4. Read rkB/s and wkB/s for read and write throughput.
  5. Use areq-sz to understand average request size.
  6. Compare aqu-sz with the normal baseline to identify sustained queueing or outstanding work.
  7. Check await to see whether I/O completion time is elevated.
  8. Use %util as supporting device-busy evidence, with extra caution for parallel devices such as SSDs and RAID.
  9. Correlate the same time window with CPU, memory, load, disk-space pressure, application metrics, logs, latency, timeouts, user impact, recent changes, and the underlying storage service.
  10. Call storage a likely bottleneck only when multiple observations support that conclusion and competing explanations have been checked.
Practical Insights

The command is lightweight because it reads operating-system counters instead of scanning application data. Sampling every second for five minutes produces 300 observations per device, so the amount of output grows with the number of devices and samples. The main cost is analysis: you must compare several fields over time and against a healthy baseline. A window that is too short can miss sustained pressure, while a very long or very frequent collection produces more data to review and retain. Exact field availability and interpretation can also vary with the installed sysstat version and the storage technology.

Why Interviewers Ask This

The interviewer wants to see whether you can use Linux host telemetry to investigate suspected storage pressure instead of guessing. A strong answer shows that you understand what the main sar -d fields represent, can separate request rate from data throughput and queueing, can recognize latency and device-busy evidence, and know that a single high metric does not prove a root cause. It also tests whether you use a defined sampling interval, compare against a healthy baseline, and correlate storage observations with evidence from the rest of the system.

Common interview mistakes

Common mistakes are taking one sample instead of observing a useful interval; treating high tps as a problem without considering throughput and request size; using an absolute aqu-sz threshold as proof of trouble; assuming high await identifies its own cause; and treating %util near 100% as automatic proof that storage is saturated. Another mistake is using legacy sector-based field names while describing their values as kilobytes. Also, on standard sysstat, -p is a standalone pretty-print flag, so sar -d -p ALL 1 300 should not be copied literally; use sar -d -p 1 300 to show all block devices unless you intentionally restrict them with a device filter.

Interview tip

Explain the fields as a diagnostic story: request volume, throughput, request size, queueing, wait time, then device busy time. Emphasize trends and correlation instead of one high number, and finish by saying you would corroborate the evidence before naming storage as the root cause.

Interviewer may ask next
What would make you more confident that storage is actually the bottleneck?

I would look for sustained evidence in the same problem window: aqu-sz rising above baseline, elevated await, meaningful device-busy evidence, and application latency or user impact worsening at the same time. I would compare the host with its healthy baseline or similar hosts and check CPU, memory, load, disk-space pressure, application metrics, logs, recent changes, and the underlying cloud-storage service. If those other layers look healthy while the storage signals degrade with the symptom, storage becomes a much stronger root-cause hypothesis.

Why should you not use %util near 100% by itself to declare the disk saturated?

%util reflects how much elapsed time the device was busy with I/O, but that does not map cleanly to maximum performance for devices that can process requests in parallel, such as modern SSDs and RAID. I would interpret %util with await, aqu-sz, throughput, workload behavior, the normal baseline, and user-visible symptoms. High busy time together with sustained queueing and increased wait time is much stronger evidence than %util alone.

9. How would you capture and analyze network traffic with tcpdump?Observability And TroubleshootingMediumGoogle

Question Details

On a Linux cloud host, describe a capture that selects the correct interface and filters by the relevant source or destination, protocol, and port. Explain how you would preserve packet data for later analysis, limit capture risk and volume, and use packet direction, timing, flags, and responses to support or reject a network-path hypothesis.

Short Interview Answer (30-60 seconds)

I would capture on the interface carrying the suspected traffic, filter narrowly by host, protocol, and port, bound the capture by time and packet count, and save a pcap. Then I would analyze direction, timing, TCP flags, retransmissions, and responses to support or reject the network-path hypothesis.

Detailed Explanation

The goal is to watch only the small amount of information related to the connection problem, save it so it can be checked later, and avoid collecting more than needed. First, find which connection on the machine carries the traffic between the two computers. Then narrow the collection to the other machine and the service being tested. Keep the collection short and limited. Afterward, compare what leaves the machine with what comes back, how long replies take, and whether the expected exchange finishes. Use that evidence to decide what part of the path to check next.

Useful Questions to Ask the Interviewer
  1. Which source, destination, protocol, and port are involved in the suspected network problem?
  2. Which Linux host and interface are on the path I should observe?
  3. Is the hypothesis about outbound connectivity, the return path, a firewall, routing, or the backend service?
  4. Are there restrictions on capturing payload data or retaining packet files?
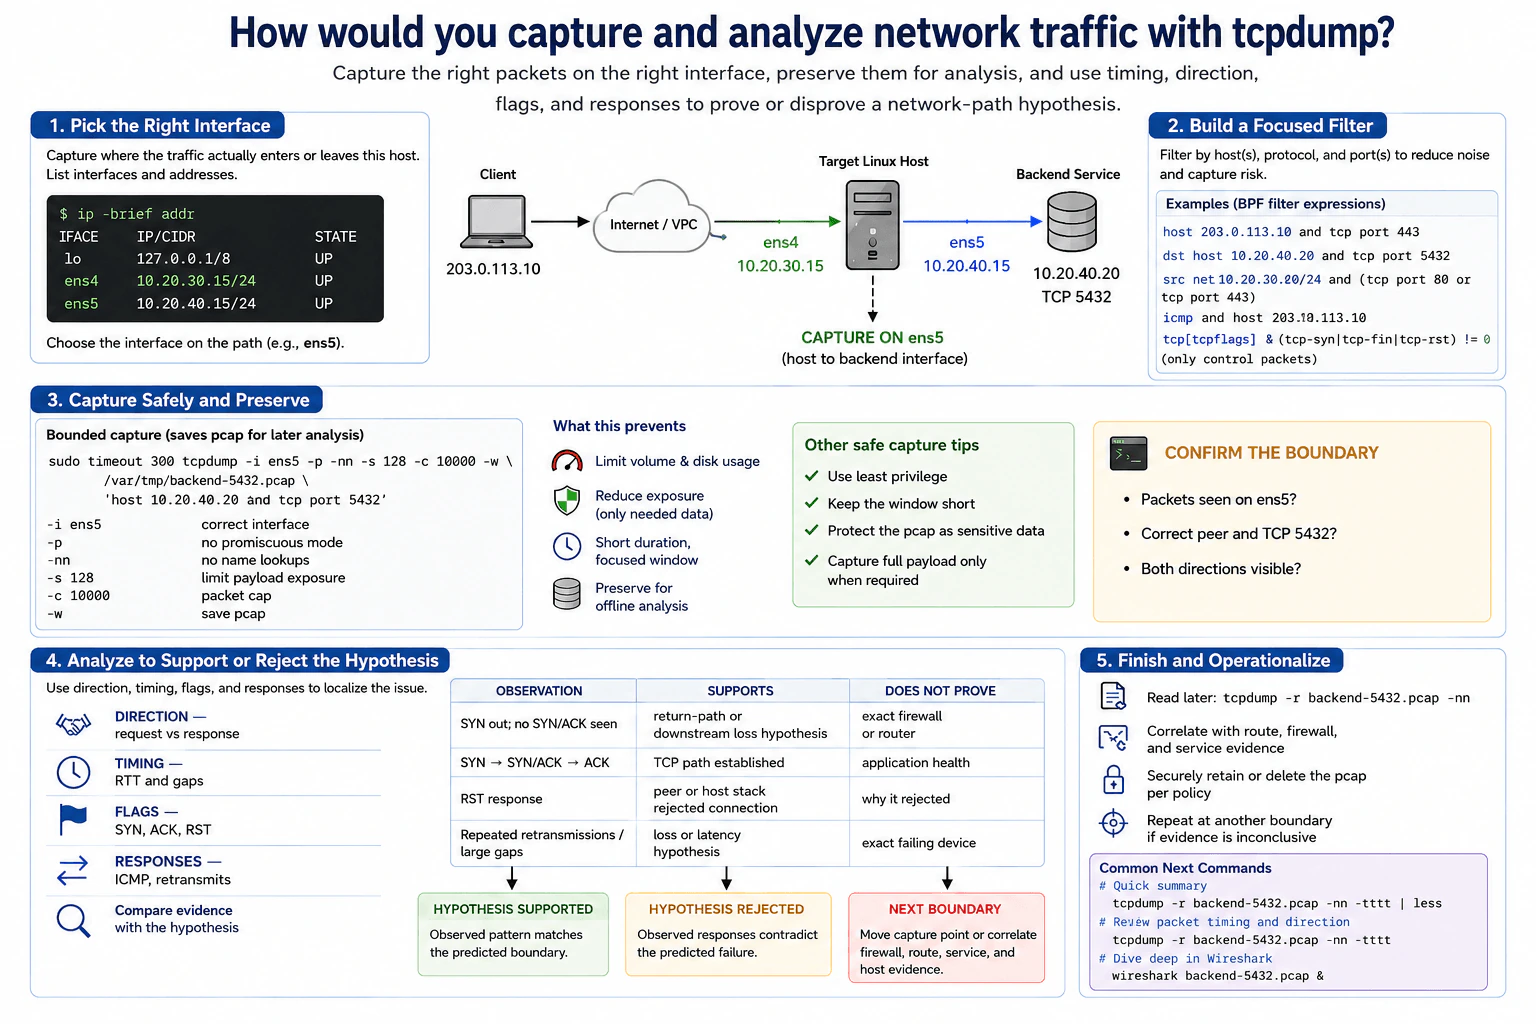
How would you capture and analyze network traffic with tcpdump? diagram
How to Explain It in an Interview

I would start by defining the hypothesis and choosing the correct capture boundary. In the diagram, the Linux host has ens4 toward the client side and ens5 toward the backend. Because the hypothesis concerns the backend at 10.20.40.20 on TCP port 5432, I would capture on ens5. I would verify interface names and addresses first with ip -brief addr instead of assuming an interface name.

Next I would use a Berkeley Packet Filter, or BPF, to collect only relevant traffic. The focused filter for this case is host 10.20.40.20 and tcp port 5432. Other valid examples are dst host 10.20.40.20 and tcp port 5432, src net 10.20.30.0/24 and (tcp port 80 or tcp port 443), icmp and host 203.0.113.10, or tcp[tcpflags] & (tcp-syn|tcp-fin|tcp-rst) != 0 when I only need TCP control packets. Narrow filters reduce noise, disk use, processing, and unnecessary exposure of unrelated traffic.

For a bounded production capture, I would use a command such as sudo timeout 300 tcpdump -i ens5 -p -nn -s 128 -c 10000 -w /var/tmp/backend-5432.pcap 'host 10.20.40.20 and tcp port 5432'. -i ens5 selects the correct interface. -p avoids promiscuous mode when it is unnecessary. -nn disables hostname and service-name lookups. -s 128 limits bytes captured from each packet to reduce payload exposure, although that can truncate data that might later be needed. -c 10000 caps the packet count. -w preserves the packets in a pcap file, and timeout 300 limits the capture to five minutes.

I would treat the pcap as sensitive evidence. I would use the least privilege needed to run tcpdump, keep the capture window short, store the pcap in a protected location, and capture full packet payloads only when the investigation requires them. Before drawing conclusions, I would confirm that packets are actually visible on ens5, that the peer and TCP port 5432 are correct, and that the capture contains the packet directions needed for the hypothesis.

Then I would analyze four kinds of evidence. Direction tells me whether the request leaves and whether a response returns. Timing shows round-trip delay and unusually large gaps. TCP flags such as SYN, SYN/ACK, ACK, and RST show connection-state behavior. Responses such as ICMP errors and retransmissions can support hypotheses about loss, blocking, reachability, or latency.

The interpretation must remain limited to what the capture proves. If I see a SYN leave but no SYN/ACK return, that supports a downstream-loss or return-path hypothesis, but it does not prove which firewall or router is responsible. If I see SYN, SYN/ACK, and ACK, the TCP path was established, but that does not prove the application is healthy. If I see an RST response, that supports the conclusion that the peer or host networking stack rejected the connection, but the packet capture alone may not explain why. Repeated retransmissions or large timing gaps support a loss or latency hypothesis, but they do not identify the exact failing device.

For offline analysis, I can read the saved capture with tcpdump -r backend-5432.pcap -nn or review timing and direction with tcpdump -r backend-5432.pcap -nn -tttt. If deeper decoding is required, I can open the same pcap in Wireshark. I would correlate packet evidence with routing, firewall, service, and host evidence. If the evidence is inconclusive, I would move the capture point to another boundary and repeat the same hypothesis-driven test.

Technical Approach
  1. Define the network-path hypothesis and identify the source, destination, protocol, and port.
  2. Inspect the Linux host interfaces and select the interface that actually carries the suspected traffic.
  3. Build the narrowest useful BPF filter for the relevant peer and service.
  4. Bound the capture by duration, packet count, and snap length, and save it to a protected pcap file.
  5. Confirm that the expected peer, port, and packet directions appear in the capture.
  6. Analyze request and response direction, timing gaps, TCP flags, retransmissions, and ICMP responses.
  7. Compare the observed packet pattern with the predicted failure pattern.
  8. Support or reject the hypothesis without claiming more than the capture proves.
  9. Correlate the result with routing, firewall, service, and host evidence.
  10. Move the capture to another boundary if the evidence remains inconclusive.
Practical Insights

The main cost is proportional to how much traffic is captured. A broad or long capture can consume disk space, add processing overhead, and collect sensitive data. Narrow filters, a limited snap length, a packet-count cap, and a short time window reduce those risks. Using a smaller snap length can hide payload or header details that later analysis needs, so it is a privacy-versus-diagnostic-detail tradeoff. Offline analysis adds storage and operator time but lets engineers study evidence without repeatedly capturing production traffic.

Why Interviewers Ask This

This question tests whether the candidate can safely collect packet-level evidence on a Linux cloud host, choose the correct capture boundary, write focused tcpdump filters, control capture volume and sensitive-data exposure, preserve evidence for later analysis, and interpret packet direction, timing, TCP flags, retransmissions, and responses without overclaiming what a single capture point proves.

Common interview mistakes

Common mistakes are capturing on the wrong interface, using an overly broad filter, forgetting to save the capture for offline analysis, running an unbounded capture, capturing full payloads unnecessarily, leaving sensitive pcap files unprotected, and assuming one packet pattern proves an exact root cause. A SYN with no visible SYN/ACK does not prove a particular firewall failed. A completed TCP handshake does not prove the application is healthy. An RST does not by itself explain why the connection was rejected. Other mistakes include ignoring packet direction and timing, using invalid BPF syntax, or accidentally using options from another packet-analysis tool as if they were tcpdump options.

Interview tip

Present the answer as a hypothesis-driven sequence: choose the capture boundary, filter narrowly, bound and preserve the capture, confirm that you captured the expected traffic, inspect direction, timing, flags, and responses, and then state both what the evidence supports and what it does not prove. Emphasizing safe production capture and evidence limits shows stronger troubleshooting judgment than simply listing tcpdump flags.

Interviewer may ask next
What would it mean if you see the client SYN leave the host but never see a SYN/ACK return?

It supports a hypothesis that the response is being lost, blocked, or never generated somewhere downstream or on the return path. It does not identify the exact firewall, router, or device from this capture alone. I would correlate the result with routing, firewall, service, and host evidence and, if possible, capture at another boundary closer to the backend to determine where the expected response disappears.

How would you reduce the production risk of running tcpdump on a busy cloud host?

I would capture only on the required interface, use the narrowest host, protocol, and port filter possible, avoid promiscuous mode when it is unnecessary, disable name lookups, limit the snap length when full payload is not needed, cap the packet count, set a short capture duration, save the pcap in a protected location, use least privilege, and securely retain or delete the file according to policy.

Disclaimer: This interview guide is for educational and informational purposes only. It is designed to help readers prepare, but it does not guarantee any interview result, hiring decision, offer, or outcome. Interview questions, hiring criteria, and preferred answers can vary by employer, interviewer, industry, location, and time. The examples and explanations reflect the authors' research and judgment, are provided without warranties of any kind, and should not be treated as the only correct approach. Diagrams are simplified illustrations intended to highlight the main components and their interactions; actual systems and implementations may be more complex. Alternative approaches may be equally valid or better suited to a particular question, context, or interviewer. To the fullest extent permitted by applicable law, the author, contributors, and publisher are not liable for decisions made, actions taken, or losses incurred based on this guide.

Company Notice: This guide is an independent educational resource and is not affiliated with, endorsed by, sponsored by, or approved by the company named in this guide. Company names are used only to identify interview experiences commonly reported by candidates. Interview practices can change without notice, and inclusion of company-specific content does not mean these questions are official, complete, or guaranteed to be asked. To the fullest extent permitted by law, the author, contributors, and publisher are not responsible for outcomes related to use of this material.

Content Accuracy and Verification: To the fullest extent permitted by applicable law, we do not represent or warrant that interview guides, questions, answers, examples, or diagrams are accurate, complete, current, error-free, or suitable for any particular purpose. You are responsible for independently reviewing and verifying the information before relying on it.