This interview guide is for educational and informational purposes only. It is designed to help readers prepare, but it does not guarantee any interview result, hiring decision, offer, or outcome. Interview questions, hiring criteria, and preferred answers can vary by employer, interviewer, industry, location, and time. All answers, examples, and explanations in this guide are suggested examples for interview preparation, not definitive answers or instructions for professional practice. They are based on research and judgment, are provided without warranties of any kind, and should be adapted to the question, role, and applicable laws and professional requirements. Diagrams are simplified illustrations intended to highlight the main concepts and their relationships; actual situations, systems, and practices may be more complex. Alternative approaches may be equally valid or better suited to a particular question, context, or interviewer. To the fullest extent permitted by applicable law, the contributors and publisher are not liable for decisions made, actions taken, or losses incurred based on this guide.
State Laws and Professional Responsibilities
Laws and requirements governing an occupation vary by state and jurisdiction. You are responsible for checking the current laws, licensing requirements, and scope-of-practice rules that apply to your location and role, and for ensuring that your answers and actions comply with them. Adapt examples in this guide to those requirements. This guide is not legal advice.
Identity, Image, and Privacy Notice
To respect individual privacy, some names, profile photographs, avatars, biographical details, and other identifying information displayed in this guide may be replaced with pseudonyms, licensed stock images, illustrative avatars, composite images, or representative descriptions. Unless a person is expressly identified as an actual contributor, a displayed name, image, or profile should not be understood as depicting or identifying a specific candidate, interviewer, employee, or other real individual. These representations are provided for editorial and illustrative purposes only and do not imply endorsement, employment, participation, or affiliation with this guide or any company mentioned in it. Any resemblance to an actual person is coincidental.
Company Notice
This guide is an independent educational resource and is not affiliated with, endorsed by, sponsored by, or approved by the company named in this guide. Company names identify reported interview experiences or the employer context of clearly labeled original practice exercises. Interview practices can change without notice, and inclusion of company-specific content does not mean these questions are official, complete, or guaranteed to be asked. To the fullest extent permitted by law, the author, contributors, and publisher are not responsible for outcomes related to use of this material.
Content Accuracy and Verification
To the fullest extent permitted by applicable law, we do not represent or warrant that interview guides, questions, answers, examples, or diagrams are accurate, complete, current, error-free, or suitable for any particular purpose. You are responsible for independently reviewing and verifying the information before relying on it.
Questions or comments?
Contact us for general questions, or share feedback, technical corrections, and comments with the community.
1. How would you design the collection layer for GPU telemetry at both one-second and thirty-second resolution?Cloud ArchitectureEasyNvidia
i Question Details
A large GPU fleet must emit per-GPU telemetry at one-second resolution and a separate thirty-second operational view. Design collector placement, host and GPU identity, sampling, buffering and batching boundaries, stream separation, schema evolution, and the handoff into durable ingestion. Keep fleet size symbolic and explain how the design preserves event time and metric identity before storage or aggregation.
Short Interview Answer (30-60 seconds)
At a high level, the goal is to collect GPU telemetry without losing metric identity or event time. The main challenge is supporting detailed one-second data and a cheaper thirty-second operational view at the same time. I would split the design into host collection, two separate streams, and durable ingestion. Each host samples locally, adds stable host and GPU labels, buffers and compresses data, then sends both streams through stateless collectors. The trade-off is higher cost for the one-second path.
Detailed Explanation
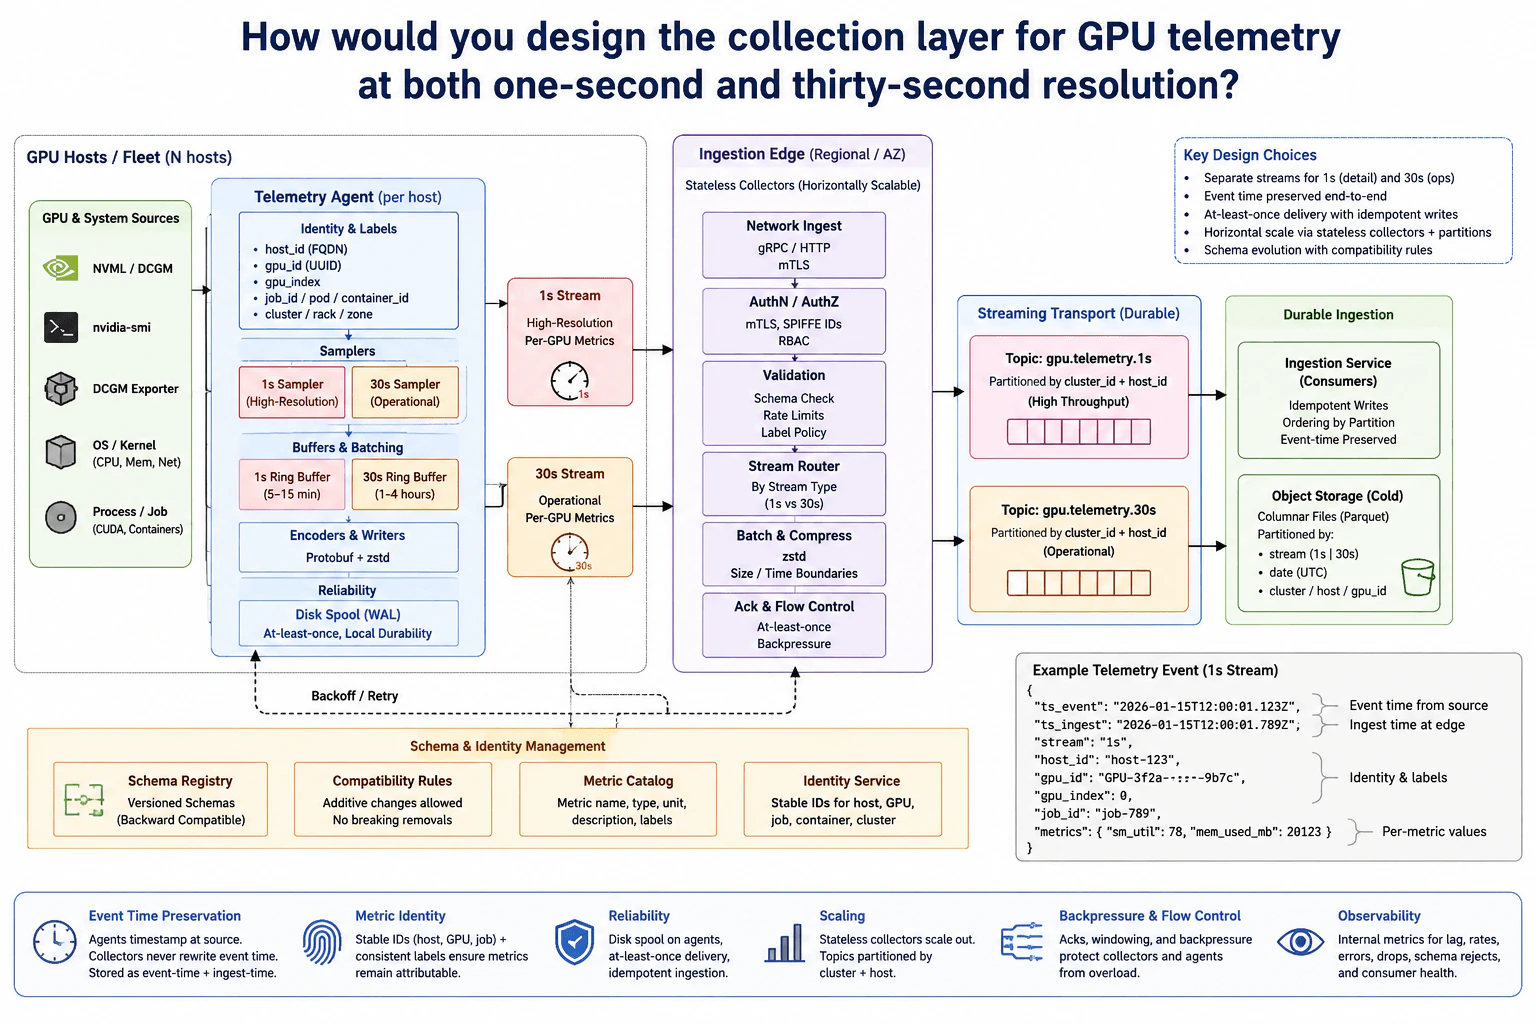
The system must collect measurements from every GPU while keeping each measurement tied to the correct machine and device. It needs two views of the fleet. One keeps detailed one-second measurements. The other provides a thirty-second operational view. The difficult part is keeping the original measurement time and stable metric identity when hosts, collectors, or network links slow down. The diagram solves this with a Telemetry Agent on every host, separate sampling paths, local buffering, controlled ingestion, and a durable stream handoff before later storage.
Useful Questions to Ask the Interviewer
How long should the one-second and thirty-second telemetry be retained after durable ingestion?
What delay is acceptable when a host temporarily cannot reach the Ingestion Edge?
Which GPU and workload labels must remain stable across restarts or rescheduling?
How to Explain It in an Interview
1. Collect and identify telemetry on each host
I would collect metrics close to where they are produced. Each GPU host runs one Telemetry Agent. Its sources include NVML / DCGM, nvidia-smi, DCGM Exporter, OS / Kernel metrics, and Process / Job information.
The agent adds Identity & Labels before data leaves the host. These include host_id, gpu_id, gpu_index, job_id, pod or container_id, and cluster, rack, or zone. Stable identity matters because later systems must know exactly which GPU produced each metric.
2. Create separate one-second and thirty-second paths
The agent has a 1s Sampler and a separate 30s Sampler. The 1s Stream carries high-resolution per-GPU metrics. The 30s Stream carries the operational per-GPU view.
Each path has its own Ring Buffer. The diagram shows about 5–15 minutes for the 1s buffer and 1–4 hours for the 30s buffer. Encoders & Writers use Protobuf with zstd compression. A local Disk Spool, or WAL, provides local durability for retries and at-least-once delivery.
3. Process both streams at the Ingestion Edge
Both streams go to the regional or availability-zone Ingestion Edge. Network Ingest accepts gRPC / HTTP and uses mTLS. AuthN / AuthZ uses mTLS, SPIFFE IDs, and RBAC.
Validation checks the schema, rate limits, and label policy. The Stream Router keeps the 1s and 30s paths separate. Batch & Compress uses zstd with size or time boundaries. Ack & Flow Control provides acknowledgements, at-least-once delivery, and backpressure, which means slowing senders when receivers cannot keep up.
4. Hand off to durable streaming
The high-resolution path enters topic gpu.telemetry.1s. The operational path enters topic gpu.telemetry.30s. Both are partitioned by cluster_id and host_id. This supports horizontal scaling while preserving ordering inside each partition.
The durable streams then hand data to the Durable Ingestion area shown in the diagram. Ingestion Service consumers use idempotent writes, which means repeated delivery does not create an incorrect extra result. Cold Object Storage keeps columnar Parquet data partitioned by stream, UTC date, cluster, host, and gpu_id.
5. Preserve time, identity, schemas, and reliability
Agents timestamp metrics at the source. Collectors never rewrite that event time. The example telemetry event keeps ts_event and ts_ingest separately, so measurement time and arrival time remain distinct.
The Schema Registry stores versioned schemas. Compatibility Rules allow additive changes and avoid breaking removals. The Metric Catalog defines metric name, type, unit, description, and labels. The Identity Service keeps stable IDs for hosts, GPUs, jobs, containers, and clusters.
Stateless collectors scale horizontally. Partitioning spreads work by cluster and host. Backpressure protects collectors and agents from overload. Observability tracks lag, rates, errors, drops, schema rejects, and consumer health. The main trade-off is cost. One-second telemetry gives much more detail, while the thirty-second stream is cheaper for routine operations.
Practical Complexity & Trade-offs
The benefit is that the one-second and thirty-second paths serve different needs without mixing their traffic. The one-second path gives much finer detail, but it creates more data and costs more to move and keep. The thirty-second path has lower volume and works well for normal operational views. Local ring buffers and the Disk Spool help when the network or collectors are slow. The downside is that at-least-once delivery can send an event more than once. Idempotent writes handle those repeats. Partitioning helps the system scale, but ordering is kept only inside each partition.
Why Interviewers Ask This
Interviewers use this question to test whether a candidate can separate collection, identity, buffering, transport, and durable ingestion clearly. They also want to see whether the candidate understands event time, schema changes, partitioning, retries, and backpressure. The important skill is judgment. A strong answer explains why one-second and thirty-second telemetry need different paths while keeping both paths reliable and easy to operate.
Interviewer may ask next
What would you change if the Ingestion Edge became unreachable for several minutes?
I would keep the same design and use the buffering already shown on each Telemetry Agent. The 1s Ring Buffer holds a shorter high-resolution window. The 30s Ring Buffer holds a longer operational window. The Disk Spool, or WAL, gives the host a local durable place for telemetry that has not been acknowledged yet.
Ack & Flow Control already provides backpressure. When the receiving side cannot keep up, the sender should slow down instead of allowing memory use to grow without a limit. The retry path sends buffered data again when the Ingestion Edge becomes reachable.
The original event time must remain unchanged during a retry. ts_event still represents when the GPU measurement happened. ts_ingest records when the edge later accepted it. host_id, gpu_id, and other identity labels also stay unchanged.
Because delivery is at-least-once, some events may be sent again. Ingestion Service consumers use idempotent writes so repeated delivery does not create an incorrect extra result. The main downside is that local buffering has limited capacity during a long outage.
How would you add new GPU metrics without breaking older collectors or consumers?
I would keep the same collection and streaming design and use the Schema Registry and Compatibility Rules shown in the diagram. Each telemetry schema is versioned. A new metric should normally be added as a new field instead of changing or removing an existing field.
The Metric Catalog should define the metric name, type, unit, description, and labels. This keeps metric identity consistent across agents, collectors, and consumers. Validation at the Ingestion Edge checks the schema before an event enters the 1s or 30s durable stream.
Older consumers can continue reading the fields they already understand because the schema remains backward compatible. New consumers can start using the new field when they are ready. Stable host and GPU identity fields should remain unchanged during this process.
The main downside is that compatibility rules limit how freely an existing schema can change. Removing or redefining an old field requires more coordination because older producers or consumers may still depend on it.
2. How would you use the same GPU telemetry data for real-time and offline processing?NEWCloud ArchitectureHardNvidia
i Question Details
Design a shared data plane in which live operational consumers and later batch or analytical jobs use consistent telemetry. Define immutable inputs, stream and batch boundaries, event identity and time, storage tiers, checkpoints, derived state, replay and backfill, schema versions, publication, and how real-time and recomputed results are reconciled.
Short Interview Answer (30-60 seconds)
At a high level, I would collect GPU telemetry once and let both real-time and offline processing use the same recorded events. The main challenge is getting fast operational results while keeping later recomputation consistent. I would divide the design into secure ingestion, a real-time path, and an offline path. Both paths use the same event identity, event time, schema version, and stored history. Real-time results arrive quickly, while offline jobs can recompute complete results and publish corrected derived data.
Detailed Explanation
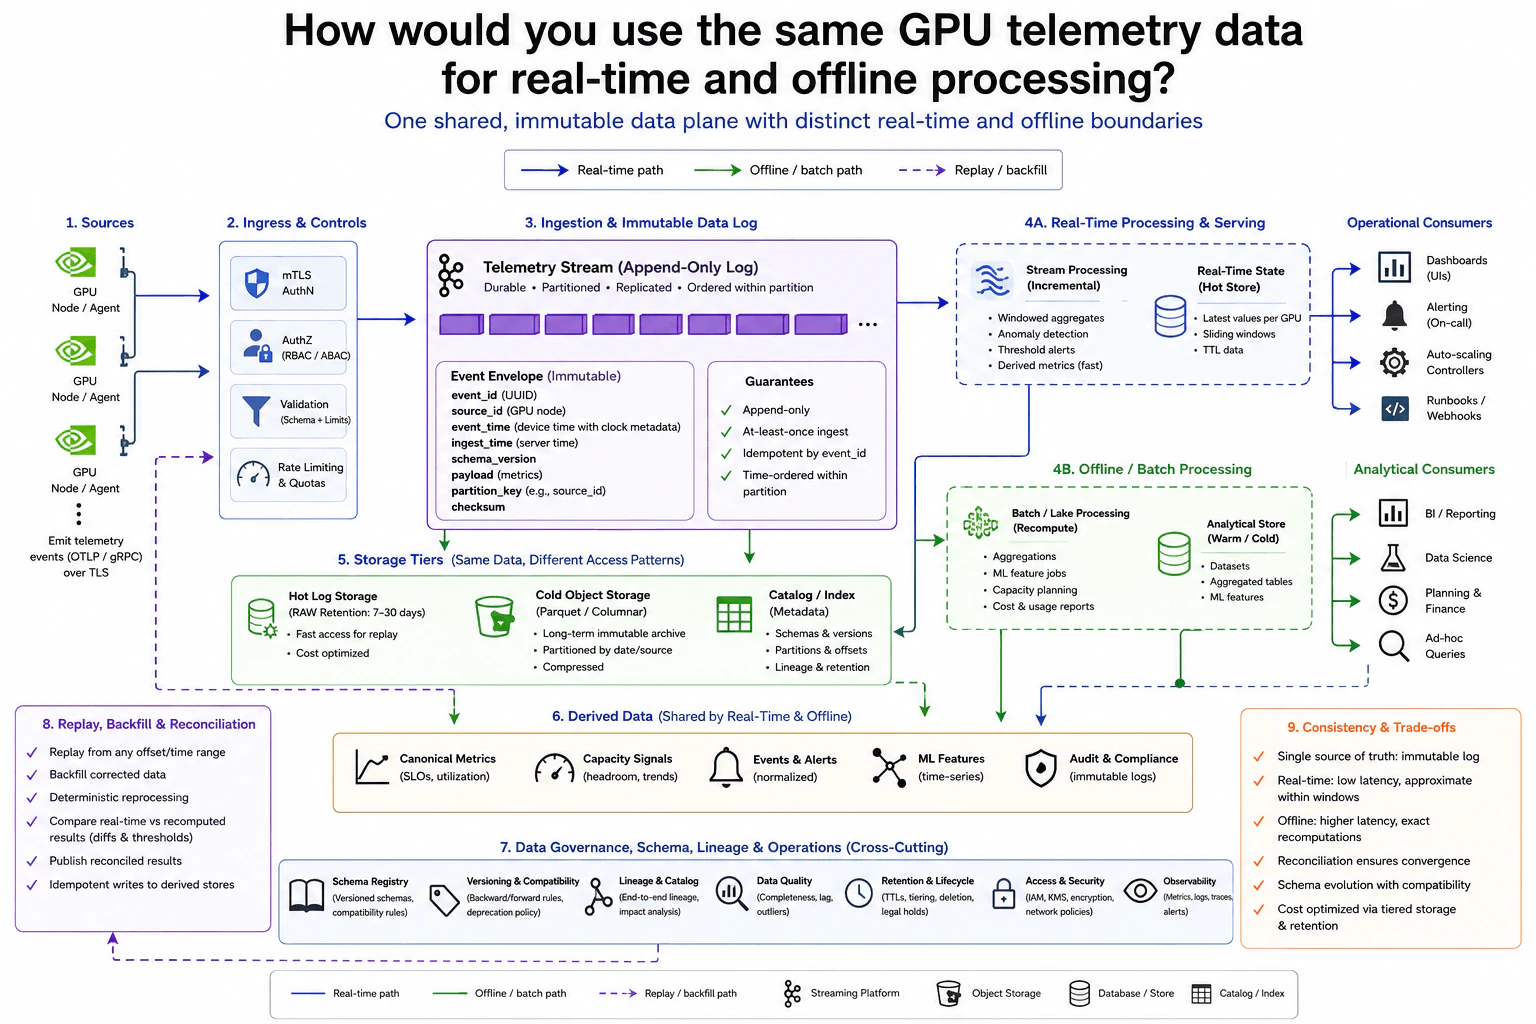
The goal is to collect GPU telemetry once and reuse the same information for two needs. Operations teams need fresh metrics, alerts, and scaling signals quickly. Analytical jobs need a longer history for reports, planning, and model features. The hard part is making both paths understand an event in the same way, even when events arrive twice, arrive late, or must be processed again. The diagram solves this with one append-only telemetry stream, shared storage tiers, separate real-time and offline processing, and a replay path that makes recomputed results converge with earlier results.
Useful Questions to Ask the Interviewer
How quickly must dashboards, alerts, and scaling signals react?
How long should recent raw telemetry stay in Hot Log Storage?
How long should Cold Object Storage keep historical telemetry?
Which real-time results may be approximate before recomputation?
What schema compatibility rules are required during producer changes?
How to Explain It in an Interview
1. Start with secure telemetry ingestion
I would start by sending GPU node or agent telemetry through one controlled entry path. The diagram applies mTLS authentication, authorization, schema validation, rate limits, and quotas before an event enters the Telemetry Stream.
Each event carries an event_id, source_id, event_time, ingest_time, schema_version, payload, partition_key, and checksum. The event_id identifies the same event during retries or replay. Event time says when the GPU produced the event. Ingest time says when the platform received it.
2. Use one append-only log as the shared input
The Telemetry Stream is the single shared record for both processing paths. It is append-only, so existing events are not changed in place. It is durable, partitioned, replicated, and ordered within a partition.
The diagram shows at-least-once ingestion. That means the same event can appear again. Consumers therefore use event_id to make repeated processing safe. The source_id can be used as the partition key so telemetry from one source keeps a useful processing order.
3. Run the real-time path for operational consumers
Stream Processing reads new events and performs windowed aggregation, anomaly detection, threshold alerts, and fast derived metrics. Real-Time State keeps the latest values per GPU, sliding windows, and short-lived state.
These results feed dashboards, on-call alerting, auto-scaling controllers, and runbooks or webhooks. This path is optimized for low delay. Results inside an active time window may still change as more telemetry arrives.
Processing progress can be represented by partition offsets. Those offsets act as restart points, so processing can continue from a known position after a restart.
4. Keep the same data for offline processing
The same telemetry is also placed into storage tiers. Hot Log Storage keeps recent raw telemetry for fast replay. Cold Object Storage keeps a compressed, long-term archive partitioned by date and source. The Catalog / Index tracks schemas, versions, partitions, offsets, lineage, and retention.
Batch / Lake Processing reads this stored history for aggregations, ML feature jobs, capacity planning, and cost or usage reports. Results go into the Analytical Store for BI, data science, planning, finance, and ad-hoc queries.
5. Replay, backfill, and publish consistent derived results
If processing logic changes or data must be corrected, the system can replay an offset or time range. It can also backfill corrected data and run the same deterministic processing again.
The replay path compares real-time and recomputed results using defined differences and thresholds. Reconciled results are published into shared derived data such as canonical metrics, capacity signals, normalized events and alerts, and ML features. Repeated writes remain safe. Schema rules, lineage, data quality, retention, access controls, and observability support both processing paths.
Practical Complexity & Trade-offs
The benefit is that both processing paths start from the same recorded telemetry. This reduces disagreements caused by separate input systems. The real-time path gives dashboards and alerts low delay, but values inside an active window may still change. Offline processing takes longer, but it can scan stored history and recompute results. Replay makes recovery and corrections possible. The downside is extra storage and compute because telemetry is kept in several tiers and may be processed again. We accept that cost because the design gives fast operations, long-term analysis, and a clear way to make recomputed results replace earlier results when needed.
Why Interviewers Ask This
Interviewers ask this to see whether you can design one data plane for workloads with different speed needs. They want to test how you handle event identity, event time, duplicate delivery, schemas, storage tiers, processing progress, replay, and recomputation. They also want to see whether you can explain why fast results may be temporary while later processing produces corrected derived data.
Interviewer may ask next
What would you change if late GPU telemetry arrives after a real-time window has already produced a result?
I would keep the same architecture and use event_time to decide which window the late event belongs to. The event keeps its original event_id, source_id, event_time, and schema_version, so both processing paths still identify it in the same way.
For the real-time path, Stream Processing can update the affected derived state when the window rules allow it. The later Batch / Lake Processing job can read the durable raw telemetry and recompute that time range from stored data. The Replay, Backfill & Reconciliation path then compares the real-time value with the recomputed value using the defined differences and thresholds.
If the recomputed value should win, the system publishes that reconciled result into the shared derived data. Repeated writes remain safe by using the event identity. The downside is that dashboards can briefly show an earlier value before the late event is included.
How would you handle a telemetry schema change without breaking real-time and offline processing?
I would keep the same data plane and use the schema_version already stored in every Event Envelope. The Schema Registry would hold the supported schema versions and the backward or forward compatibility rules shown in the diagram.
Ingress validation would reject telemetry that does not match an accepted schema. Stream Processing would read schema_version and handle the versions it supports. Batch / Lake Processing would use the same version information when reading historical data from Cold Object Storage. The Catalog / Index would keep schema, partition, offset, lineage, and retention metadata for those datasets.
If transformation rules change, I could replay old telemetry or run a backfill with the correct versioned logic. The downside is that processors may need to support several schema versions during a migration, which increases testing and operational work.
3. How should a CI pipeline tag and publish a container image to a registry?DevOpsEasyNvidia
i Question Details
A build has produced a container image for a cloud service. Define the immutable image identity, human-readable tag policy, registry path, authentication, push sequence, metadata and build provenance, duplicate-tag behavior, failed-upload handling, and the evidence that the published digest is the artifact approved by the build.
Short Interview Answer (30-60 seconds)
I would build the image once, add useful human readable tags, authenticate to the registry with short lived credentials, push every required tag, then capture the published registry manifest digest and use that digest as the approved artifact identity. Tags are convenient pointers and may move unless registry policy blocks reassignment. The digest identifies the exact published content. I would also record source revision, build metadata, provenance, scan evidence, and any signature against that same digest.
Detailed Explanation
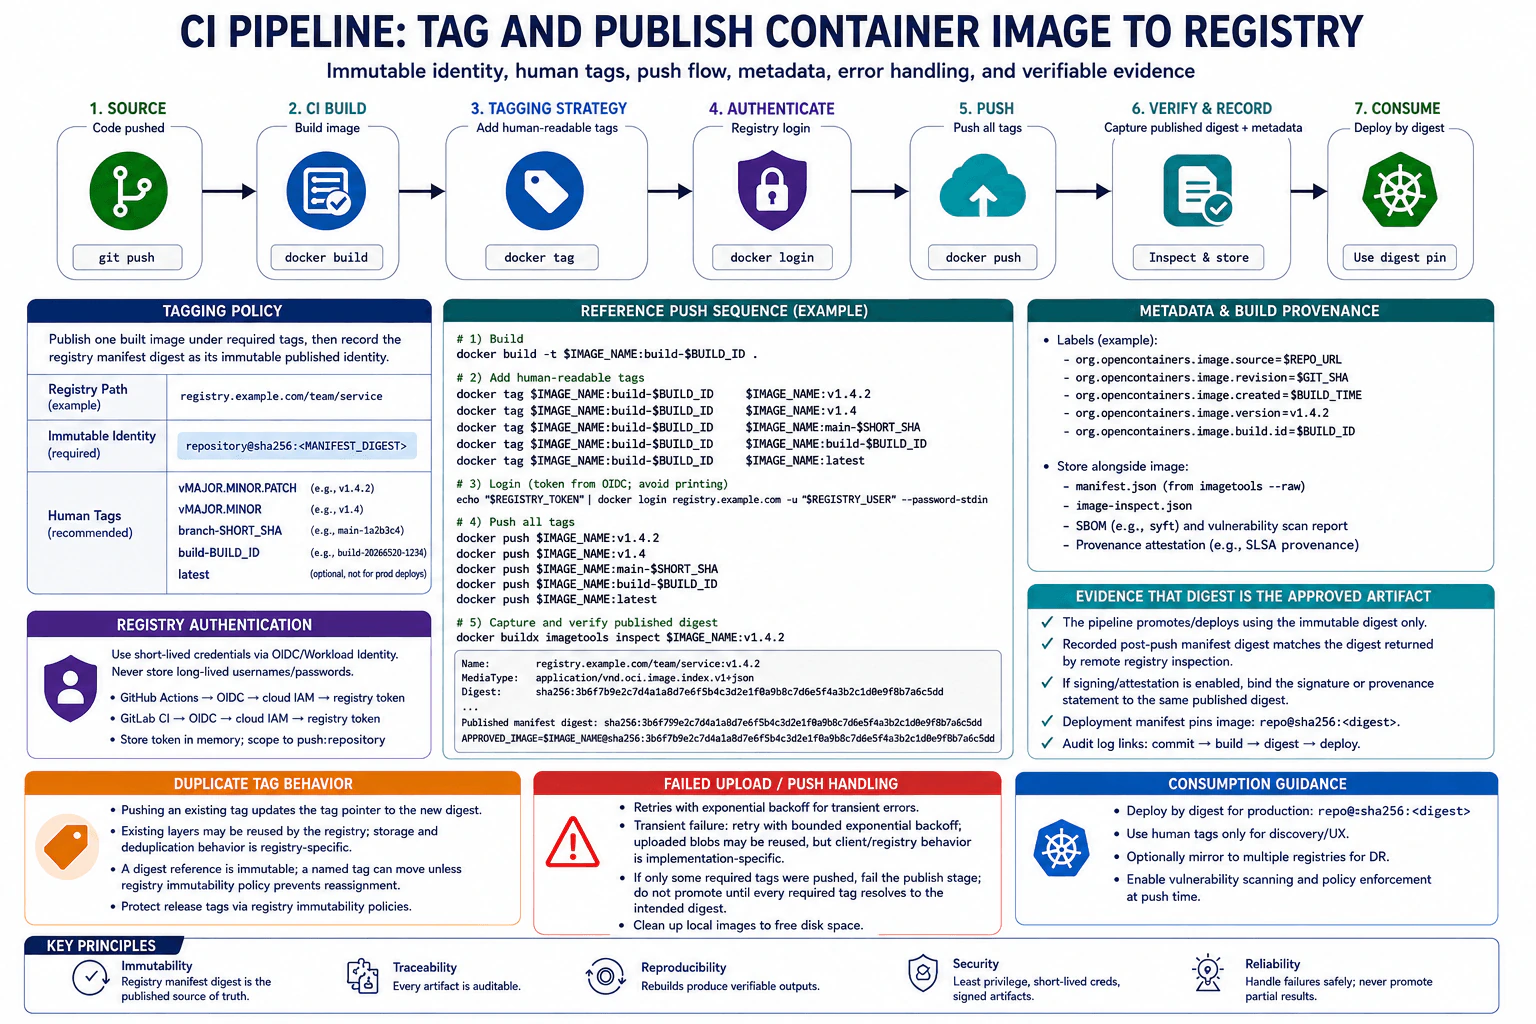
The pipeline should publish one built image in a way that is easy for people to recognize and exact for machines to verify. It gives the image useful names, sends it to the chosen registry, records where the build came from, checks the final stored result, and keeps evidence for later deployment. It also needs safe login behavior and a clear response when only part of the publishing work succeeds. The key idea is simple: friendly names can change, while the final stored fingerprint identifies the exact approved image.
Useful Questions to Ask the Interviewer
Can existing tags move to a new image, or does the registry enforce tag immutability?
Which human readable tags are required for a release?
Is signing or provenance attestation required?
How to Explain It in an Interview
I would build the container image once, then add the required human readable tags to that same local image. Useful tags can include a version, a branch plus commit value, a build ID, and optionally latest for discovery. I would not treat any tag as the immutable identity.
The registry path should be explicit, such as registry.example.com/team/service. The pipeline should authenticate with short lived workload credentials or another least privilege identity, and it should avoid printing secrets in logs.
Next, I would push every required tag. After the push, I would inspect the remote image and capture the published registry manifest digest. The approved reference should use the repository plus digest form, such as repository@sha256:<digest>. Production deployment should pin that digest so the exact approved content is selected even if a named tag later moves.
I would also record the source revision, build ID, creation time, version, image metadata, SBOM, vulnerability scan result, and provenance information when those controls are used. If signing or attestation is enabled, it should bind to the same published digest.
If a named tag already exists, pushing it can move the tag to a new digest unless registry policy prevents reassignment. The old digest remains a distinct content identity. On a transient push failure, the pipeline should retry with bounded exponential backoff. The client or registry may reuse uploaded blobs, but that behavior is implementation specific. If only some required tags are published, the stage should fail and promotion should wait until every required tag resolves to the intended digest.
Why Interviewers Ask This
Interviewers ask this to see whether a candidate understands container image identity, registry publishing, secure authentication, traceability, and safe release behavior. They want to know whether the candidate can separate mutable tags from an immutable registry manifest digest, handle partial publication safely, and prove that deployment uses the exact artifact approved by the build.
Common interview mistakes
Common mistakes include treating a tag as an immutable identity, trying to derive the final registry digest before publication, rebuilding separately for different tags, deploying production by latest, storing long lived registry passwords in CI, printing credentials in logs, assuming every client and registry resumes interrupted uploads in the same way, ignoring partial tag publication, and recording a digest without verifying it against the remote registry. Another mistake is approving one digest but deploying through a mutable tag that can later point somewhere else.
Interview tip
Start with the main rule: tags are convenient names, while the registry manifest digest is the immutable published identity. Then walk through build, tagging, secure login, push, remote digest capture, metadata, failure handling, and deployment by digest. Mention that partial publication must block promotion. That shows both CI knowledge and production judgment.
Interviewer may ask next
What should the pipeline do if some required tags are pushed successfully and another required tag fails?
The pipeline should fail the publish stage and block promotion until every required tag resolves to the intended manifest digest. The tags that succeeded may already exist in the registry, so the pipeline should not claim that nothing was published. It should retry the failed publication safely, then verify all required tags against the intended digest before approval. This matters because a partial release can confuse automation and operators. The tradeoff is extra verification work, but it prevents promotion of an incomplete release.
Why deploy by digest instead of using a version tag such as v1.4.2?
Deploy by digest when the goal is to run the exact artifact approved by the build. A named version tag can move unless registry policy prevents reassignment, while a digest reference identifies fixed published content. This matters for repeatable deployment, rollback, audit evidence, and software supply chain verification. Version tags are still useful for people and discovery, but the production reference should use repository@sha256:<digest> when exact artifact identity is required.
4. How would you run a GPU test matrix in parallel without oversubscribing accelerators?DevOpsMediumNvidia
i Question Details
A Jenkins fleet contains hosts with different numbers and types of GPUs. Design labels or resource identities, per-GPU locking, executor limits, queue fairness, parallel matrix expansion, affinity to driver versions, timeout and cancellation behavior, and recovery when an agent disappears while holding an accelerator allocation.
Short Interview Answer (30-60 seconds)
I would give every physical GPU a unique resource identity and let each matrix cell acquire exactly one compatible GPU before the test starts. Jenkins can expand the test combinations in parallel, while executor and concurrency limits control how many cells may run. The scheduler checks GPU type and driver affinity before allocation. Redis stores the scheduler allocation lease with an owner and a short lifetime. On timeout or cancellation, the Pipeline stops the test work, runs cleanup, and releases the allocation. If an agent disappears, I quarantine that GPU until cleanup or host recovery is confirmed instead of assigning it again.
Detailed Explanation
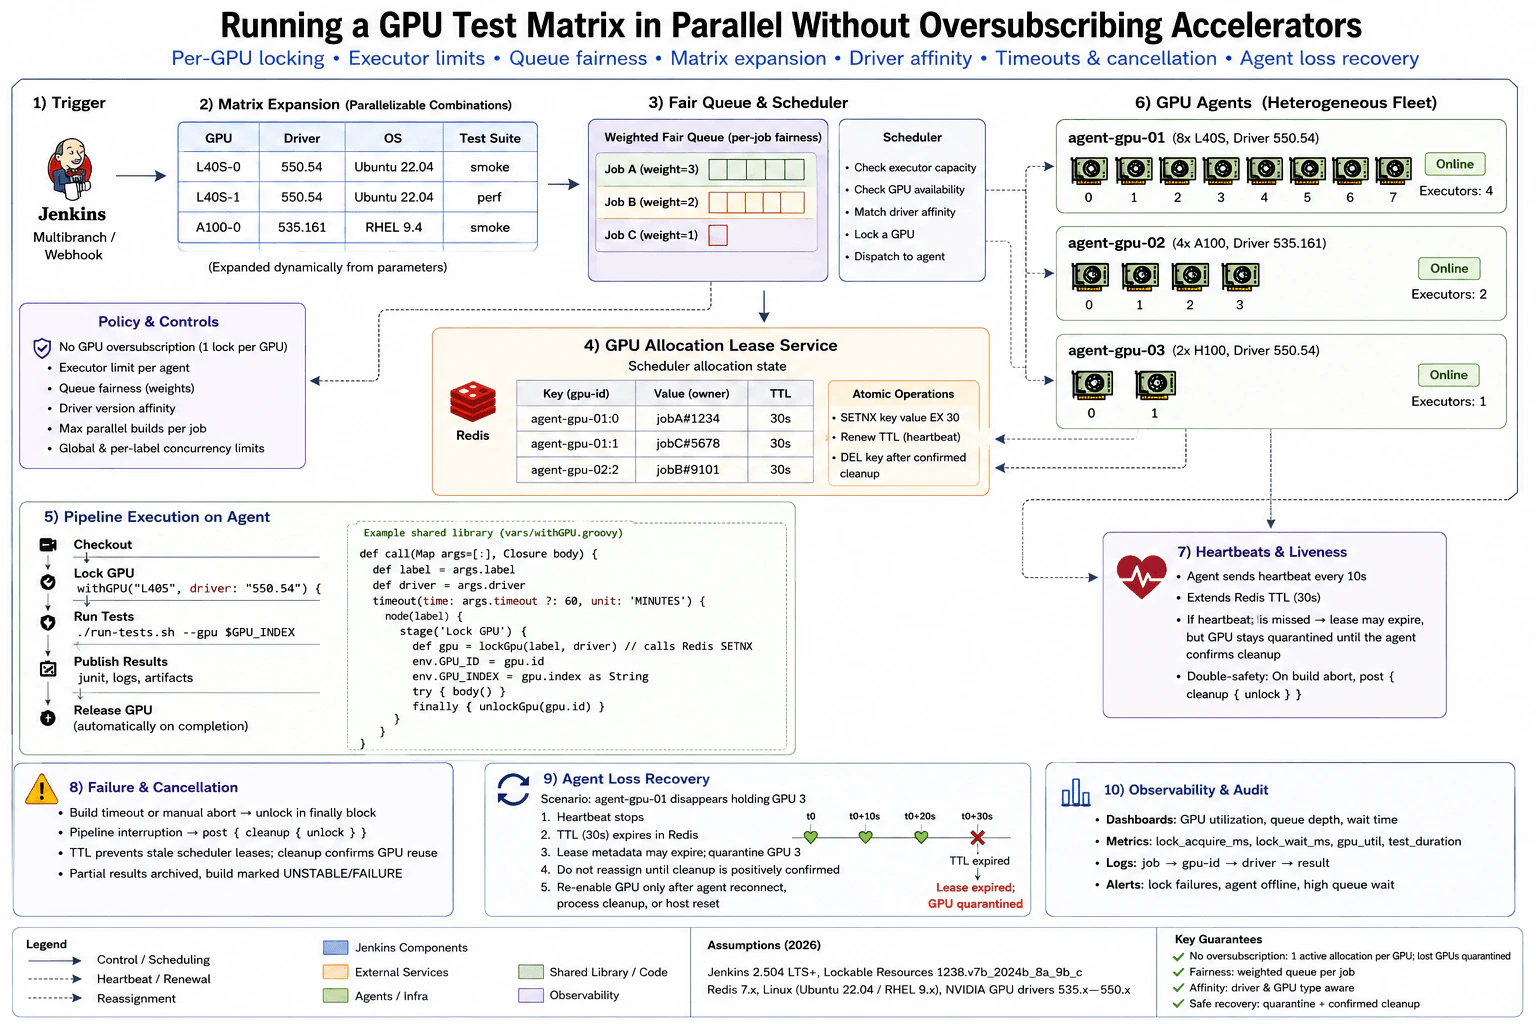
The goal is to run many GPU tests at the same time without letting two tests use the same physical accelerator. Each GPU gets its own identity. A test waits until a compatible GPU is available, uses it, and releases it after cleanup. The queue also limits how much capacity one job can take, so other jobs still get a chance to run. If a machine disappears, its GPUs are not reused immediately. They stay unavailable until the system confirms that the old test can no longer be using them.
Useful Questions to Ask the Interviewer
Do tests require an exact GPU model, or can they run on any compatible model?
Are driver and CUDA versions exact requirements or minimum compatible versions?
How much concurrency should one job or branch be allowed to consume?
What recovery signal proves a GPU is safe to reuse after an agent disappears?
How to Explain It in an Interview
I would model every physical GPU as a unique schedulable resource, such as agent gpu 01 GPU 0. Jenkins labels describe which agents are compatible with each matrix cell, while the unique GPU identity prevents two cells from claiming the same accelerator.
The Pipeline expands combinations such as GPU type, driver requirement, operating system, and test suite. These cells can enter the Jenkins queue in parallel. The scheduler checks executor capacity, GPU availability, and driver affinity before dispatch. I would also use global, per label, and per job concurrency limits. A weighted fairness policy gives competing jobs access to the fleet and reduces starvation risk.
When a cell is selected, it acquires one GPU allocation. The diagram uses Redis for scheduler allocation state. Each entry records the GPU identity, current owner, and a short lease lifetime. The running agent renews that lease with heartbeats. The test receives the chosen GPU index, then publishes logs, test reports, and artifacts.
Timeout and cancellation must interrupt the test work and run cleanup. The scheduler removes the allocation only after cleanup is confirmed. Lease expiry by itself does not prove that the physical GPU is idle.
That rule is critical when an agent disappears. The lease metadata may expire, but I would quarantine the GPU. The scheduler must not reuse it until the agent reconnects, the old process is cleaned up, or the host is reset.
In production I would watch GPU utilization, queue depth, wait time, allocation latency, agent health, and allocation failures. The main tradeoff is safety versus utilization. Conservative quarantine may leave capacity idle longer, but it prevents duplicate GPU ownership.
Why Interviewers Ask This
Interviewers ask this to see whether I can treat GPUs as scarce physical resources instead of ordinary Jenkins executors. They want to know whether I understand matrix expansion, resource identity, driver affinity, queue fairness, cancellation, and failure recovery. The key judgment is preventing two builds from using the same accelerator while still keeping a mixed GPU fleet busy.
Common interview mistakes
Common mistakes are using only an agent label and assuming that it protects individual GPUs, setting Jenkins executors equal to GPU count without a separate GPU allocation rule, letting one large matrix consume the whole fleet, ignoring driver compatibility, and assuming that lease expiry proves the accelerator is free. Another serious mistake is immediately retrying work on the same GPU after an agent disappears. The old process may still be running. Cancellation also needs explicit cleanup so test processes and allocation state do not remain behind.
Interview tip
Start with the safety rule: one active allocation for each physical GPU. Then explain compatibility, queue limits, cleanup, and lost agent recovery in that order. Call out that lease expiry is scheduler state, not proof that the physical accelerator is idle. That distinction shows strong production judgment.
Interviewer may ask next
What would you do if the Jenkins agent loses connectivity but the GPU test process might still be running?
I would quarantine that GPU instead of immediately reassigning it. The scheduler lease may expire after heartbeats stop, but that only means the scheduler state is stale. It does not prove that the process on the host stopped. I would allow reuse only after the agent reconnects and confirms cleanup, an external recovery action terminates the old process, or the host is reset. The tradeoff is temporarily lower GPU utilization, but it prevents two tests from using the same physical accelerator.
How would you keep one large matrix job from consuming every GPU in the fleet?
I would combine the Jenkins queue with bounded concurrency for each job, branch, label, and the fleet as a whole. The matrix can still expand in parallel, but only a controlled number of cells may acquire GPUs at once. A weighted fairness policy can give competing jobs reasonable access to capacity. The tradeoff is that one job may finish more slowly, but queue wait time becomes more predictable and smaller jobs are less likely to be starved.
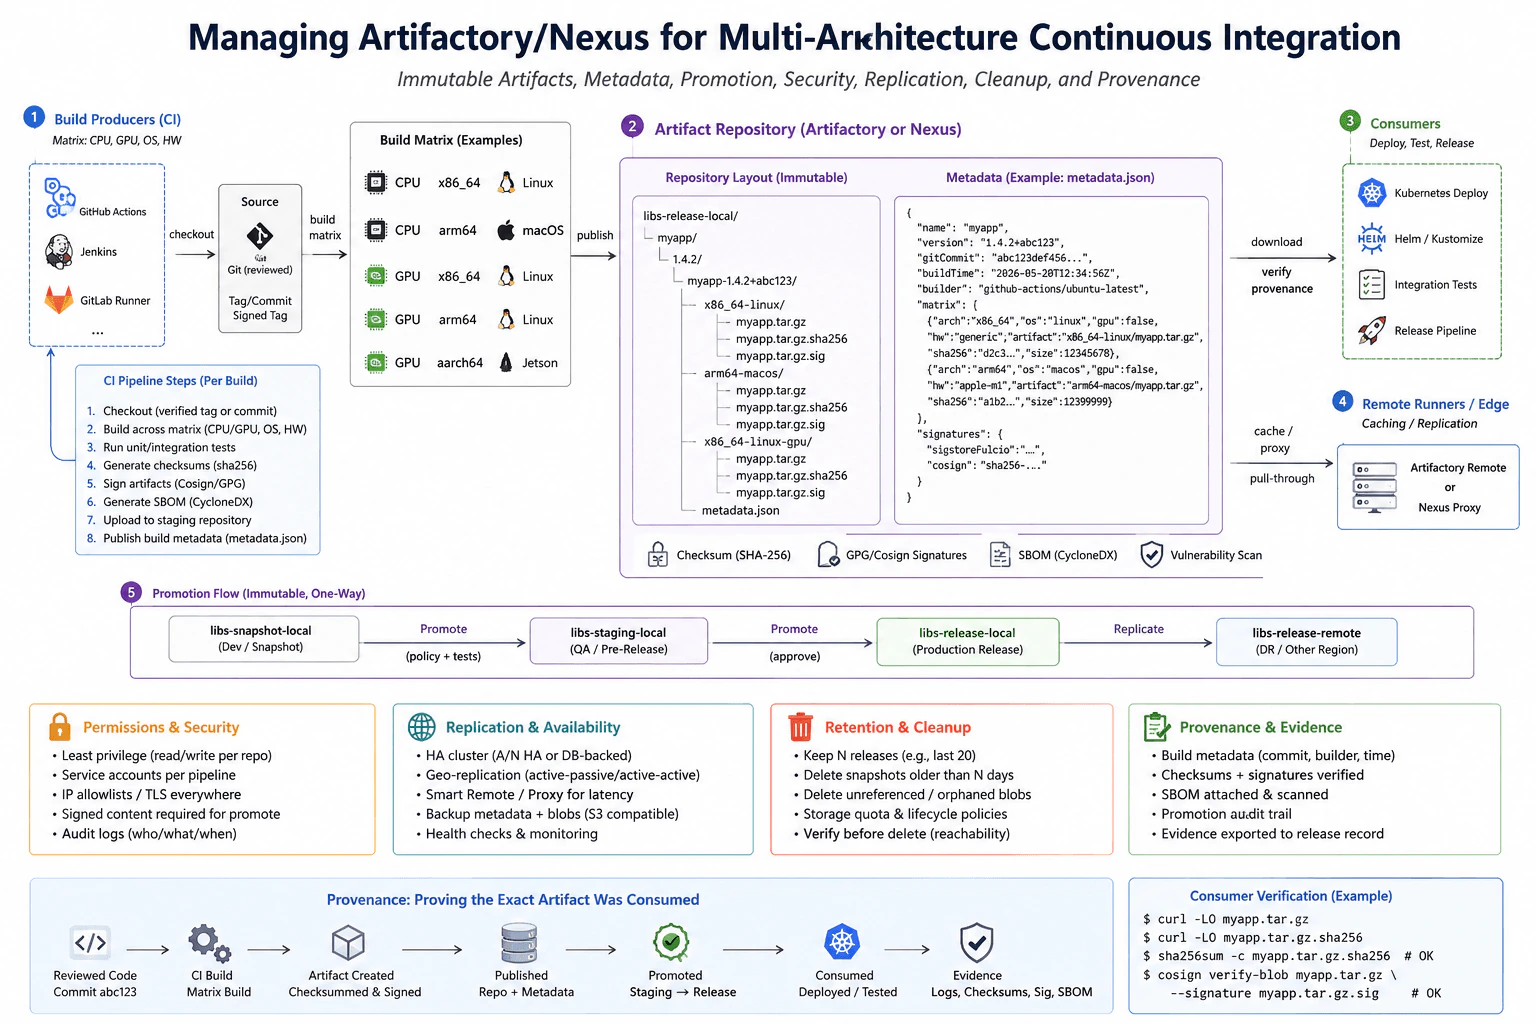
5. How would you manage Artifactory or Nexus for multi-architecture continuous integration?DevOpsHardNvidia
i Question Details
A CI system produces CPU, GPU, operating-system, and hardware-specific build outputs. Design repository naming and immutable version identity, metadata, checksums and signatures, retention, promotion between repositories, permissions, replication or caching for remote runners, cleanup, availability, and the evidence that a test or release consumed the exact artifact produced by the reviewed build.
Short Interview Answer (30-60 seconds)
I would give every build output an immutable identity based on the application version and reviewed Git commit, then store each CPU, GPU, operating system, and hardware variant under a predictable repository path. CI would create a SHA 256 checksum, sign the artifact with GPG or Cosign, generate an SBOM, and publish build metadata. I would promote the same verified bytes from snapshot to staging and then release instead of rebuilding them. Access would follow least privilege. Remote runners would use replication or repository caching. Every test or deployment would record the exact repository path, checksum, signature result, build metadata, and source commit.
Detailed Explanation
The goal is to make every build output easy to find, safe to keep, and possible to prove later. One source change can create several files for different processors, graphics hardware, operating systems, and machines. I would give each output a permanent identity and keep information that explains where it came from. Only approved outputs move toward release. People and automation receive only the access they need. Remote runners receive nearby copies or cached downloads. Temporary builds expire by policy, while release records keep the evidence needed to prove exactly what was tested and deployed.
Useful Questions to Ask the Interviewer
Which artifact types and CPU, GPU, operating system, and hardware combinations must the repository support?
Do remote runners need full repository replication, pull through caching, or both?
What retention period and recovery objectives are required for snapshot, staging, and release repositories?
Which signing system and approval process are already used?
How to Explain It in an Interview
I would separate repositories by lifecycle. A practical layout is libs snapshot local for development outputs, libs staging local for verified candidates, libs release local for production releases, and libs release remote for disaster recovery or another region. Consumers read approved release content rather than writing into release storage.
The artifact identity must not depend on a mutable label such as latest. I would use the application version plus the reviewed Git commit, for example version 1.4.2 plus commit abc123. Architecture details belong in the path and metadata. Each matrix entry records values such as x86_64 or arm64, operating system, GPU presence, hardware target, artifact path, build time, and builder identity.
For every build, CI calculates a SHA 256 checksum, creates a GPG or Cosign signature, generates an SBOM such as CycloneDX, runs the required tests and scans, and publishes build metadata. Promotion is one way. The same verified artifact bytes move from snapshot to staging and then release after policy checks, tests, scans, and approval. Promotion must not rebuild the release artifact.
Permissions follow least privilege. CI service accounts can write only to the repositories needed by their pipeline. Release automation receives the permission needed to promote approved content. Developers and deployment systems mainly read release content. Audit users receive access to metadata and audit records. TLS, repository access controls, and signed content checks protect the path.
Remote runners can use an Artifactory remote repository, a Nexus proxy repository, or repository replication when a durable regional copy is required. A cache reduces repeated network transfers, while replication improves regional availability but adds storage cost and replication lag.
Retention depends on repository purpose. Snapshot builds can expire after a configured age or build count. Staging content can expire after its release window. Released artifacts should follow the release retention policy and must not be deleted while still referenced. Cleanup should also remove safe unreferenced blobs, enforce storage quotas, and check references before deletion.
For availability, I would use redundant repository services, durable metadata and blob storage, backups, health checks, and a tested recovery path. Depending on the product and deployment model, replication can support another region or disaster recovery site.
Finally, every test and deployment records the exact repository path, SHA 256 checksum, signature verification result, source commit, build metadata, SBOM, and promotion record. That creates the evidence chain from reviewed code to CI build to stored artifact to promoted release to the exact artifact consumed.
Why Interviewers Ask This
Interviewers ask this to see whether I can manage artifacts as controlled release inputs instead of simple files. They want to know whether I can design immutable identity, repository promotion, metadata, checksums, signatures, permissions, retention, distributed access, availability, and audit evidence so a release can be traced from reviewed source code to the exact artifact that was tested or deployed.
Common interview mistakes
Common mistakes are using a mutable name such as latest as the release identity, rebuilding an artifact during promotion, mixing architecture variants without enough metadata, trusting a filename without verifying its SHA 256 checksum and signature, giving broad write access to release repositories, deleting release artifacts only because they are old, treating a cache as the only durable copy, and recording only a version label in deployment logs instead of the exact repository path, checksum, signature result, build metadata, and source commit.
Interview tip
Explain the flow in lifecycle order: reviewed source, matrix build, verification, repository storage, promotion, distribution, consumption, and evidence. Emphasize that promotion reuses the same verified artifact bytes and that the final audit trail links the reviewed Git commit to the checksum of the artifact that was actually tested or deployed.
Interviewer may ask next
What would you do if a released artifact fails signature verification on a remote runner?
I would stop the test or deployment and treat that artifact as untrusted. The runner should compare the downloaded SHA 256 checksum with the expected repository metadata and verify the GPG or Cosign signature before use. If a local cache may be stale or corrupted, I would invalidate that cached copy and fetch the same immutable artifact again from an authoritative repository or replica. If verification still fails, I would investigate repository integrity, signing keys, replication state, and audit logs. The important rule is that a checksum or signature failure never falls back to using the artifact anyway.
When would you choose repository replication instead of a pull through cache for remote runners?
I would choose replication when another region needs a durable copy of approved internal artifacts for availability or disaster recovery. I would choose a pull through cache when the main goal is lower download latency and reduced network traffic while the authoritative repository remains reachable. Replication uses more storage and introduces replication lag and recovery procedures. Caching is simpler and usually cheaper, but cached content can be evicted and the cache is not the source of truth. In both cases, consumers still verify the same immutable checksum and signature.
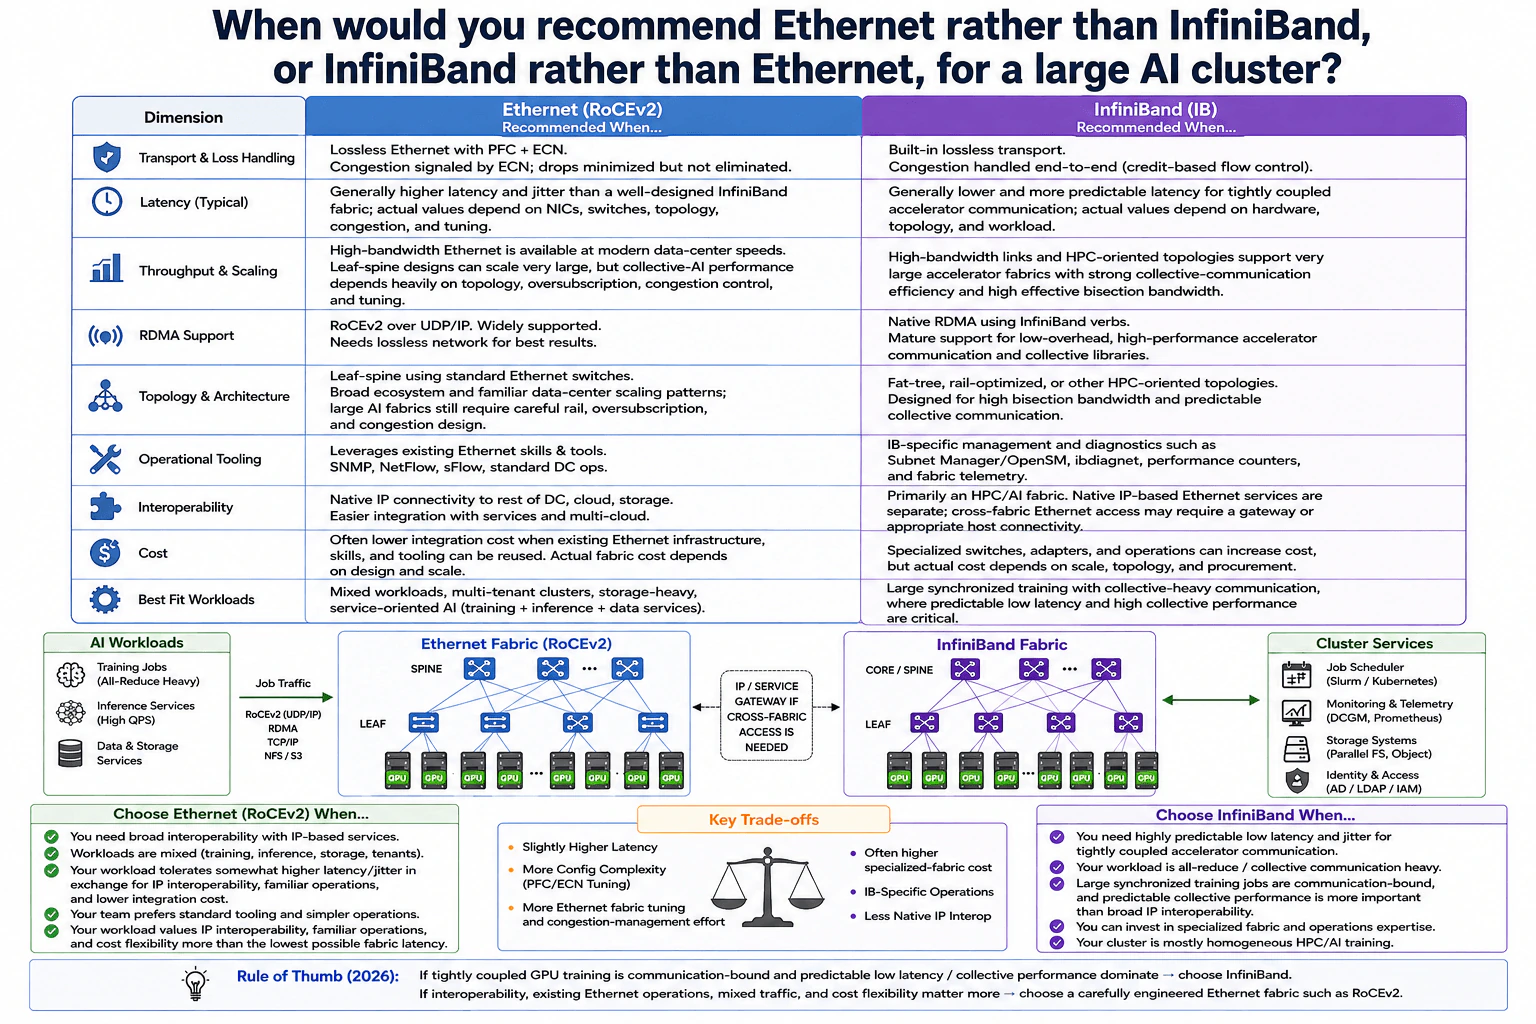
6. When would you recommend Ethernet rather than InfiniBand, or InfiniBand rather than Ethernet, for a large AI cluster?NetworkingEasyNvidia
i Question Details
Compare the two fabrics for distributed accelerator workloads. Cover transport behavior, latency and throughput, RDMA support, congestion and loss handling, topology and scale, operational tooling, interoperability, cost, and the application or cluster requirements that would justify either recommendation.
Short Interview Answer (30-60 seconds)
At a high level, I would choose the fabric from the workload, not from a brand preference. The main challenge is balancing predictable accelerator communication against interoperability, operations, and cost. I would compare transport behavior, latency, scaling, RDMA, and cluster fit. InfiniBand fits tightly coupled, communication-heavy training that needs predictable low latency. RoCEv2 Ethernet fits mixed workloads and IP-based services better. Ethernet needs more congestion tuning, while InfiniBand needs a more specialized fabric and operating model.
Detailed Explanation
The question asks which network fabric better fits a large AI cluster. The hard part is that different workloads care about different things. Large synchronized training jobs may spend a lot of time moving data between accelerators. Inference, storage, and normal services may care more about easy IP connectivity and familiar operations. The diagram compares Ethernet using RoCEv2 with InfiniBand across transport behavior, latency, scaling, RDMA, congestion handling, topology, tooling, interoperability, cost, and workload fit. I would use those areas to make the recommendation.
Useful Questions to Ask the Interviewer
Is the cluster mainly running large synchronized training jobs?
How important is predictable low latency between accelerators?
Will the fabric also carry inference, storage, or normal IP traffic?
Does the team already operate a large Ethernet environment?
Is easy integration more important than maximum collective communication performance?
How to Explain It in an Interview
1. Start with the workload
I would start by asking what dominates the cluster. The diagram shows training jobs with heavy all-reduce traffic, inference services, and data or storage services. Large synchronized training can become communication-bound. That means accelerator communication limits job speed. In that case, predictable collective performance matters greatly.
For a mixed cluster, Ethernet becomes more attractive. It connects naturally to IP-based services and fits normal data-center operations.
2. Compare transport, RDMA, and loss handling
RoCEv2 provides RDMA over UDP/IP. RDMA moves data between hosts with low software overhead. The Ethernet design uses PFC and ECN to help create a low-loss fabric. PFC can pause selected traffic classes. ECN marks congestion so endpoints can react before queues become too full. The downside is extra tuning and congestion-management work.
InfiniBand provides native RDMA. Its fabric has built-in credit-based flow control to help prevent buffer overflow and packet loss. It is designed for tightly coupled HPC and accelerator communication.
3. Compare latency, bandwidth, topology, and scale
The diagram shows Ethernet with generally higher latency and jitter than a well-designed InfiniBand fabric. Modern high-bandwidth Ethernet can still support very large leaf-spine networks. Results depend on topology, oversubscription, congestion control, and tuning.
InfiniBand uses HPC-oriented designs such as fat-tree and rail-optimized topologies. These designs target high bisection bandwidth. In simple words, many accelerators can exchange data across the fabric at the same time. This helps collective-heavy training jobs.
4. Compare operations and interoperability
Ethernet has a broad operating ecosystem. The diagram shows familiar tools such as SNMP, NetFlow, and sFlow. It also connects naturally to IP-based cloud, storage, and service networks.
InfiniBand uses specialized tools such as OpenSM, ibdiagnet, performance counters, and fabric telemetry. The diagram also shows cluster services including job scheduling, monitoring, storage, and identity systems. If InfiniBand must reach Ethernet services, cross-fabric access may use the shown IP or service gateway, or suitable host connectivity.
5. Make the recommendation
I would choose InfiniBand when large synchronized training is communication-bound and predictable low latency and collective performance dominate. I would choose RoCEv2 Ethernet when mixed traffic, IP interoperability, existing Ethernet skills, and cost flexibility matter more.
The trade-off is operational. Ethernet can reuse familiar infrastructure but needs careful PFC, ECN, topology, and congestion tuning. InfiniBand can provide more predictable training-fabric behavior, but it brings specialized hardware, tools, and operations.
Practical Complexity & Trade-offs
The benefit of RoCEv2 Ethernet is flexibility. It works naturally with IP-based systems and can reuse existing Ethernet skills and tools. The downside is more tuning. Large AI fabrics need careful congestion control, oversubscription planning, PFC, and ECN settings. InfiniBand gives more predictable low-latency behavior for tightly coupled training. The downside is a more specialized fabric, toolset, and operating model. Cost is not automatically lower for either choice. Ethernet can reduce integration cost when existing infrastructure is reused. InfiniBand cost depends on fabric size, topology, hardware, and purchasing choices.
Why Interviewers Ask This
The interviewer wants to see whether you choose infrastructure from workload needs instead of memorizing one preferred technology. They want you to compare latency, RDMA, congestion behavior, scaling, operations, interoperability, and cost. They also want to see whether you understand why communication-heavy training and mixed-service AI clusters can need different network designs.
Interviewer may ask next
What would you change if the cluster mainly ran large synchronized training jobs and collective communication became the main performance bottleneck?
I would lean more strongly toward the InfiniBand fabric shown in the diagram. The workload has changed. The cluster is now dominated by tightly coupled training, so predictable accelerator communication matters more than broad IP interoperability.
I would keep the InfiniBand fabric for the training traffic. Native RDMA gives low-overhead data movement. The credit-based fabric flow control helps prevent loss caused by buffer overflow. I would also keep the HPC-oriented topology shown in the diagram because high bisection bandwidth helps many accelerators communicate together during collective operations.
The normal cluster services still need connectivity. The diagram includes job scheduling, monitoring, storage, and identity systems. When those services live on Ethernet, cross-fabric access can use the shown IP or service gateway, or suitable host connectivity, when needed.
The downside is specialization. The team needs InfiniBand hardware, management tools such as OpenSM and ibdiagnet, and people who understand how to operate the fabric.
What if the AI cluster must also support inference services, storage traffic, and many existing IP-based systems?
I would favor the RoCEv2 Ethernet side of the same design. The workload is now mixed. Training still matters, but the fabric must also connect inference, storage, cloud services, and normal IP-based systems without adding unnecessary integration boundaries.
RoCEv2 provides RDMA over UDP/IP, while the wider Ethernet environment can also support normal IP traffic. The team can reuse familiar data-center tooling such as SNMP, NetFlow, and sFlow. That matches the diagram's focus on interoperability and familiar operations.
I would pay close attention to congestion control. The design uses PFC and ECN because large accelerator flows can create heavy bursts. The leaf-spine topology also needs careful oversubscription and capacity planning so collective traffic does not create avoidable bottlenecks.
The downside is extra tuning. Ethernet latency and jitter may also be less predictable than on a well-designed InfiniBand fabric.
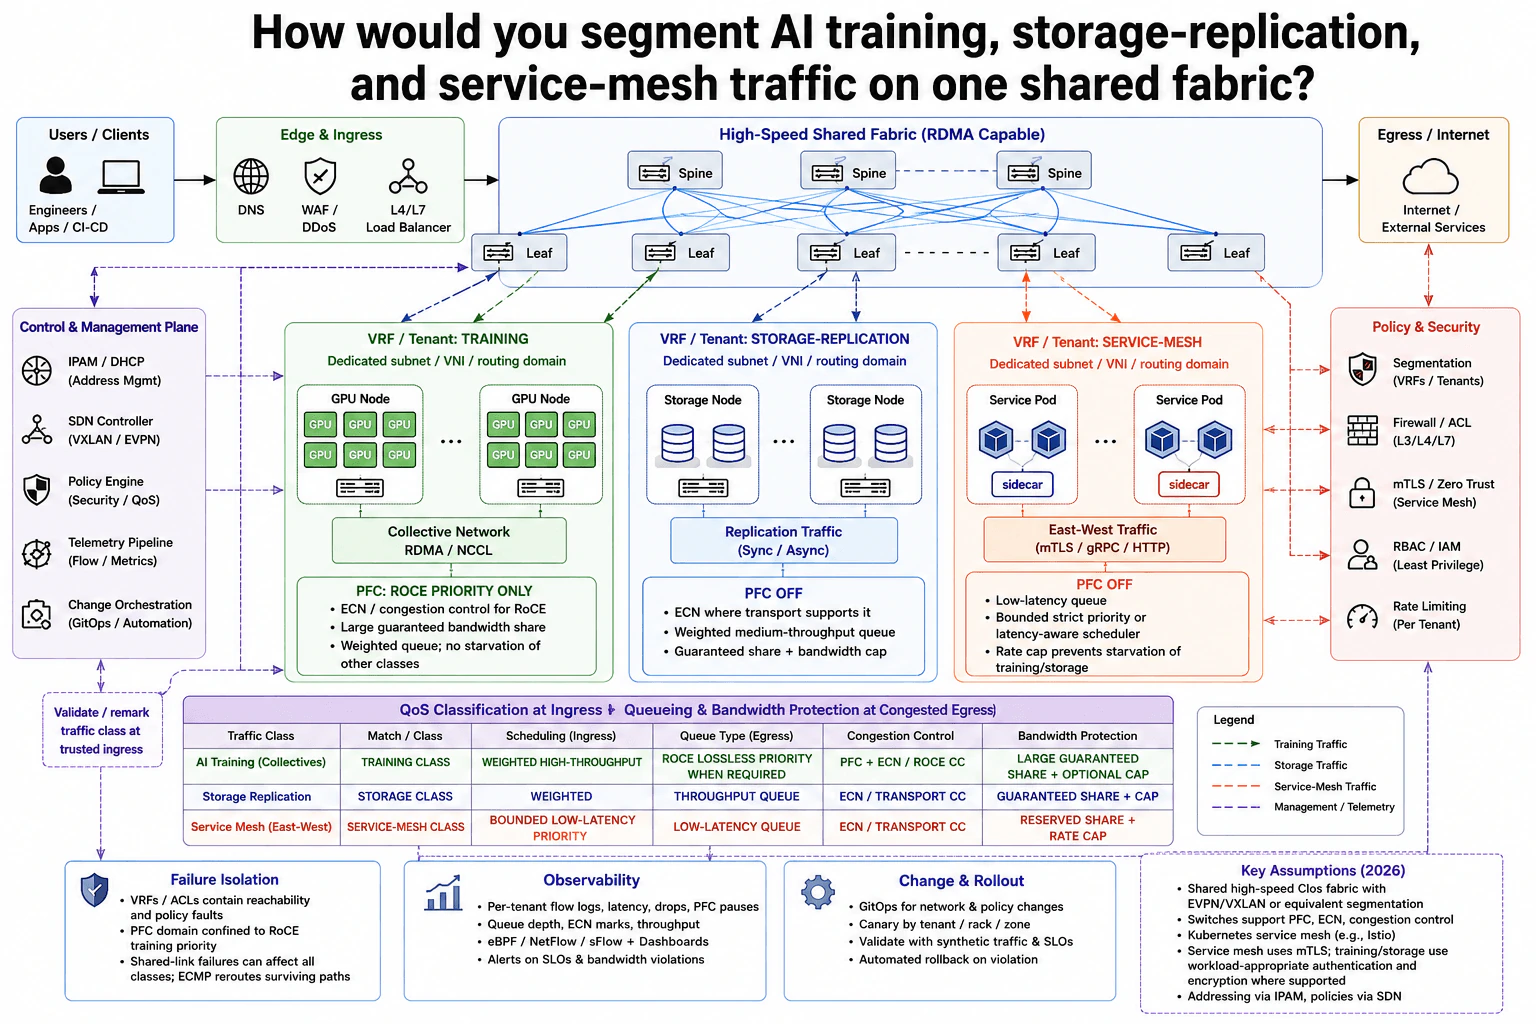
7. How would you segment AI training, storage-replication, and service-mesh traffic on one shared fabric?NetworkingHardNvidia
i Question Details
The same network carries large training collectives, storage replication, and latency-sensitive east-west service traffic. Design address or tenant boundaries, virtual networks or routing domains, QoS classification and queueing, bandwidth protection, policy enforcement, failure isolation, observability, and change rollout while preserving required throughput and preventing one class from starving another.
Short Interview Answer (30-60 seconds)
At a high level, I would let all three traffic types share one fast fabric without treating them as one traffic class. The main challenge is protecting latency-sensitive service traffic while AI training and storage move large flows. I would divide the design into logical isolation, QoS protection, and operational control. Separate VRFs isolate each workload. Trusted ingress classifies traffic, while egress queues enforce bandwidth protection. Weighted shares, bounded low-latency priority, congestion control, and rate caps prevent starvation. The trade-off is more policy and tuning work.
Detailed Explanation
The network must carry three very different kinds of traffic over the same physical fabric. AI training sends large collective flows between GPU nodes. Storage replication needs steady bandwidth. Service-mesh traffic is usually smaller, but delay can directly hurt application response time. The difficult part is sharing links without allowing one workload to consume all available capacity. The diagram handles this with separate routing boundaries, traffic classification, protected queues, security controls, monitoring, failure isolation, and controlled rollout of network changes.
Useful Questions to Ask the Interviewer
Does the AI training traffic use RoCE and require PFC?
Which service-mesh latency targets must we protect?
How should available bandwidth be divided during congestion?
Which failures must stay isolated to one tenant or traffic class?
How to Explain It in an Interview
1. Start with logical isolation
I would first separate reachability before tuning bandwidth. AI TRAINING, STORAGE-REPLICATION, and SERVICE-MESH each use a dedicated VRF or tenant. A VRF gives each workload its own routing table on the shared fabric.
Each domain also has its own subnet, VNI, and routing domain. IPAM / DHCP manages addressing. The SDN Controller manages VXLAN / EVPN state. This limits how far routing and policy mistakes can spread.
2. Carry all three workloads over one shared fabric
The High-Speed Shared Fabric uses a leaf-spine design with several available paths. GPU Nodes exchange collective traffic through RDMA / NCCL. Storage Nodes send Replication Traffic. Service Pods exchange east-west traffic through the service mesh.
The key idea is that logical separation does not require three physical networks. All three classes can share the same links when congestion is controlled correctly.
3. Classify traffic at ingress and protect it at egress
At trusted ingress, the Policy Engine validates or remarks the traffic class. When an egress link becomes congested, each class enters its configured queue.
AI Training uses a weighted high-throughput queue with a large guaranteed share. If RoCE needs lossless behavior, PFC applies only to the RoCE priority. ECN and RoCE congestion control tell senders to slow down before queues stay overloaded.
Storage Replication uses a weighted throughput queue. It gets a guaranteed share plus a bandwidth cap. Service Mesh uses a bounded low-latency priority queue. Its reserved share protects latency, while its rate cap prevents it from starving training or storage.
4. Enforce policy and contain failures
Policy & Security uses VRF segmentation, Firewall / ACL rules, RBAC / IAM, and per-tenant rate limiting. Service-mesh traffic uses mTLS and Zero Trust controls.
VRFs and ACLs contain reachability and policy faults. The PFC domain stays limited to the RoCE training priority. A shared-link failure can still affect several classes, so ECMP uses surviving paths where available.
5. Observe the network and roll out changes safely
The Telemetry Pipeline watches per-tenant flows, latency, drops, PFC pauses, queue depth, ECN marks, and bandwidth. Dashboards and alerts expose SLO or bandwidth problems.
Change Orchestration uses GitOps and automation. Changes canary by tenant, rack, or zone. Synthetic traffic and SLO checks validate them. Automated rollback stops a bad change from spreading. The main trade-off is extra configuration and tuning complexity.
Practical Complexity & Trade-offs
The benefit is that one physical fabric can serve all three workloads efficiently. Separate VRFs give each workload its own routing boundary. Different queues then protect bandwidth and latency when links become busy. Training keeps a large guaranteed share without becoming an unlimited priority class. Service traffic gets low-latency treatment, but a rate cap stops it from starving other traffic. Storage gets steady bandwidth with its own cap. The downside is more operational work. Queue settings, congestion control, PFC scope, classifications, and policies must stay consistent. A physical link failure can also affect several classes even though their routing and security boundaries remain separate.
Why Interviewers Ask This
Interviewers want to see whether you can share expensive network capacity safely. They are testing your understanding of routing isolation, congestion, queueing, policy enforcement, and failure boundaries. They also want operational judgment. A strong candidate explains why one class must not starve another, what PFC should and should not protect, which signals must be monitored, and how risky network changes can be introduced and rolled back safely.
Interviewer may ask next
What would you change if service-mesh latency became much more important during peak AI training jobs?
I would keep the same VRFs and shared fabric, but I would adjust the Service Mesh QoS policy. That class already uses a bounded low-latency priority queue. I would increase its reserved share enough to meet the new latency target while keeping a strict rate cap.
The cap matters because priority must be bounded. Without a cap, Service Mesh could consume too much of a congested link and hurt training or storage. AI Training would keep its weighted high-throughput queue and large guaranteed share. Storage Replication would keep its weighted throughput queue and bandwidth cap.
I would validate the change through the existing Telemetry Pipeline. I would watch service latency, queue depth, drops, ECN marks, and bandwidth for all three classes. Change Orchestration would canary the policy by tenant, rack, or zone and roll it back if SLO checks fail.
The downside is that reserving more capacity for Service Mesh leaves less flexible bandwidth for training and storage during congestion.
How would you handle a congestion problem caused by PFC pauses spreading through the AI training network?
I would first keep PFC limited to the RoCE training priority. The diagram already avoids enabling lossless behavior for every class. Storage Replication and Service Mesh remain PFC OFF.
Next, I would use the Telemetry Pipeline to inspect PFC pauses, queue depth, ECN marks, drops, bandwidth, and per-tenant flows. That shows whether the problem is local to one path or affecting a wider part of the shared fabric. ECN and RoCE congestion control should make training senders reduce their rate before queues remain blocked for long periods.
If a recent network change caused the issue, Change Orchestration can stop the canary and use automated rollback. The VRF boundaries still protect routing and policy isolation, although a physical shared-link problem can affect several traffic classes.
The downside is that tighter PFC and congestion-control settings can reduce peak training performance if they are tuned too aggressively.
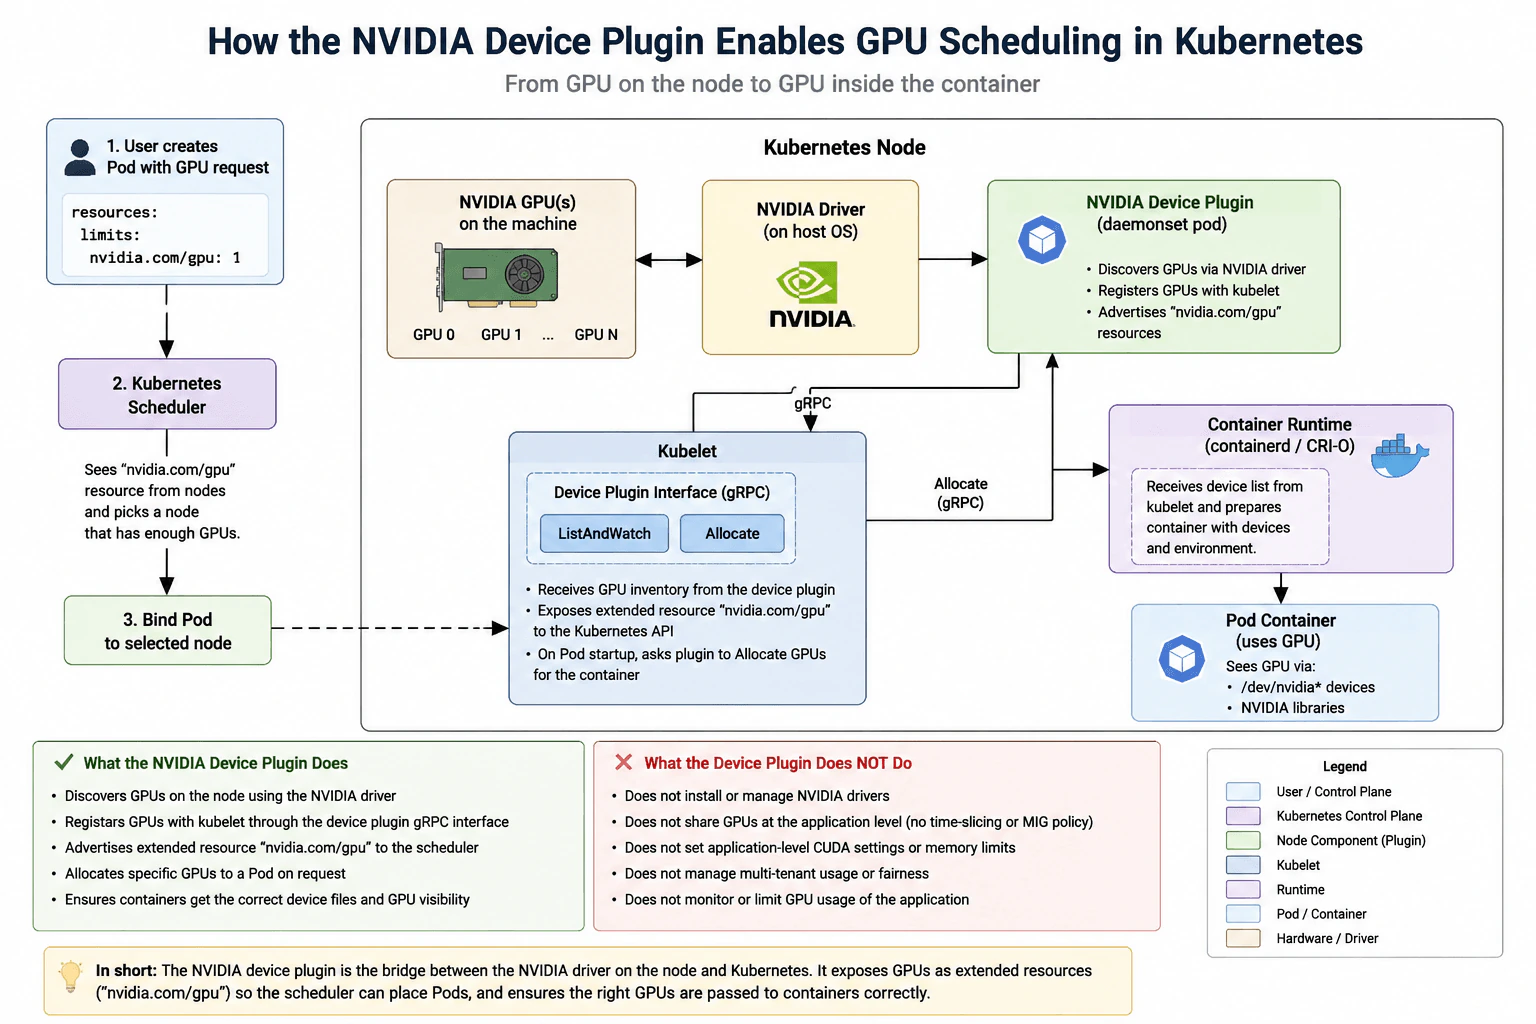
8. What role does the NVIDIA device plugin play in Kubernetes GPU scheduling?Containers And KubernetesEasyNvidia
i Question Details
Explain the boundary among the GPU driver on a node, kubelet's device-plugin interface, extended GPU resources advertised to the scheduler, Pod resource requests, allocation to a container, and runtime device exposure. Include what the plugin does not manage, such as application-level GPU sharing or driver installation.
Short Interview Answer (30-60 seconds)
At a high level, the NVIDIA device plugin connects Kubernetes with GPUs that already exist on a node. The main challenge is keeping Kubernetes scheduling separate from low-level GPU access. I would explain it in three steps: discover and advertise GPUs, schedule a Pod that requests them, then expose the allocated devices inside its container. The plugin helps with discovery and allocation, but it does not install drivers or manage application-level GPU sharing.
Detailed Explanation
The goal is to let Kubernetes place a Pod on a node that has an available NVIDIA GPU. The difficult part is that Kubernetes does not directly control the GPU hardware. The node already needs an NVIDIA Driver that can talk to the GPUs. The NVIDIA Device Plugin connects that node-level GPU information to Kubernetes. The diagram separates this into GPU discovery, Kubernetes scheduling, GPU allocation, and device access inside the running container. It also shows an important boundary: the plugin does not install drivers or control how an application shares a GPU.
Useful Questions to Ask the Interviewer
Are Pods requesting whole GPUs through nvidia.com/gpu?
Should I focus on the normal scheduling and allocation path shown here?
Should application-level GPU sharing remain outside this basic device-plugin flow?
How to Explain It in an Interview
1. Start with the GPU and NVIDIA Driver
I would start with the physical GPU because Kubernetes cannot use it directly. The NVIDIA GPU is on the Kubernetes Node. The NVIDIA Driver runs on the host operating system and provides low-level access to that hardware.
The driver must already be installed and working. The NVIDIA Device Plugin does not install or manage it. This gives the plugin a working GPU environment that it can discover.
2. Let the NVIDIA Device Plugin report GPUs
Next, the NVIDIA Device Plugin runs as a DaemonSet Pod on the node. It discovers GPUs through the NVIDIA Driver. It then registers with kubelet through the Kubernetes Device Plugin Interface, which uses gRPC.
The plugin reports GPU devices and their health to kubelet. Kubelet then exposes the GPU capacity to Kubernetes as the extended resource nvidia.com/gpu. The Kubernetes Scheduler can see that node capacity when it decides where a GPU Pod can run.
3. Schedule a Pod that requests a GPU
A user creates a Pod with a GPU resource request. In the diagram, the Pod uses limits with nvidia.com/gpu: 1.
The Kubernetes Scheduler checks the nvidia.com/gpu capacity available on nodes. It chooses a node with enough free GPU resources. Kubernetes then binds the Pod to that selected node. The scheduler chooses the node, but it does not choose the exact physical GPU device.
4. Allocate the GPU through kubelet
When the Pod starts, kubelet works through its Device Plugin Interface. The diagram shows operations such as ListAndWatch and Allocate.
Kubelet asks the NVIDIA Device Plugin to allocate the required GPU. The plugin returns the device information needed to prepare the container. This keeps Kubernetes scheduling separate from NVIDIA-specific device details on the node.
5. Expose the GPU inside the container
The Container Runtime, such as containerd or CRI-O, receives the device information through the kubelet-controlled startup path. It prepares the container with the assigned GPU devices and required environment.
The running Pod Container can then see NVIDIA device files such as /dev/nvidia* and use NVIDIA libraries. The application can now use its assigned GPU.
The important boundary is that the device plugin connects GPU resources to Kubernetes scheduling and allocation. It does not install NVIDIA drivers, set application-level CUDA options, manage application-level GPU sharing, enforce application GPU memory limits, or monitor the application's GPU usage.
Practical Insights
The benefit is that Kubernetes can treat NVIDIA GPUs as schedulable resources without understanding every hardware detail. The device plugin gives kubelet GPU inventory and health information and helps allocate the correct devices to containers. This keeps the scheduler focused on choosing the right node. The downside is that the plugin does not solve every GPU problem. The NVIDIA Driver must already exist on the node. Application-level sharing, CUDA settings, memory control, fairness, and GPU monitoring need separate mechanisms. This separation keeps responsibilities clear, but operators still need to manage those other parts.
Why Interviewers Ask This
Interviewers ask this to see whether you understand the boundary between Kubernetes scheduling and GPU hardware management. They want to know whether you can separate the roles of the NVIDIA Driver, NVIDIA Device Plugin, kubelet, Kubernetes Scheduler, Container Runtime, and Pod Container. They also want to see whether you understand what the device plugin deliberately does not manage.
Interviewer may ask next
What changes if several applications need to share the same physical GPU?
The basic Kubernetes scheduling path can stay similar, but the NVIDIA Device Plugin role shown in this diagram does not itself manage application-level GPU sharing. It still discovers GPU resources, reports them through kubelet, and participates in allocation.
The part that changes is how shared GPU capacity is represented and controlled. A separate sharing setup or policy is needed before applications can safely share the same physical GPU. The diagram calls out examples such as time-slicing or MIG policy as outside the basic role being explained here.
The NVIDIA Driver still provides hardware access. Kubelet still uses the Device Plugin Interface. The Container Runtime still exposes the assigned GPU devices and environment to the Pod Container.
The main downside is extra operational complexity. Sharing adds decisions about isolation, fairness, capacity, and application behavior. Those concerns should not be confused with the basic scheduling and allocation job of the device plugin.
What happens if the NVIDIA Driver is missing or broken on a GPU node?
The normal device-plugin flow cannot work correctly without a usable NVIDIA Driver on the node. The driver is the layer that provides low-level access to the physical NVIDIA GPUs. The NVIDIA Device Plugin depends on that working node environment to discover usable GPU devices.
I would keep the same responsibility boundary shown in the diagram. I would not make the device plugin install or repair the driver. Driver installation and maintenance remain a host operating-system or node-administration responsibility.
Without a working driver, the plugin cannot correctly discover and report healthy GPUs to kubelet. Kubernetes therefore should not rely on that node as having usable nvidia.com/gpu capacity for normal GPU workloads.
The main downside of this separation is that GPU readiness depends on more than Kubernetes scheduling. Operators must keep the node driver and GPU environment healthy before the device plugin can expose those resources correctly.
Cloud Engineer Resume Examples
Explore the resume examples below to find the one that best matches your target Cloud Engineer role.
Disclaimer: This interview guide is for educational and informational purposes only. It is designed to help readers prepare, but it does not guarantee any interview result, hiring decision, offer, or outcome. Interview questions, hiring criteria, and preferred answers can vary by employer, interviewer, industry, location, and time. All answers, examples, and explanations in this guide are suggested examples for interview preparation, not definitive answers or instructions for professional practice. They are based on research and judgment, are provided without warranties of any kind, and should be adapted to the question, role, and applicable laws and professional requirements. Diagrams are simplified illustrations intended to highlight the main concepts and their relationships; actual situations, systems, and practices may be more complex. Alternative approaches may be equally valid or better suited to a particular question, context, or interviewer. To the fullest extent permitted by applicable law, the contributors and publisher are not liable for decisions made, actions taken, or losses incurred based on this guide.
State Laws and Professional Responsibilities: Laws and requirements governing an occupation vary by state and jurisdiction. You are responsible for checking the current laws, licensing requirements, and scope-of-practice rules that apply to your location and role, and for ensuring that your answers and actions comply with them. Adapt examples in this guide to those requirements. This guide is not legal advice.
Company Notice: This guide is an independent educational resource and is not affiliated with, endorsed by, sponsored by, or approved by the company named in this guide. Company names identify reported interview experiences or the employer context of clearly labeled original practice exercises. Interview practices can change without notice, and inclusion of company-specific content does not mean these questions are official, complete, or guaranteed to be asked. To the fullest extent permitted by law, the author, contributors, and publisher are not responsible for outcomes related to use of this material.
Content Accuracy and Verification: To the fullest extent permitted by applicable law, we do not represent or warrant that interview guides, questions, answers, examples, or diagrams are accurate, complete, current, error-free, or suitable for any particular purpose. You are responsible for independently reviewing and verifying the information before relying on it.