NVIDIA Python Developer Interview Questions & Answers

nvidia icon

Questions with Detailed ExplanationsWith Detailed Explanations

(Last Updated: August 28, 2026)

21. Design a FastAPI service with an asynchronous database pool and retries.API DesignHardNvidia

Question Details

Define endpoints and request and response contracts for a FastAPI service. Explain async database access, connection pooling, validation, timeouts, bounded retries, idempotency, error mapping, tracing, rate limits, and testing.

Short Interview Answer (30-60 seconds)

At a high level, I would expose POST /records and GET /records/{id} through a FastAPI service. The client sends an HTTPS request with a JWT through rate limiting and authentication. FastAPI validates the request, checks the Idempotency-Key when needed, and calls an async repository. The repository borrows a connection from the async pool and uses PostgreSQL. Temporary database failures use bounded retries with backoff. The trade-off is better reliability and connection reuse, but more state, monitoring, and failure-handling logic.

Detailed Explanation

The goal is to serve record requests without creating one database connection per request. The main challenge is combining async access, safe retries, validation, and clear errors. I would explain the design by following the request from the client to PostgreSQL and back.

Useful Questions to Ask the Interviewer
  1. Which clients and core use cases must the API support?
  2. What authentication, authorization, and data-validation rules should I assume?
  3. What scale, error handling, idempotency, and versioning requirements matter?
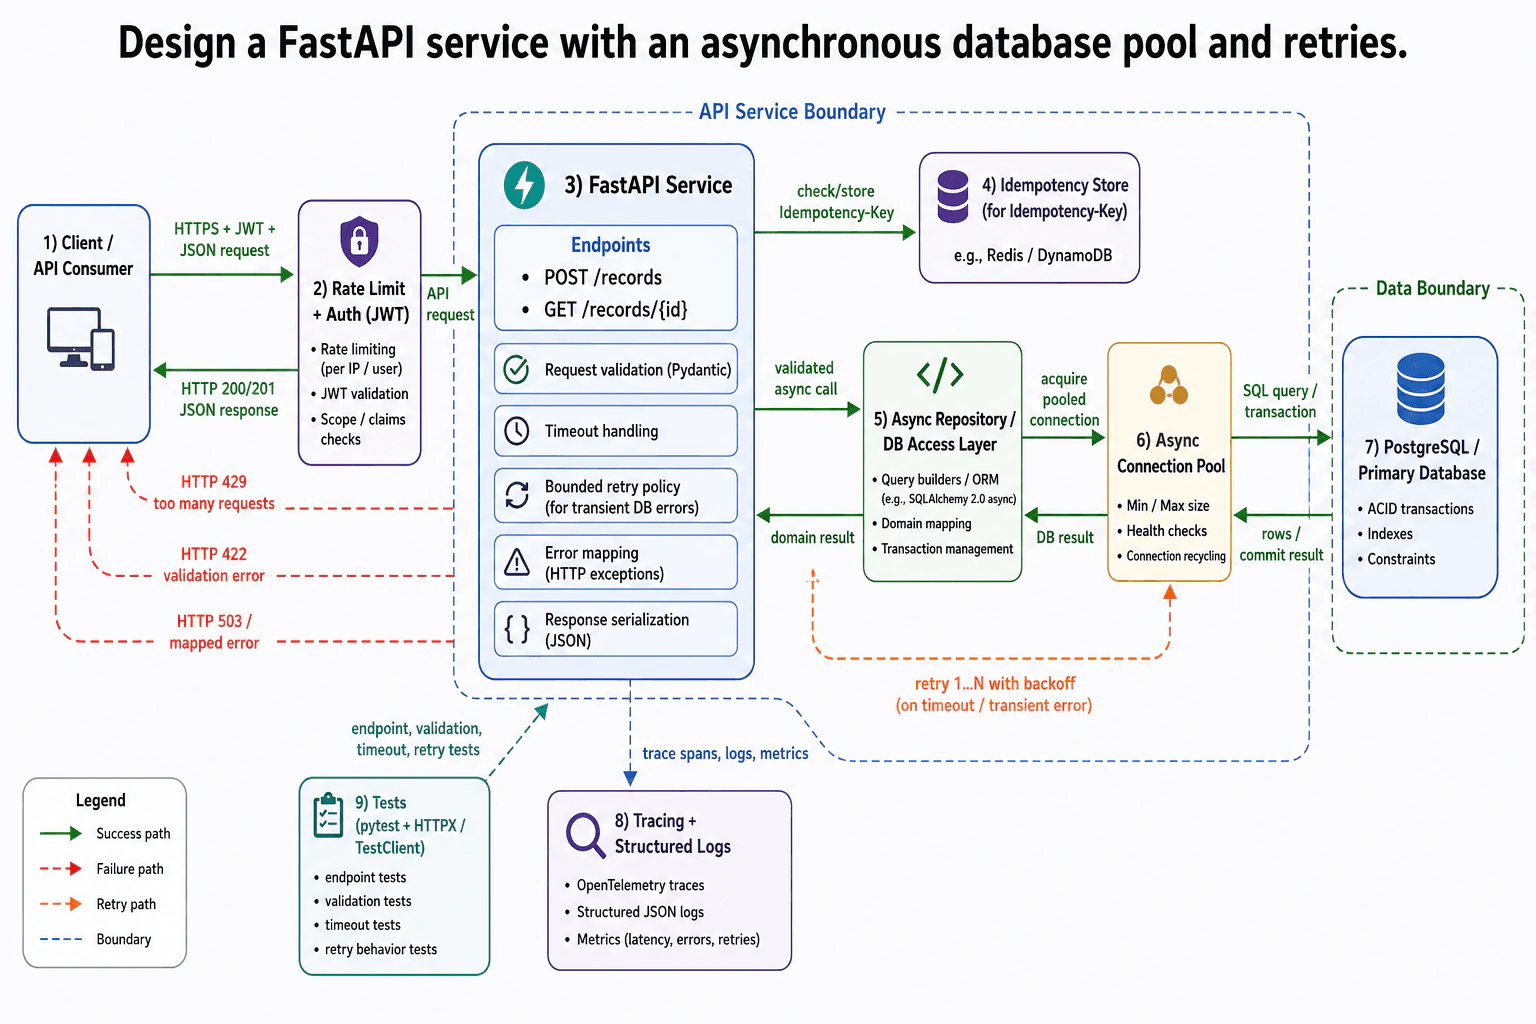
Design a FastAPI service with an asynchronous database pool and retries. diagram
How to Explain It in an Interview
1. Define the API boundary and endpoints

I would start with two endpoints. POST /records creates a record. GET /records/{id} reads one record using its identifier.

The client sends an HTTPS request containing a JWT and JSON data. HTTPS protects the request while it travels over the network. A valid JWT lets the edge layer authenticate the caller and inspect its claims.

The Rate Limit + Auth layer runs before FastAPI. It applies limits per IP address or user. It also validates the JWT and checks its scopes or claims. When the caller exceeds the limit, this layer returns HTTP 429 too many requests.

2. Validate and prepare the request

The accepted request reaches the FastAPI service. FastAPI uses Pydantic for request validation. Pydantic checks the expected JSON shape and field types.

When validation fails, FastAPI returns HTTP 422 validation error. Invalid data therefore never reaches the repository or PostgreSQL.

FastAPI also owns timeout handling, bounded retry policy, error mapping, and JSON response serialization. Keeping these rules inside the service gives both endpoints consistent behavior.

3. Handle idempotency for safe repeated requests

FastAPI checks or stores the Idempotency-Key in the Idempotency Store. The diagram shows Redis or DynamoDB as possible implementations.

Idempotency means a repeated request should not create duplicate work. This matters for POST /records because a client may retry after losing the first response.

The Idempotency Store supports request handling, but it is not the primary records database. PostgreSQL still owns the durable record and transaction data.

4. Access PostgreSQL asynchronously

After validation, FastAPI sends a validated async call to the Async Repository / DB Access Layer. This layer builds queries, maps rows into domain results, and manages transactions.

The repository acquires a reusable connection from the Async Connection Pool. The pool controls minimum and maximum connection counts. It also performs health checks and connection recycling.

The pool sends the SQL query or transaction to PostgreSQL. PostgreSQL applies ACID transaction rules, indexes, and constraints. It returns rows or a commit result to the pool. The pool returns the database result to the repository. The repository then returns the domain result to FastAPI.

5. Apply timeouts and bounded retries

The design retries only timeout or transient database errors. A transient error is a temporary failure that may succeed later.

The retry policy performs retry 1..N with backoff on the repository and connection-pool path. Backoff means the service waits before another attempt. The retry count is bounded, so requests cannot retry forever.

If all attempts fail, FastAPI maps the failure to HTTP 503 / mapped error. This tells the client that the service is temporarily unavailable.

Retries improve recovery from short failures. However, they increase latency and may add database load during an incident.

6. Return the response and record telemetry

After receiving the domain result, FastAPI serializes it as JSON. The service returns an HTTP 200/201 JSON response to the client. The read operation uses the successful read response, while creation uses the successful creation response.

FastAPI also sends trace spans, structured JSON logs, and metrics to the Tracing + Structured Logs component. The diagram includes OpenTelemetry traces and metrics for latency, errors, and retries.

This observability path helps operators debug failures. It does not own or delay the business response path.

7. Test success and failure paths

The test suite uses pytest with HTTPX or TestClient. It tests endpoints, validation, timeout handling, and retry behavior.

Important cases include a successful record request, HTTP 422 for invalid input, and HTTP 429 for excessive traffic. Tests should also simulate transient database failures and confirm bounded retries. Repeated failures should end with HTTP 503.

These tests require controlled database and failure setup. The extra work is worthwhile because it protects the API contract and reliability rules.

Time & Space Complexity

The design adds several safety layers around a simple records API. Validation rejects bad JSON before database work begins. Rate limiting protects FastAPI and PostgreSQL from heavy callers. Idempotency protects repeated POST /records requests from duplicate work. The async connection pool improves throughput because requests reuse a controlled number of connections. Bounded retries help with temporary database errors, but they can increase latency and database load. Tracing and structured logs make failures easier to understand, but they add operational work. The benefit is better reliability and safer database use. The downside is more state, configuration, and testing. We accept this complexity because database connections are limited and client retries are common.

Why Interviewers Ask This

The interviewer is testing whether you can define a clear API boundary and trace the full request and response flow. They want correct judgment about async database access, connection pooling, validation, idempotency, rate limits, retries, and error mapping. They also check whether each component owns the right responsibility. A strong answer explains why retries must be bounded, why POST requests need idempotency, and what operational cost the design accepts.
Interviewer may ask next
What would you change if traffic grows and the async connection pool becomes exhausted?

I would keep the same endpoints and database flow, but I would control pressure at the Async Connection Pool. The pool would enforce its configured maximum size. A request that cannot borrow a connection would wait only until the normal timeout. After that, the repository path could use the existing bounded retry policy for a temporary failure. If all allowed attempts fail, FastAPI would return the same HTTP 503 / mapped error.

I would monitor pool usage, connection wait time, request latency, and retry counts through the Tracing + Structured Logs component. These signals show whether the pool is too small or PostgreSQL is slow. I would improve slow queries and indexes before increasing the pool size. A larger pool may improve throughput, but it can also overload PostgreSQL. Rate limiting should continue reducing sudden traffic spikes before they enter FastAPI.

The main downside is higher latency while requests wait. The endpoint contracts, validation, idempotency, and transaction rules remain unchanged.

How would you test idempotency and bounded retries for POST /records?

I would test them together because both protect repeated create requests during failures. First, I would call POST /records with valid JSON and one Idempotency-Key. The request should complete successfully and create one logical record. I would then send the same request again with the same key. The FastAPI service should check the Idempotency Store and avoid duplicate work.

Next, I would simulate a transient timeout in the Async Repository or connection-pool path. The test should confirm that the service attempts only 1..N retries and uses backoff between attempts. I would then simulate continuous failure and confirm that FastAPI returns HTTP 503 / mapped error after retries are exhausted.

The tests would use pytest with HTTPX or TestClient, matching the diagram. I would also verify that trace data and retry metrics are produced. The main downside is more test setup because the Idempotency Store and database failures must be controlled. All normal validation, rate limiting, and response behavior stays unchanged.

22. Explain the architecture and data flow of a project you built.System DesignMediumNvidia

Question Details

Choose a substantial project and draw its architecture and end-to-end data flow. Explain component responsibilities, interfaces, storage choices, scaling limits, failure modes, and the most important tradeoffs.

Short Interview Answer (30-60 seconds)

At a high level, this project is a real-time analytics platform. The main challenge is processing continuous event traffic quickly while keeping reports useful and reliable. I would explain it in three flows: ingestion, processing, and serving. Data enters through the API Gateway and Kafka. Flink and Spark prepare it for the Data Lake, Data Warehouse, and Redis cache. APIs, dashboards, and alerts then use the results. The main trade-off is freshness versus completeness.

Detailed Explanation

The goal is to collect data from several sources and turn it into useful analytics. The difficult part is handling continuous events while also supporting larger batch jobs. The diagram organizes the solution into ingestion, processing, storage, serving, and shared platform services.

Useful Questions to Ask the Interviewer
  1. Which user flows and system capabilities are required for the first version?
  2. What traffic, data volume, latency, and availability targets should I design for?
  3. Which consistency, security, geographic, and cost constraints matter most?
Explain the architecture and data flow of a project you built. diagram
How to Explain It in an Interview
1. Explain the goal and main data sources

I would start by saying this platform supports real-time and historical analytics. Web and mobile applications, operational databases, log files, and IoT devices produce the input data.

The main path moves from left to right. Data is accepted, processed, stored, and then exposed through APIs, dashboards, and alerts.

2. Explain the ingestion flow

For ingestion, web and mobile applications send data through the API Gateway using REST. The gateway provides one entry point for incoming requests.

The gateway sends raw events to Streaming Ingestion, which uses Kafka. Kafka buffers events and separates data producers from processing jobs. This helps the system handle short traffic spikes.

Authentication and Authorization protect access to the platform. Configuration Management keeps shared settings in one place.

3. Explain the processing flow

Stream Processing uses Flink for live events. It validates records, enriches them with useful details, and creates quick aggregations.

Batch Processing uses Spark for ETL, larger aggregations, and Data Quality work. ETL means reading data, changing it, and loading the result somewhere else. The two processing paths can exchange data when a job needs both live and historical information.

Data Quality Checks find missing or invalid records. Monitoring and Alerting watch job health and delays. Logging and Tracing help engineers follow data through the system.

4. Explain storage and serving

Processed data moves into the Storage Layer. The Data Lake uses object storage for raw and historical data. The Data Warehouse stores analytics data for SQL queries and reporting.

Redis works as a cache for hot data. Hot data means results that users request often. This reduces repeated work and makes common reads faster.

The serving layer exposes results through the Analytics API, Dashboard, and Alerts and Notifications. JDBC or SQL is used for warehouse access. Internal services can use gRPC for service-to-service communication.

5. Explain scale, failures, and trade-offs

The ingestion layer scales by adding API Gateway capacity and Kafka partitions. Flink and Spark scale by adding more workers. Storage scales through sharding and partitioning. Serving services stay stateless and run behind load balancers.

Important failures include source outages, network problems, Kafka consumer lag, processing job failures, and slow storage. Retries handle temporary errors. Backpressure slows incoming work when downstream systems cannot keep up. Checkpoints help processing jobs restart safely. Replication and alerts improve recovery.

The main trade-off is freshness versus completeness. Live processing gives fast results, while batch processing can produce more complete results. The design also balances cost versus performance, real-time versus batch work, consistency versus availability, and simplicity versus flexibility.

Engineering Considerations / Design Trade-offs

The benefit is that the platform supports both fast updates and deeper batch reports. Flink gives quick results, while Spark handles larger jobs. The downside is that two processing systems are harder to operate. Redis makes common reads faster, but cached results may be slightly old. The Data Lake stores history at lower cost, while the Data Warehouse supports faster reporting. Using both increases cost. We accept these trade-offs because dashboards need speed, while business reports often need more complete data.

Why Interviewers Ask This

Interviewers ask this question to see how you explain a real system from start to finish. They want to know whether you understand data flow, component responsibilities, storage choices, and system limits. They also test how you handle failures and scaling. A strong answer shows practical judgment and explains important trade-offs without hiding behind complex words.

Interviewer may ask next
How would you change the design if event traffic became ten times larger?

I would keep the same architecture, but increase capacity in each busy layer. The API Gateway would run more instances. Kafka would use more partitions so more consumers could process events in parallel.

I would add more Flink and Spark workers. This increases processing capacity without changing the main data flow. The Data Lake and Data Warehouse would use better partitioning so large writes and queries spread across more storage.

Monitoring and Alerting would watch Kafka consumer lag, worker use, and storage delay. Backpressure would slow incoming work when processing falls behind. This prevents queues from growing without control.

The design stays correct because data still follows the same ingestion, processing, storage, and serving path. The main downside is higher cost and more operational work. Poor partition choices can also create uneven load.

What would you do if the real-time dashboard showed incomplete data?

I would first trace the live path from Kafka through Flink to the Storage Layer. Monitoring and Alerting should show where records became delayed or failed. I would also check Kafka consumer lag, which means processors are behind the incoming event stream.

If a processing job failed, checkpoints would help it restart from a known position. Retries would handle temporary network or storage errors. Data Quality Checks would identify invalid or missing records before reports use them.

The Data Lake keeps raw and historical data. Spark can use that stored data to rebuild missing results. The Dashboard may show partial information while this repair runs.

This keeps the architecture unchanged and protects data correctness. The main downside is recovery time. Users may see delayed analytics until the missing data is processed again.

23. Design a Kubernetes-based service that remains available during pod failures.System DesignHardNvidia

Question Details

Design a Kubernetes deployment for a Python service. Explain service discovery, health checks, readiness, rolling updates, autoscaling, disruption budgets, persistent state, observability, and recovery when pods or nodes become unreachable.

Short Interview Answer (30-60 seconds)

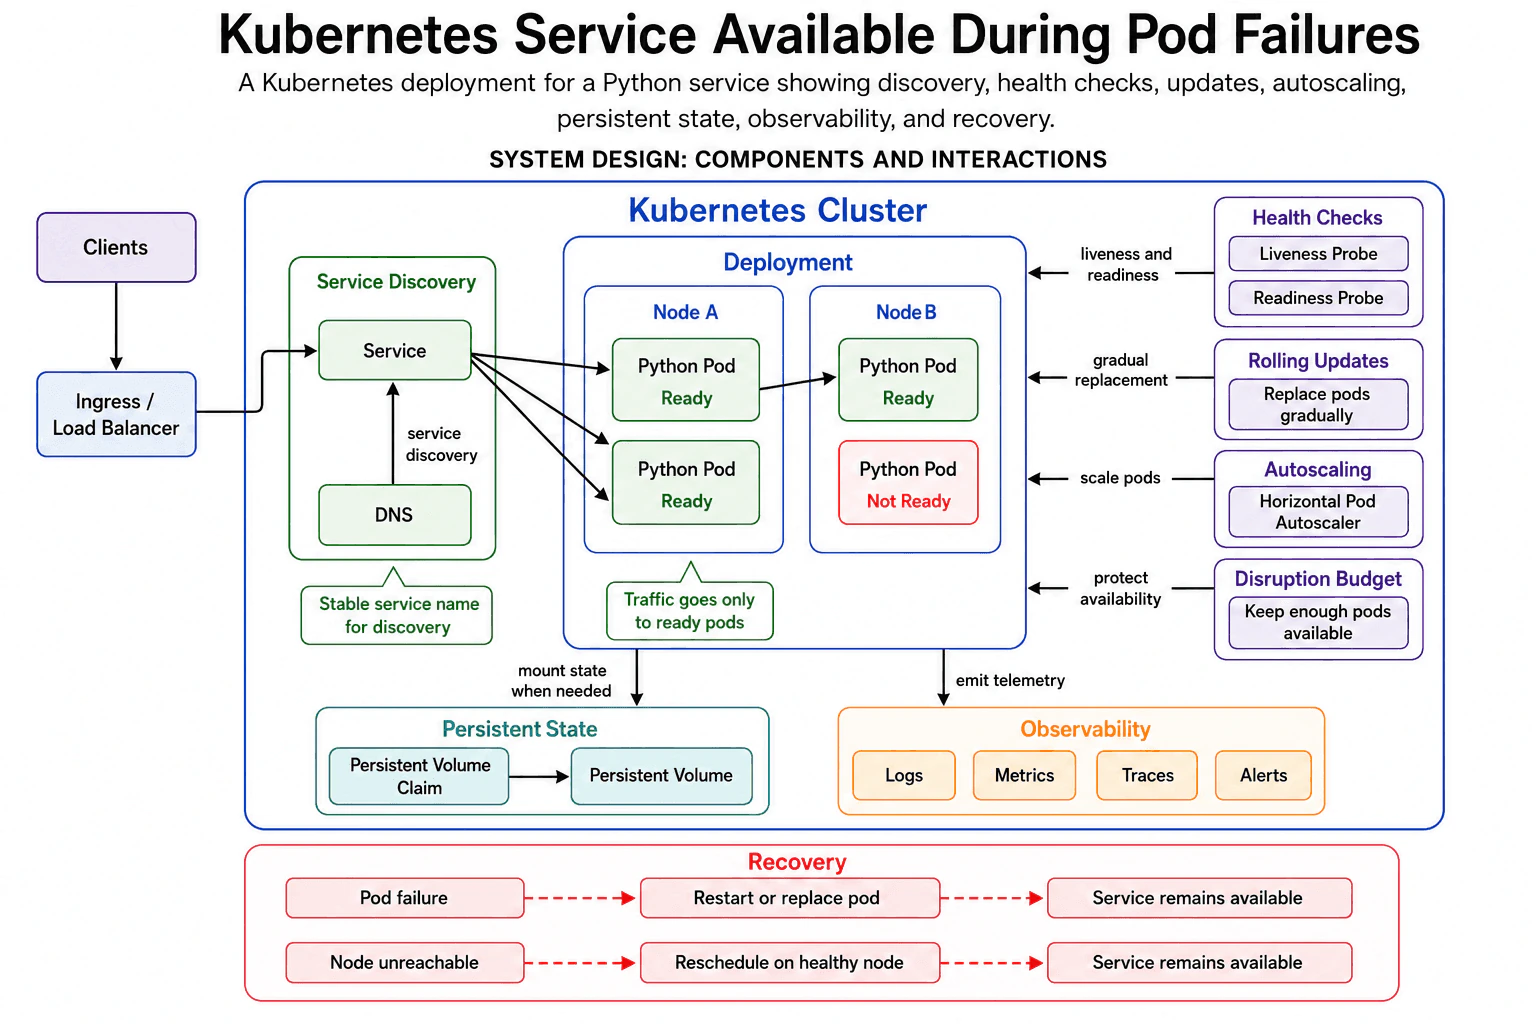
At a high level, this Python service must stay available when a pod fails. The main challenge is sending traffic only to ready pods while Kubernetes repairs failed work. I would explain the design in three parts: request routing, workload protection, and recovery. Clients enter through the Ingress / Load Balancer. The Service then routes requests across ready Python Pods on two nodes. Health checks, rolling updates, autoscaling, and a Disruption Budget protect availability. The downside is more setup and monitoring.

Detailed Explanation

The goal is to keep the Python service available when a pod or node stops working. The difficult part is removing unhealthy pods from traffic without stopping healthy requests. The design handles this in five connected areas. First, the Ingress and Service route requests. Next, readiness and liveness checks protect traffic and restart unhealthy pods. Rolling Updates, Autoscaling, and the Disruption Budget protect capacity. Persistent State keeps needed data outside a pod. Observability and recovery show failures and restore the workload.

Useful Questions to Ask the Interviewer
  1. Which user flows and system capabilities are required for the first version?
  2. What traffic, data volume, latency, and availability targets should I design for?
  3. Which consistency, security, geographic, and cost constraints matter most?
Design a Kubernetes-based service that remains available during pod failures. diagram
How to Explain It in an Interview
1. Explain the normal request path

I would start with how a normal request reaches the application. Clients send traffic to the Ingress / Load Balancer. It forwards that traffic to the Service.

The Service gives the application a stable network identity. DNS supports service discovery by resolving the Service name. The Service then routes traffic only to ready Python Pods.

This stable Service matters because individual pods can change. A restarted pod may receive a new network address. Clients still use the same Service name.

2. Explain the Deployment and health checks

The Deployment runs several Python Pods across Node A and Node B. This means one failed pod does not stop the application. Healthy pods can continue serving requests.

The Readiness Probe checks whether a pod can safely receive traffic. A pod marked Not Ready is not used by the Service. The remaining ready pods keep handling requests.

The Liveness Probe checks whether the application process is unhealthy or stuck. When this check fails, Kubernetes restarts or replaces that pod. Readiness protects current traffic, while liveness starts recovery.

3. Explain updates, scaling, and planned disruptions

Rolling Updates replace pods gradually. A replacement pod should become ready before an older pod is removed. This reduces downtime during a deployment.

The Horizontal Pod Autoscaler changes the number of pod replicas. It can add pods when more capacity is needed. It can remove pods when less capacity is needed.

The Disruption Budget protects availability during planned work. It keeps enough pods available while Kubernetes performs actions such as node maintenance. It does not prevent an unexpected failure, but it limits planned disruption.

4. Explain persistent state and observability

The Deployment can mount Persistent State when needed. A Persistent Volume Claim requests storage. The Persistent Volume keeps the data outside one pod.

This matters because pods are replaceable. A replacement pod can mount the needed state instead of losing it with the failed pod.

The Deployment also sends telemetry to Observability. Telemetry means Logs, Metrics, Traces, and Alerts. These signals help the team find failures and confirm that recovery worked.

5. Explain pod and node recovery

For a pod failure, Kubernetes restarts or replaces the pod. The Service continues routing requests to the other ready pods. The service remains available while the replacement starts.

For an unreachable node, Kubernetes reschedules the workload on a healthy node. The replacement pod must pass its Readiness Probe before receiving traffic. The main trade-off is extra operational complexity, but the design reduces downtime during common failures.

Engineering Considerations / Design Trade-offs

The benefit is better availability. One failed pod does not stop the whole service. Readiness keeps unhealthy pods out of traffic. Liveness helps Kubernetes restart broken pods. Rolling Updates lower deployment risk. Autoscaling adds capacity when needed. The Disruption Budget protects planned maintenance. Persistent storage keeps needed data outside one pod. The downside is more setup and more things to monitor. Bad health-check rules can also remove good pods or keep bad pods running. We accept this complexity because the service can continue working during common pod and node failures.

Why Interviewers Ask This

Interviewers ask this to test practical system-design judgment. They want to see whether the candidate understands stable routing, readiness, liveness, safe updates, scaling, storage, monitoring, and recovery. They also want to hear why several pods across nodes improve availability. A strong answer connects each Kubernetes feature to a real failure and explains the limits without promising perfect uptime.

Interviewer may ask next
How would the design change if an entire node becomes unreachable during high traffic?

I would keep the same design, but I would focus more on spare capacity and node recovery. The Deployment already spreads Python Pods across Node A and Node B. When one node becomes unreachable, Kubernetes reschedules its workload on a healthy node.

The Service must continue routing traffic only to ready pods. New pods should not receive requests until the Readiness Probe passes. The Horizontal Pod Autoscaler may add replicas if the remaining pods become overloaded. The Disruption Budget still protects planned disruptions, but it cannot prevent an unexpected node failure.

Observability should alert the team about the lost node, higher load, and slow pod startup. Persistent State remains available if the replacement pod can mount the Persistent Volume. The downside is that recovery needs enough free capacity on the healthy node. Without spare capacity, the service may remain available but handle less traffic for a short time.

What would you change if the Python service keeps important user state on disk?

I would keep the same request and health-check design, but Persistent State would become required. The Deployment would mount storage through a Persistent Volume Claim. The Persistent Volume would keep the user data outside the individual pod.

This protects the data when Kubernetes restarts or replaces a pod. The replacement pod can mount the same storage instead of starting with empty local data. Its Readiness Probe should stay unsuccessful until the volume is mounted and the application can safely use the stored state. That keeps incomplete pods out of Service traffic.

Logs, Metrics, Traces, and Alerts should show mount failures and slow recovery. The main downside is that storage becomes another important dependency. Pod recovery may also take longer because the replacement must attach and check the volume before it becomes ready.

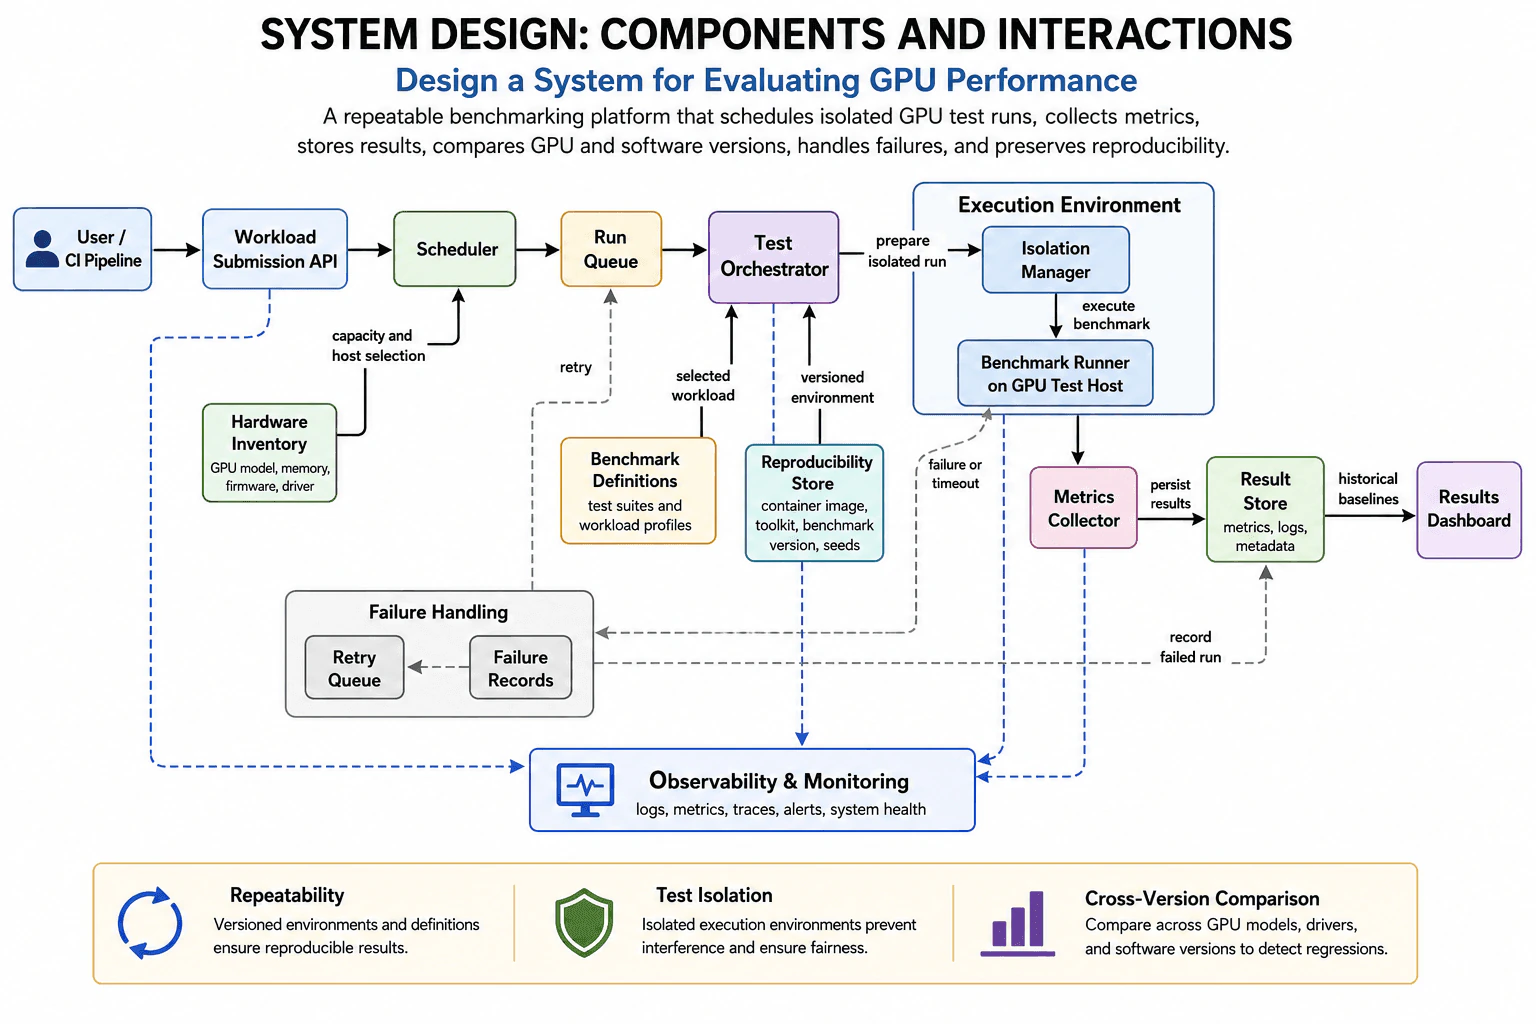
24. Design a system for evaluating GPU performance.System DesignHardNvidia

Question Details

Design a system that runs repeatable GPU-performance evaluations. Explain workload submission, test isolation, hardware inventory, benchmark execution, metric collection, result storage, comparison across GPU and software versions, failure handling, scheduling, and reproducibility.

Short Interview Answer (30-60 seconds)

At a high level, this system runs fair and repeatable GPU performance tests. The main challenge is controlling the hardware and software environment so different runs can be compared safely. I would explain it in three parts: submitting and scheduling work, running each benchmark in isolation, and collecting and comparing results. The design also records failures, retries eligible runs, and sends operational data to monitoring. The benefit is trustworthy results. The downside is extra scheduling and environment-management work.

Detailed Explanation

The goal is to measure GPU performance in a repeatable way. Running a benchmark once is easy. The difficult part is making sure every run uses the intended GPU, workload, driver, toolkit, container image, and random seed. The diagram separates the system into a scheduling path, an isolated execution path, and supporting paths for results, failures, and monitoring.

Useful Questions to Ask the Interviewer
  1. Which user flows and system capabilities are required for the first version?
  2. What traffic, data volume, latency, and availability targets should I design for?
  3. Which consistency, security, geographic, and cost constraints matter most?
Design a system for evaluating GPU performance. diagram
How to Explain It in an Interview
1. Explain the goal and the main idea

I would start by saying that every result must be fair and reproducible. Reproducible means another engineer can repeat the same test and get a comparable result.

The system therefore records both performance data and the environment used for the run. It also isolates each test so other workloads do not change the result.

2. Explain workload submission and scheduling

The User or CI Pipeline sends a benchmark workload to the Workload Submission API. The API passes the evaluation request to the Scheduler.

The Scheduler uses the Hardware Inventory for capacity and host selection. This inventory contains the GPU model, memory, firmware, and driver information.

After choosing suitable capacity, the Scheduler places the run in the Run Queue. The queue holds scheduled work until the Test Orchestrator can dispatch it.

3. Explain preparation and isolated execution

The Test Orchestrator receives the selected workload from Benchmark Definitions. These definitions contain the test suites and workload profiles.

It also receives a versioned environment from the Reproducibility Store. That store contains the container image, toolkit, benchmark version, and seeds. A seed is a fixed starting value that helps repeated tests behave consistently.

The orchestrator prepares an isolated run inside the Execution Environment. The Isolation Manager creates the controlled test setup. The Benchmark Runner then executes the benchmark on the GPU Test Host.

This isolation prevents one test from interfering with another. It makes comparisons between runs more reliable.

4. Explain metric collection and result comparison

The Benchmark Runner sends performance data to the Metrics Collector. The measured data can include throughput, latency, utilization, power, and temperature.

The Metrics Collector saves the results in the Result Store. The store keeps metrics, logs, and metadata about the run.

The Result Store sends historical baselines to the Results Dashboard. A baseline is an earlier result used for comparison. Engineers can compare GPU models, drivers, and software versions to find regressions. A regression means a newer setup performs worse than an older one.

5. Explain failures and monitoring

If a run fails or reaches its timeout, it enters Failure Handling. Failure Records keep the error details. The Retry Queue holds runs that are safe to try again.

Eligible retries return to the Run Queue. The system also records the failed run in the Result Store.

Observability & Monitoring receives data from the Workload Submission API, Test Orchestrator, Benchmark Runner, and Metrics Collector. It tracks logs, metrics, traces, alerts, and system health.

The main trade-off is extra complexity. The system needs more scheduling, isolation, and environment control. In return, it produces results that are much easier to trust and repeat.

Engineering Considerations / Design Trade-offs

The benefit is that different GPU runs can be compared fairly. The Hardware Inventory helps the Scheduler choose a suitable host. The Isolation Manager prevents another workload from changing the result. The Reproducibility Store keeps the exact software setup and seeds. The downside is more moving parts. The Scheduler, Run Queue, Test Orchestrator, isolation setup, failure records, and monitoring all need careful operation. Retried jobs may also wait longer in the queue. We accept this cost because a fast benchmark is not useful when its result cannot be trusted or repeated.

Why Interviewers Ask This

Interviewers ask this question to test how you break a broad performance problem into clear flows. They want to see whether you understand scheduling, hardware selection, isolation, metrics, stored baselines, retries, and reproducibility. They also check whether you can explain why each component exists and discuss the cost of making benchmark results fair and trustworthy.

Interviewer may ask next
How would this design handle a large increase in benchmark requests?

I would keep the same architecture and use the Run Queue to absorb the extra requests. The Scheduler would continue checking the Hardware Inventory before assigning work. This prevents too many runs from being sent to one GPU host.

The Test Orchestrator would dispatch a run only when matching capacity is available. Each run would still use its Benchmark Definitions and versioned environment from the Reproducibility Store. The Isolation Manager would still prepare a separate execution setup.

Observability & Monitoring would track queue growth, dispatch delays, and busy GPU hosts. This helps operators see whether more test hosts are needed.

The design stays correct because waiting jobs do not skip isolation or environment checks. The main downside is longer waiting time. Requests for a popular GPU model may remain in the Run Queue until that hardware becomes available.

What should happen when the same benchmark keeps failing?

I would stop retrying the run after a safe retry limit. The Retry Queue should only return eligible runs to the Run Queue. A run that repeatedly fails should remain in Failure Records for investigation.

The failed run should also be recorded in the Result Store, as shown in the diagram. Its record should include the workload, GPU host, environment version, logs, and failure reason. This helps engineers compare it with earlier successful runs.

Observability & Monitoring should raise an alert when repeated failures occur. The Workload Submission API and Test Orchestrator do not need a new flow. The change is mainly inside Failure Handling.

The main downside is that the system may finish without a performance result for that run. However, stopping endless retries protects GPU capacity and prevents one broken workload from delaying useful tests.

25. Design a scalable service and explain how you would scale it.System DesignMediumNvidia

Question Details

Given a service whose traffic is increasing, identify its likely bottlenecks and explain horizontal scaling, load balancing, state management, storage scaling, caching, backpressure, observability, and failure recovery.

Short Interview Answer (30-60 seconds)

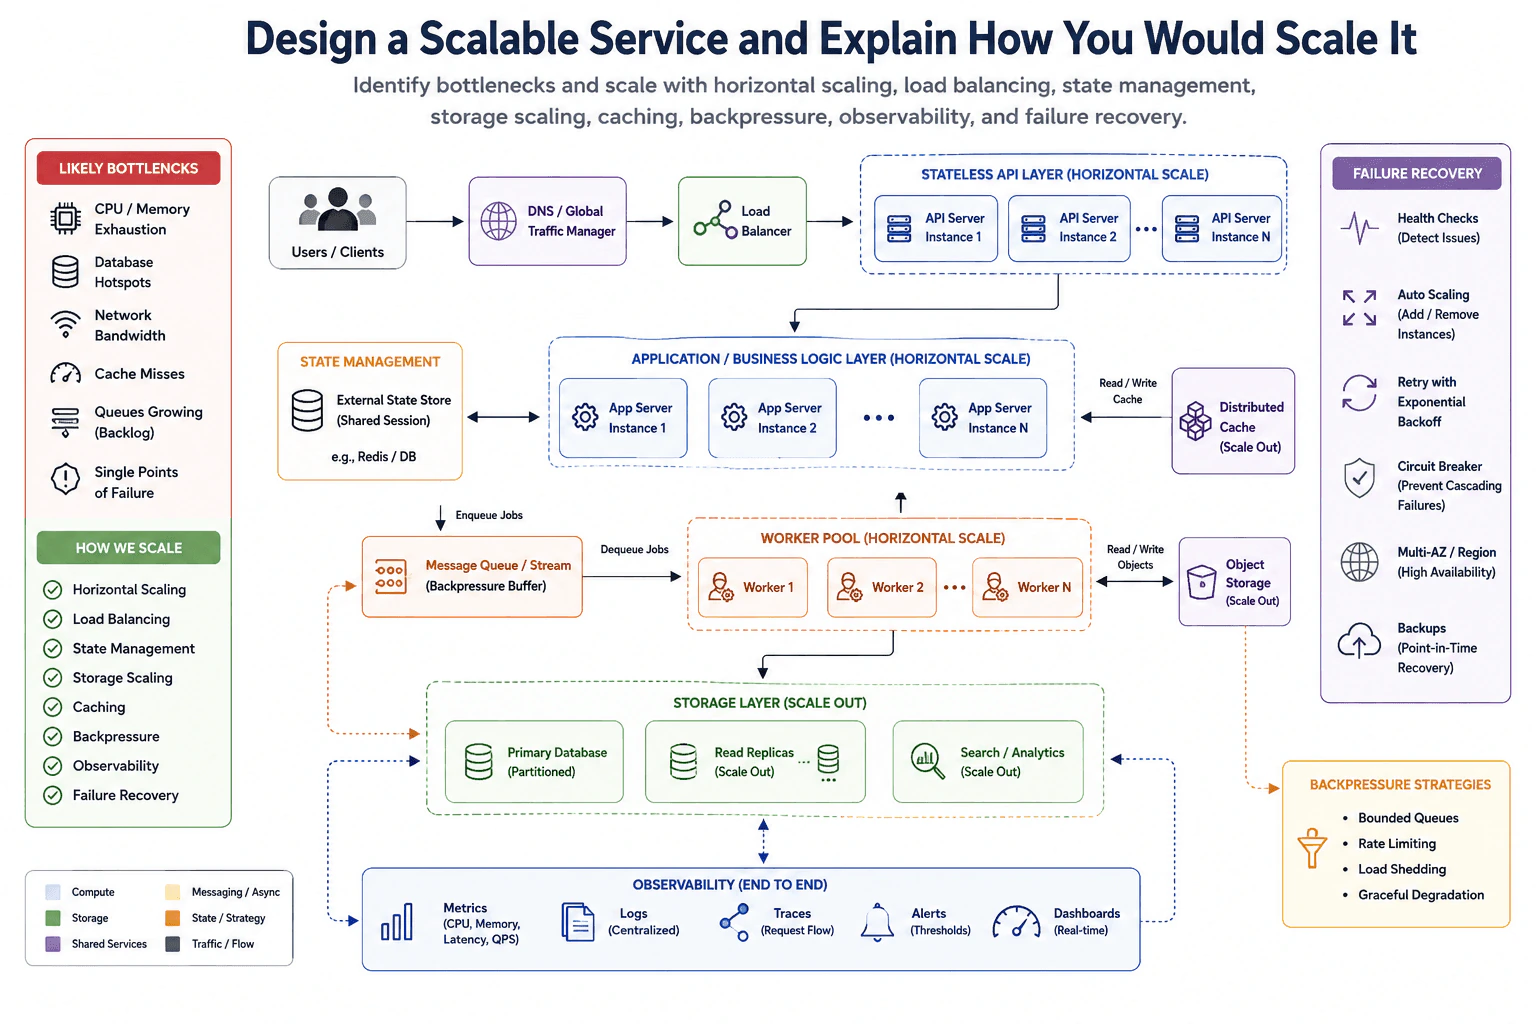
At a high level, the goal is to keep the service fast as traffic grows. The main challenge is finding which layer becomes overloaded first. I would explain the design in three parts: request handling, background jobs, and data storage. DNS and the Load Balancer spread requests across stateless API and App Server instances. The Distributed Cache reduces repeated work, while the Message Queue / Stream absorbs traffic spikes. The main trade-off is better scale with more operating complexity.

Detailed Explanation

The goal is to keep the service responsive while traffic continues to increase. One overloaded server, database, cache, queue, or network path can slow the whole service. The diagram solves this by separating request handling, shared state, background jobs, storage, observability, and failure recovery. Each part can then grow based on its own load instead of scaling everything together.

Useful Questions to Ask the Interviewer
  1. Which user flows and system capabilities are required for the first version?
  2. What traffic, data volume, latency, and availability targets should I design for?
  3. Which consistency, security, geographic, and cost constraints matter most?
Design a scalable service and explain how you would scale it. diagram
How to Explain It in an Interview
1. Explain the main request path

I would start with how a normal request enters the service. Users first reach DNS / Global Traffic Manager. It sends traffic toward the Load Balancer.

The Load Balancer sends each request to a healthy API Server instance. The Stateless API Layer contains several API Server instances. Stateless means an API server does not keep one user's session inside its own memory.

This makes horizontal scaling simple. We can add more API Server instances when traffic rises. The API layer then passes the request into the Application / Business Logic Layer.

That layer also contains several App Server instances. These servers run the main business rules. We can add more App Server instances when application work increases.

2. Keep shared state outside the servers

I would keep shared user state in the External State Store. The diagram shows shared sessions, such as Redis or a database. Any App Server can then continue the same user session.

This avoids tying one user to one server. If an App Server fails, another instance can handle the next request. It also lets the Load Balancer spread requests more evenly.

The Distributed Cache stores frequently used data. The Application / Business Logic Layer reads and writes through the cache path shown in the diagram. This lowers delay and reduces repeated work.

The cache is a speed layer, not the main stored data. If the needed data is missing, the application must use the scaled storage layer. The result can later be stored in the cache for faster access.

3. Move slow work into the background

I would keep long-running work outside the main user response. After the application handles the request and shared state, work can be placed into the Message Queue / Stream. The queue acts as a backpressure buffer, which means it absorbs short traffic spikes.

The Worker Pool removes jobs from the queue. Worker 1, Worker 2, and Worker N process those jobs separately. We can add more workers when the queue backlog grows.

The Worker Pool can also read and write Object Storage. This is useful for jobs that handle files or other large objects. The user-facing servers do not need to wait for this work.

The diagram also shows bounded queues, rate limiting, load shedding, and graceful degradation. These controls reduce or reject extra work during overload. They protect the queue, workers, cache, and storage systems from collapse.

4. Scale storage by workload

I would scale each storage type separately. The Primary Database is partitioned, which means its data is divided into smaller parts. This prevents one database node from handling all data and traffic.

Read Replicas serve extra read traffic. A read replica is a backup read copy of the Primary Database. It may be slightly behind the primary for a short time.

Object Storage scales independently for files and large objects. Search / Analytics also scales separately. This keeps search and reporting work from placing all its load on the Primary Database.

5. Observe problems and recover from failures

I would monitor the system from end to end. Metrics show CPU, memory, latency, and request rate. Logs, traces, alerts, and dashboards help locate the real bottleneck.

Health checks detect unhealthy instances. Auto Scaling adds or removes instances as demand changes. Retries use exponential backoff, which waits longer after each failed attempt.

Circuit breakers stop repeated calls to a failing dependency. Multi-AZ / Region deployment improves availability across locations. Backups support point-in-time recovery when stored data must be restored.

The benefit is that each layer can scale and fail more independently. The downside is more moving parts to operate, monitor, and debug.

Engineering Considerations / Design Trade-offs

The benefit is that each layer can grow on its own. We can add API Server instances, App Server instances, workers, cache capacity, and Read Replicas where needed. The Message Queue / Stream also protects the service during traffic spikes. The downside is more complexity. There are more machines, more data copies, and more failure paths. Cached data may be old for a short time. Read Replicas may also be slightly behind the Primary Database. Retries can increase pressure during an outage. We accept these costs because the service becomes faster, easier to scale, and more available.

Why Interviewers Ask This

Interviewers ask this question to test practical judgment. They want to see whether you can find the real bottleneck before adding machines. They also check whether you understand stateless servers, shared state, caching, queues, workers, storage scaling, and backpressure. A strong answer explains how failures are detected, how the service recovers, and what trade-offs come with adding more distributed parts.

Interviewer may ask next
What would you change if the Message Queue / Stream backlog keeps growing even after adding more workers?

I would first check whether the Worker Pool is the real bottleneck. The Observability section should show queue depth, worker processing time, job failures, and storage delay. If Object Storage or the Primary Database is slow, adding more workers could create even more pressure.

If worker capacity is the limit, I would add Worker instances gradually. I would confirm that the queue backlog begins to fall. The queue should remain bounded, which means it cannot grow forever.

Rate limiting and load shedding should reduce new work during overload. Graceful degradation can delay or reject less important work. Retries should use exponential backoff so failed jobs do not all retry together.

Correctness is protected because accepted jobs remain in the Message Queue / Stream until workers process them. The main downside is that some jobs may wait longer. During a severe spike, some lower-priority work may also be rejected.

How would the service handle a failure of the Primary Database?

I would keep the same storage design and use the recovery controls shown in the diagram. Health checks should detect that the Primary Database is unavailable. The application should stop sending unsafe writes to the failed database.

Read Replicas may continue serving some read traffic. However, a replica can be slightly behind the Primary Database. This means some users may briefly see older data.

Retries should use exponential backoff. This prevents every App Server from retrying at the same time. A circuit breaker should also stop repeated calls while the database remains unavailable.

Multi-AZ / Region deployment gives the system another location for recovery. Backups support point-in-time recovery if stored data must be restored. The service should return clear write errors instead of reporting success incorrectly.

The main downside is a short write interruption. Some reads may also remain stale until recovery finishes.

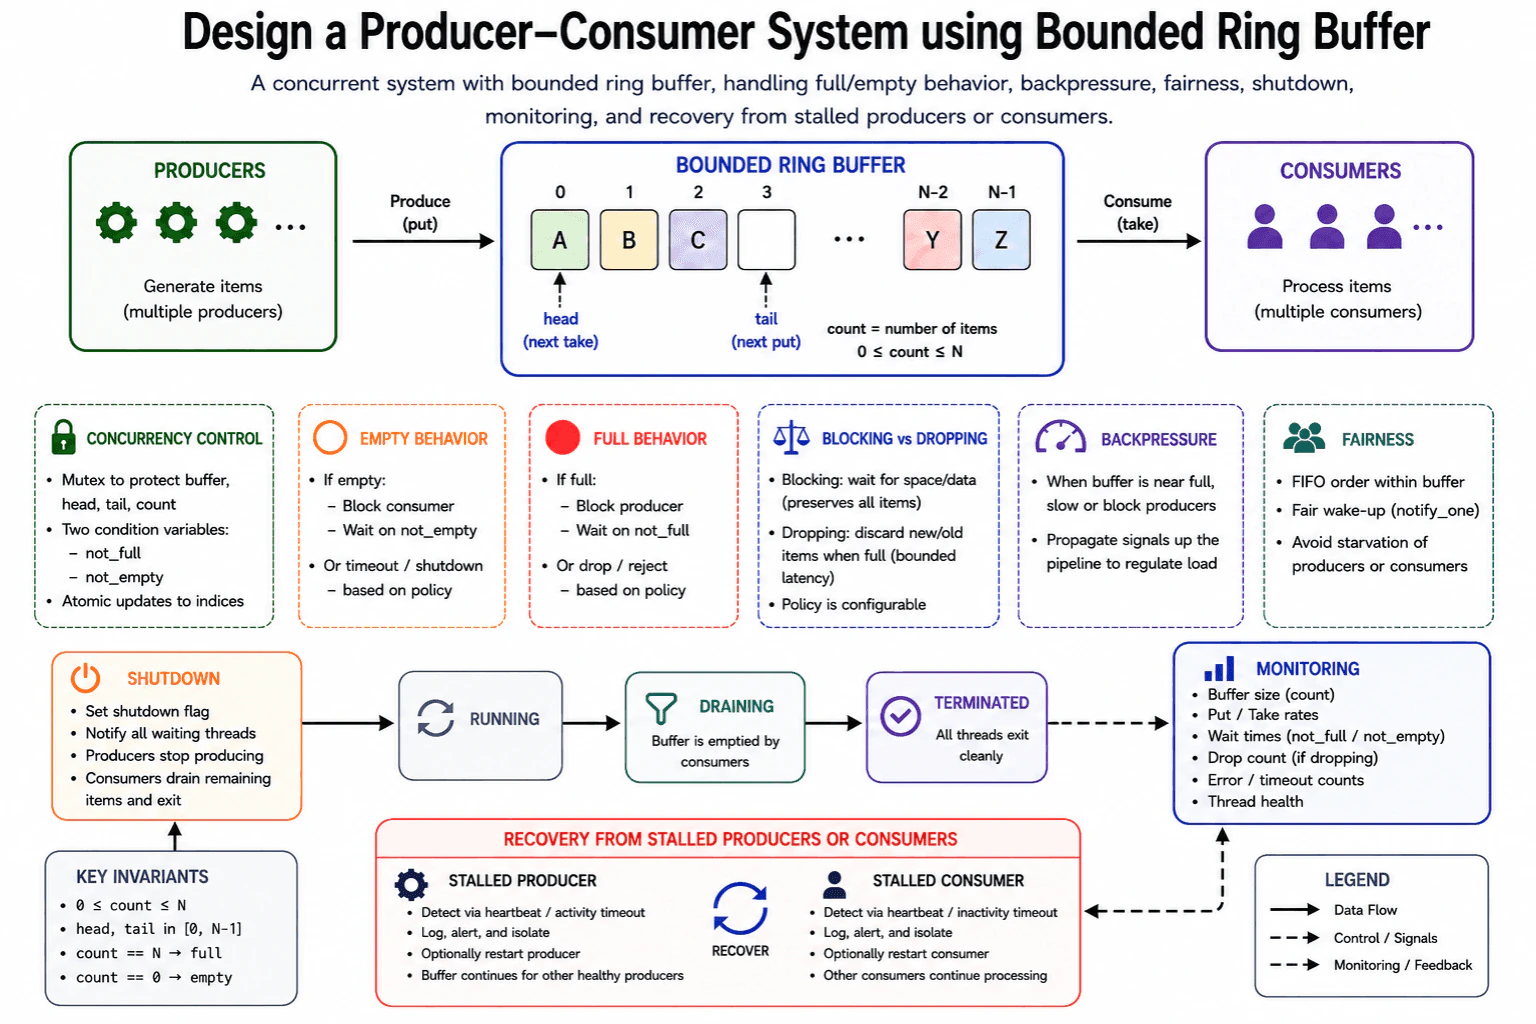
26. Design a producer-consumer system using a bounded ring buffer.System DesignMediumNvidia

Question Details

Design a producer-consumer system around a bounded ring buffer. Explain concurrency control, full and empty behavior, blocking versus dropping, backpressure, fairness, shutdown, monitoring, and recovery from stalled producers or consumers.

Short Interview Answer (30-60 seconds)

At a high level, this system safely moves items from many producers to many consumers. The main challenge is coordinating threads when a fixed-size buffer becomes full or empty. I would explain it in three parts: ring-buffer flow, concurrency control, and operations. A mutex protects head, tail, and count. The not_full and not_empty conditions block threads when needed. Backpressure slows producers, while shutdown drains queued items. The main trade-off is blocking to preserve items versus dropping to keep delay bounded.

Detailed Explanation

The goal is to move items safely from several producers to several consumers. The buffer has a fixed capacity, so memory use stays bounded. The difficult part is keeping head, tail, and count correct while many threads run together. The design uses a bounded ring buffer, one mutex, two condition variables, clear overload rules, and a controlled shutdown flow.

Useful Questions to Ask the Interviewer
  1. Which user flows and system capabilities are required for the first version?
  2. What traffic, data volume, latency, and availability targets should I design for?
  3. Which consistency, security, geographic, and cost constraints matter most?
Design a producer-consumer system using a bounded ring buffer. diagram
How to Explain It in an Interview
1. Explain the bounded ring buffer

I would start with the bounded ring buffer in the center. It contains N fixed slots. The tail points to the next slot where a producer can put an item. The head points to the next item a consumer can take.

The count stores how many items are currently buffered. It must always stay between zero and N. The buffer is empty when count is zero. It is full when count equals N.

Both indexes wrap around after the last slot. This circular movement lets the system reuse the same fixed memory.

2. Explain the producer and consumer paths

For the producer path, a producer creates an item and calls put. It acquires the mutex before reading or changing shared state. The mutex is one lock that protects head, tail, count, and the buffer slots.

The producer writes at tail, moves tail forward, and increases count. It then signals not_empty because a consumer may be waiting for data.

For the consumer path, a consumer calls take. It reads the item at head, moves head forward, and decreases count. It then signals not_full because a producer may be waiting for space.

3. Explain full, empty, and overload behavior

If the buffer is full, a blocking producer waits on not_full. It checks the full condition again after waking. This protects against wake-ups that happen before space is truly available.

If the buffer is empty, a consumer waits on not_empty. It also checks the empty condition again after waking.

Blocking preserves every accepted item, but waiting can increase delay. A dropping policy may reject a new item or discard an old item. Dropping keeps delay bounded, but some work is lost.

4. Explain backpressure and fairness

Backpressure means slowing producers when consumers cannot keep up. The diagram applies it when the buffer is near full. Producers may slow down or block until consumers create more space.

Fairness means avoiding a thread that waits forever. The buffer keeps FIFO item order. Wake-up handling should also give waiting producers and consumers reasonable chances to run. A notify_one-style signal wakes one suitable waiter without waking every thread.

5. Explain shutdown, monitoring, and recovery

For shutdown, the system first sets a shutdown flag. It wakes all waiting threads so none remain blocked forever. Producers stop adding new items. Consumers continue until the buffer is empty.

The state moves from Running to Draining, then to Terminated. Monitoring tracks buffer count, put and take rates, wait times, drops, errors, timeouts, and thread health.

Heartbeat or activity timeouts detect stalled producers and consumers. The system logs and isolates the stalled thread. It may restart that producer or consumer. Other healthy threads continue working.

The main trade-off is simple. Blocking protects every item but can increase waiting. Dropping limits delay but accepts controlled data loss.

Engineering Considerations / Design Trade-offs

The benefit is bounded memory because the buffer never grows beyond N items. Blocking keeps accepted items safe, but producers or consumers may wait longer. Dropping keeps delay lower, but some items are lost. Backpressure protects the system by slowing producers before the buffer remains full. Fair wake-ups reduce starvation, but the runtime may not guarantee perfect ordering between waiting threads. Graceful shutdown preserves buffered work, but stopping takes longer because consumers must drain it. Monitoring and restart logic improve recovery, but they add more code and operational work.

Why Interviewers Ask This

Interviewers use this question to test practical concurrency judgment. They want to see whether you can protect shared state, define correct full and empty rules, and avoid blocked threads during shutdown. They also check how you handle overload, fairness, monitoring, and stalled workers. A strong answer explains the blocking-versus-dropping trade-off clearly instead of only naming locks and conditions.

Interviewer may ask next
What would you change if producers stayed much faster than consumers for long periods?

I would keep the same bounded ring buffer, but make backpressure the main overload control. When the buffer count reaches a high level, producers should slow down or block on not_full. This keeps memory bounded and gives consumers time to catch up.

I would also choose the full-buffer policy clearly. If every item matters, producers must block until space is available. If low delay matters more, the system may reject new items or discard older items. Monitoring must show the drop count so the loss is visible.

The mutex, head, tail, and count rules do not change. Consumers still signal not_full after taking items. This keeps the buffer correct under concurrency.

The downside depends on the chosen policy. Blocking can slow the producer side and increase wait time. Dropping avoids long waits, but it loses work.

How would you shut down the system without losing items already stored in the buffer?

I would use the same Running, Draining, and Terminated states shown in the diagram. First, the system sets the shutdown flag and wakes all waiting threads. Producers then stop adding new items.

Consumers continue taking items until count becomes zero. Once the ring buffer is empty, the consumers exit cleanly. The system can then move from Draining to Terminated.

Every wait loop must check both the buffer condition and the shutdown flag. This prevents a producer or consumer from sleeping forever after shutdown begins.

Monitoring should show the remaining buffer count, thread health, and shutdown progress. If a consumer stalls while draining, the recovery logic detects the inactivity timeout and may restart that consumer.

The main downside is slower shutdown. The system must wait for the remaining items to finish before every thread can exit.

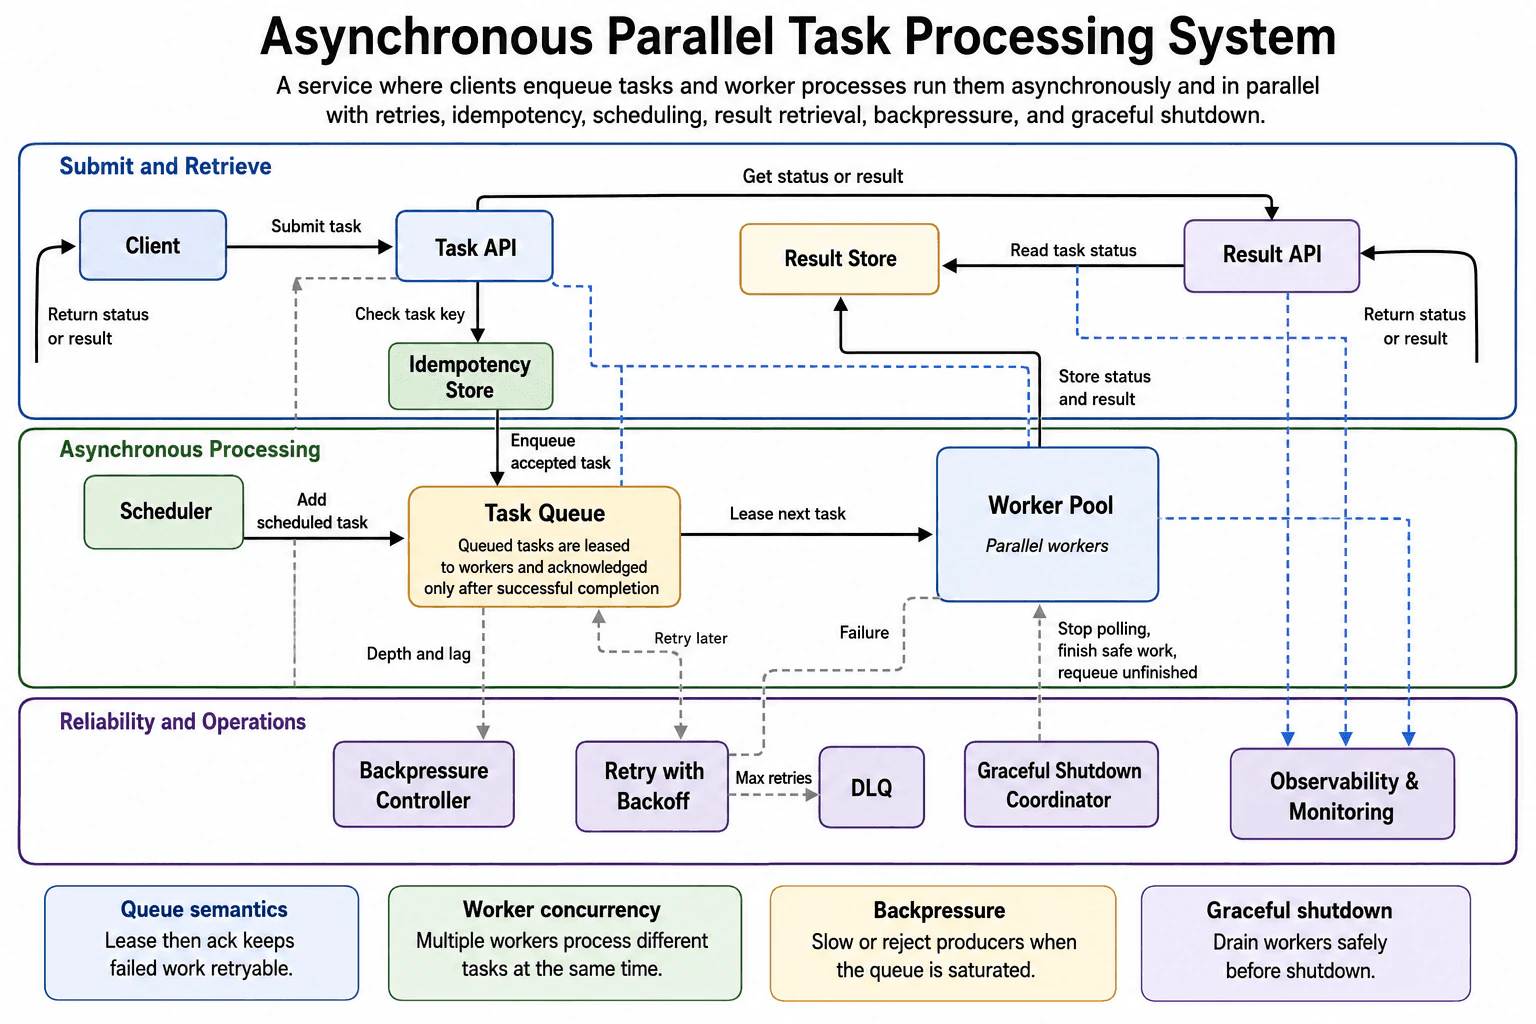
27. Design a system that supports asynchronous processing of many tasks in parallel.System DesignMediumNvidia

Question Details

Design a service where clients enqueue tasks and workers process them asynchronously and in parallel. Explain queue semantics, worker concurrency, retries, idempotency, scheduling, result retrieval, backpressure, and graceful shutdown.

Short Interview Answer (30-60 seconds)

At a high level, I would separate accepting a task from processing it. The main challenge is running many tasks in parallel without losing work or creating duplicates. I would explain three flows: task submission, worker processing, and result retrieval. The Task API checks the task key and places accepted work in the Task Queue. Workers lease tasks, store results, and retry failures. This adds operational complexity, but it keeps client requests fast and protects the system during heavy load.

Detailed Explanation

The system must accept tasks quickly, process many tasks in parallel, and let clients check results later. The difficult part is keeping tasks safe when workers fail, clients repeat requests, or the queue grows too large. The diagram solves this by separating task submission, background processing, and result retrieval. It also adds scheduling, retries, backpressure, monitoring, and graceful shutdown.

Useful Questions to Ask the Interviewer
  1. Which user flows and system capabilities are required for the first version?
  2. What traffic, data volume, latency, and availability targets should I design for?
  3. Which consistency, security, geographic, and cost constraints matter most?
Design a system that supports asynchronous processing of many tasks in parallel. diagram
How to Explain It in an Interview
1. Explain the main idea

I would start by separating task acceptance from task execution. The Task API should accept work quickly. It should not wait for the full task to finish.

The Task Queue holds accepted tasks until workers are ready. The Worker Pool processes many different tasks at the same time. The Client can check the task status through the Result API.

This separation keeps the client-facing path responsive. It also lets the worker capacity grow independently.

2. Explain task submission and duplicate protection

For the submit path, the Client sends a task to the Task API. The Task API checks the task key in the Idempotency Store.

Idempotency means that sending the same task again does not create duplicate work. The same task key identifies the earlier submission. This is important when a client retries after a timeout.

After this check, the Task API places the accepted task in the Task Queue. The Scheduler can also add scheduled tasks to the same queue. Both normal and scheduled tasks use the same processing path.

3. Explain queue behavior and worker processing

The Task Queue leases the next task to the Worker Pool. A lease means one worker temporarily owns that task. Other workers should not process it during that lease.

The Worker Pool contains parallel workers. Each worker can process a different task. This increases the amount of work completed at one time.

The task is acknowledged only after successful completion. An acknowledgment tells the queue that processing finished. If the worker fails first, the task remains retryable.

After success, the worker stores the task status and result in the Result Store. The Client later sends a status request to the Result API. The Result API reads the current status or result from the Result Store and returns it to the Client.

4. Explain retries and failed tasks

If processing fails, the task moves to Retry with Backoff. Backoff means waiting before trying the task again. This prevents rapid retries from making a temporary problem worse.

After the delay, the task returns to the Task Queue. A worker can then lease it again. If the task reaches the retry limit, it moves to the DLQ.

DLQ means dead-letter queue. It keeps tasks that could not complete after several attempts. These tasks can be reviewed separately without blocking normal work.

5. Explain overload, shutdown, and monitoring

The Task Queue reports its depth and delay to the Backpressure Controller. Queue depth means the number of waiting tasks. If the queue grows too much, the controller tells the Task API to slow or reject new submissions.

During shutdown, the Graceful Shutdown Coordinator tells workers to stop polling for new tasks. Workers finish safe in-flight work. Unfinished work returns to the queue.

Observability and Monitoring receives signals from the Task API, Task Queue, Worker Pool, and Result Store. This helps the team see failures, queue growth, worker problems, and result-store issues. The main trade-off is additional operational complexity, but the design stays responsive and handles failures safely.

Engineering Considerations / Design Trade-offs

The benefit is that clients do not wait for slow task processing. Many workers can process different tasks at the same time. Retries help recover from temporary failures. The DLQ keeps tasks that continue to fail. Backpressure protects the system when the queue grows too large. The downside is more complexity. The team must track task keys, leases, retry counts, queue depth, worker health, and stored results. Results are also not immediate because processing happens in the background. We accept this delay because the service can handle more work while keeping task submission fast.

Why Interviewers Ask This

Interviewers ask this question to test how you separate fast request handling from background work. They want to see whether you understand queue behavior, parallel workers, duplicate protection, retries, and overload control. They also check whether you can explain result retrieval, safe shutdown, failure handling, and trade-offs in a clear order instead of only naming components.

Interviewer may ask next
How would you change the design if every task must finish before a strict deadline?

I would keep the same architecture, but I would track each task's deadline with its queue entry and result status. The Task API would still check the task key and place accepted work in the Task Queue.

The Task Queue would need to prefer tasks that are closer to their deadlines. The Worker Pool would also check whether enough time remains before starting another retry. Retry with Backoff should stop retrying when the deadline has already passed.

The Result Store would record a timed-out status. The Result API could then return that clear status to the Client. The Backpressure Controller would become more important because it should slow or reject new work before waiting tasks miss their deadlines.

Duplicate protection remains unchanged because the Idempotency Store still uses the task key. The main downside is lower total capacity. Strict deadlines may force the service to reject more tasks, even when those tasks could have completed later.

What happens if a worker crashes after starting a task but before acknowledging it?

The queue lease protects the task. The worker owns the task only for the lease period. If the worker crashes before acknowledgment, the task can become available again after that lease ends.

The retry path then handles another attempt. Retry with Backoff waits before returning the task to the Task Queue. Another worker can lease and process it. If repeated attempts fail, the task eventually moves to the DLQ.

The task code must safely handle repeated execution because the first worker may have completed part of the work before crashing. The Idempotency Store prevents duplicate submissions from the Client, but the worker logic must also avoid harmful repeated side effects.

Observability and Monitoring should report the worker failure and rising queue delay. Backpressure can reduce new submissions while worker capacity recovers. The main downside is that some tasks may run more than once after a crash.

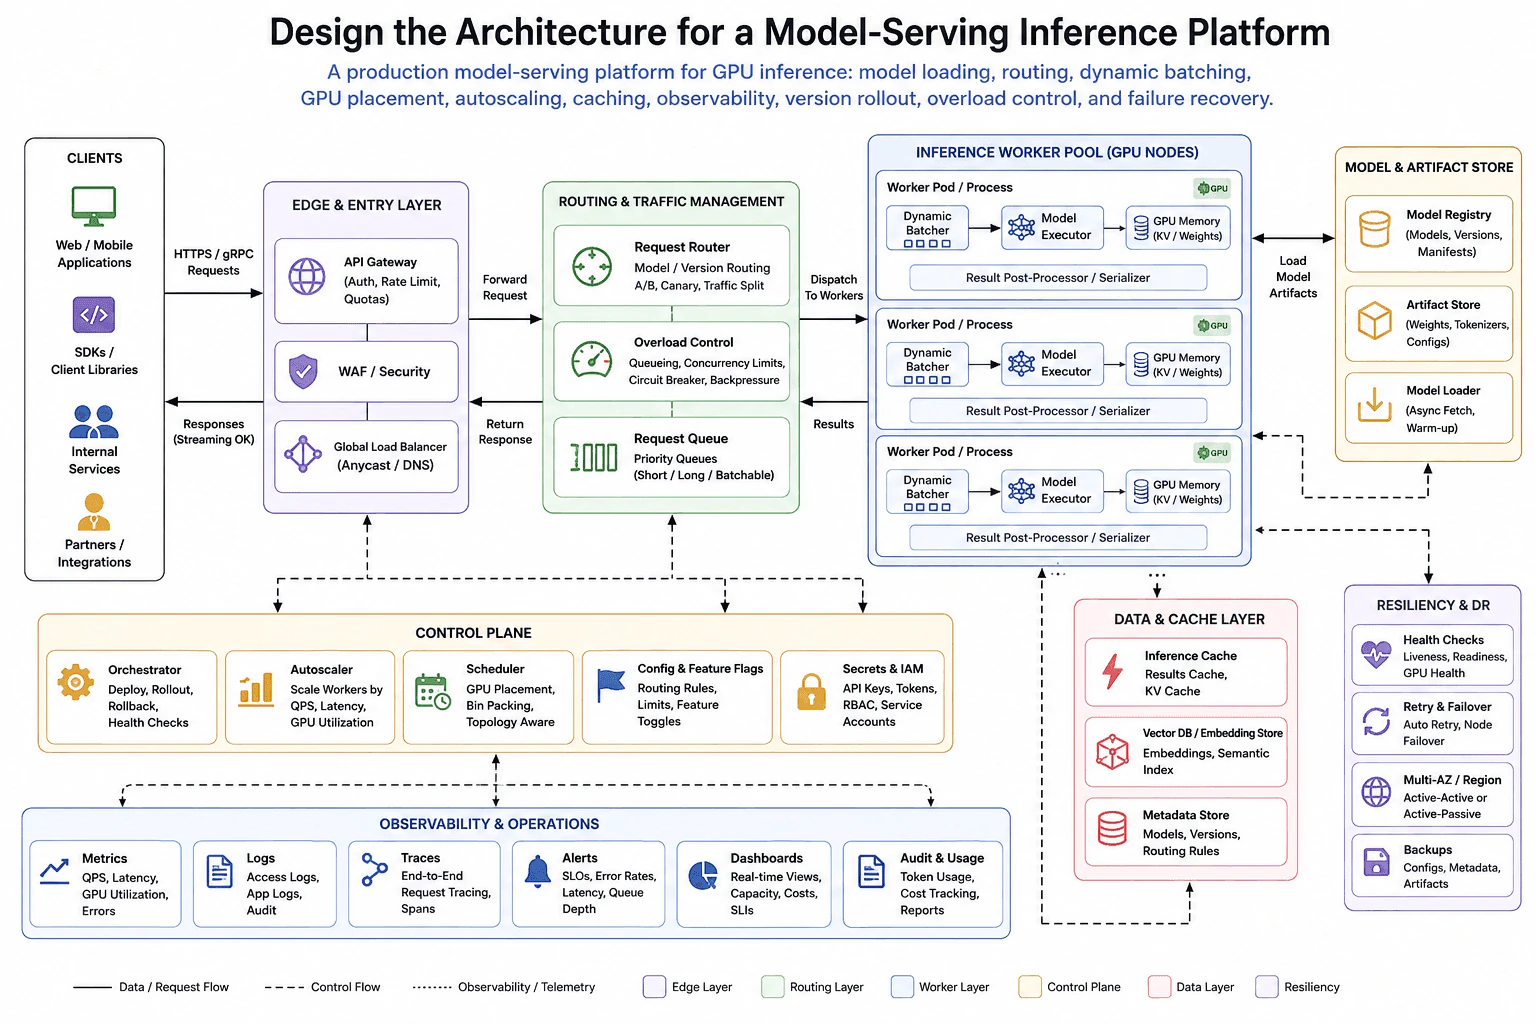
28. Design the architecture for a model-serving inference platform.System DesignHardNvidia

Question Details

Design a production model-serving platform for GPU inference. Explain model loading, request routing, dynamic batching, GPU placement, autoscaling, caching, observability, version rollout, overload control, and recovery from worker or GPU failure.

Short Interview Answer (30-60 seconds)

At a high level, this platform must run the right model on healthy GPUs and return results quickly. The main challenge is keeping latency low while traffic, model versions, and GPU health keep changing. I would explain it in three flows: request handling, GPU execution, and control work. Requests pass through the edge layer, routing, overload control, queues, and worker pods. The control plane manages loading, placement, scaling, rollout, and recovery. The downside is extra complexity, but it gives better speed and reliability.

Detailed Explanation

The goal is to accept inference requests and run the correct model on healthy GPU workers. The difficult part is that traffic changes, model versions change, and GPUs can fail. The diagram handles this by separating the request path from the control plane. The request path serves users. The control plane handles deployment, placement, scaling, and recovery.

Useful Questions to Ask the Interviewer
  1. Which user flows and system capabilities are required for the first version?
  2. What traffic, data volume, latency, and availability targets should I design for?
  3. Which consistency, security, geographic, and cost constraints matter most?
Design the architecture for a model-serving inference platform. diagram
How to Explain It in an Interview
1. Explain how requests enter

I would start with the clients on the left. Web or mobile apps, SDKs, internal services, and partners send HTTPS or gRPC requests. The Global Load Balancer sends traffic to healthy entry points.

The API Gateway checks authentication, rate limits, and quotas. The WAF performs security checks. These steps stop bad or excessive traffic before it reaches expensive GPU workers.

2. Explain routing and overload control

The Request Router chooses the model version and worker group. It supports A/B tests, canary routing, and traffic splitting. This lets a new version receive only a small share of production traffic.

Overload Control checks concurrency, queue size, circuit breakers, and backpressure. Backpressure means the platform slows or rejects new work when workers are full. The Request Queue keeps priority, short, long, and batchable requests until capacity is ready.

3. Explain model loading and GPU execution

The Scheduler places worker pods on suitable GPU nodes. It considers GPU placement, bin packing, and topology. In simple words, it tries to use available GPU capacity well.

The Model Loader fetches weights, tokenizers, and configs from the Artifact Store. It warms the model before routing traffic to it. The Model Registry tracks models, versions, and manifests.

Inside each worker pod, the Dynamic Batcher combines compatible requests. The Model Executor runs the batch using model data in GPU Memory. The Result Post-Processor and Serializer prepare the response. Results return through Routing and Traffic Management, then the Edge and Entry Layer.

4. Explain caching and supporting data

The Inference Cache stores reusable results and key-value data. A cache hit can avoid another model run. A cache miss continues through the normal queue and GPU path.

The Metadata Store keeps models, versions, and routing rules. The optional Vector DB stores embeddings for semantic lookup. These stores support serving, but the worker pool still performs inference.

5. Explain scaling, rollout, monitoring, and recovery

The Autoscaler watches QPS, latency, GPU use, and queue depth. It adds or removes workers as demand changes. The Orchestrator deploys versions and rolls back unhealthy releases.

Health Checks watch readiness, liveness, and GPU health. Retry and Failover move work away from failed workers or nodes. Multi-AZ or multi-region setup keeps another location ready, while backups protect configs, metadata, and artifacts.

Metrics, logs, traces, alerts, dashboards, and audit data show system health. The main trade-off is more operational work. We accept it because GPU serving needs careful routing, scaling, and recovery.

Engineering Considerations / Design Trade-offs

The benefit is fast and controlled GPU inference. Dynamic batching improves GPU use, but each request may wait briefly while a batch forms. Caching avoids repeated model runs, but cache keys and expiry rules must be correct. Canary rollout lowers release risk, but two model versions may run together. Autoscaling handles traffic changes, but GPU nodes need time to start and warm models. Retries improve reliability, but too many retries can increase load. Multi-AZ or multi-region recovery improves availability, but it adds cost and operating work. We accept these costs because model serving must stay responsive during change and failure.

Why Interviewers Ask This

Interviewers want to see whether you can split a large GPU-serving problem into clear flows. They check how you route requests, protect the platform from overload, use GPU capacity well, and release new models safely. They also want to hear how you handle worker failure, slow scaling, caching, security, and monitoring. The main skill is making sensible trade-offs and explaining them clearly.

Interviewer may ask next
How would the design handle a sudden ten-times traffic increase within a few minutes?

I would keep the same architecture, but I would make Overload Control more aggressive while new GPU workers start. The Autoscaler would react to queue depth, QPS, latency, and GPU use. The Scheduler would place new worker pods on available GPU nodes.

The Request Queue would keep priority work ahead of lower-priority requests. Concurrency limits, circuit breakers, and backpressure would stop the platform from accepting more work than it can finish. The Inference Cache would reduce repeated model runs when a reusable result already exists.

New workers must fetch model artifacts and complete warm-up before receiving traffic. The Orchestrator and Health Checks would keep unready workers out of routing. This keeps responses correct while capacity grows.

If the spike is larger than available capacity, some requests may wait or be rejected. The main downside is startup delay. GPU nodes and large models can take time to become ready, so autoscaling cannot remove every short traffic spike.

How would you roll out a new model version without risking all production traffic?

I would use the existing Model Registry, Artifact Store, Model Loader, Orchestrator, Request Router, and Health Checks. The new version would first be registered with its manifest and stored model artifacts. The Model Loader would fetch its weights, tokenizers, and configs, then warm it on a small worker group.

The Request Router would send only a small canary share to that version. A canary is a limited test with real production traffic. Metrics, logs, traces, latency, error rates, and GPU health would be watched during the rollout.

If the new version stays healthy, the Orchestrator would increase its traffic share. If it becomes unhealthy, the platform would roll back and route traffic to the older version. Config and Feature Flags can also stop the rollout quickly.

This keeps most users on the proven model while the new one is tested. The main downside is cost and operating complexity. Two versions may run together, and routing rules must remain clear during the transition.

29. Design a highly available payment-webhook processor.System DesignHardNvidia

Question Details

Design a service that receives payment webhooks and processes them reliably. Cover authentication, idempotency, durable ingestion, transaction boundaries, retries, dead-letter handling, reconciliation, audit logging, ordering, and observability.

Short Interview Answer (30-60 seconds)

At a high level, I would separate accepting a payment webhook from processing its payment update. The main challenge is handling duplicates, failures, and out-of-order events without losing data. I would explain three flows: secure intake, ordered processing, and recovery. The service verifies the request, checks idempotency, saves it in the Durable Inbox, and then acknowledges it. Workers update payment data inside one transaction. Retries, the Dead-Letter Queue, and the Reconciliation Service handle failures. The downside is added operational complexity.

Detailed Explanation

The goal is to accept payment webhooks safely and process every valid update without losing it. This is difficult because providers may retry requests, events may arrive in the wrong order, and workers may fail halfway through processing. The diagram solves this by separating secure intake, durable acceptance, ordered worker processing, and recovery.

Useful Questions to Ask the Interviewer
  1. Which user flows and system capabilities are required for the first version?
  2. What traffic, data volume, latency, and availability targets should I design for?
  3. Which consistency, security, geographic, and cost constraints matter most?
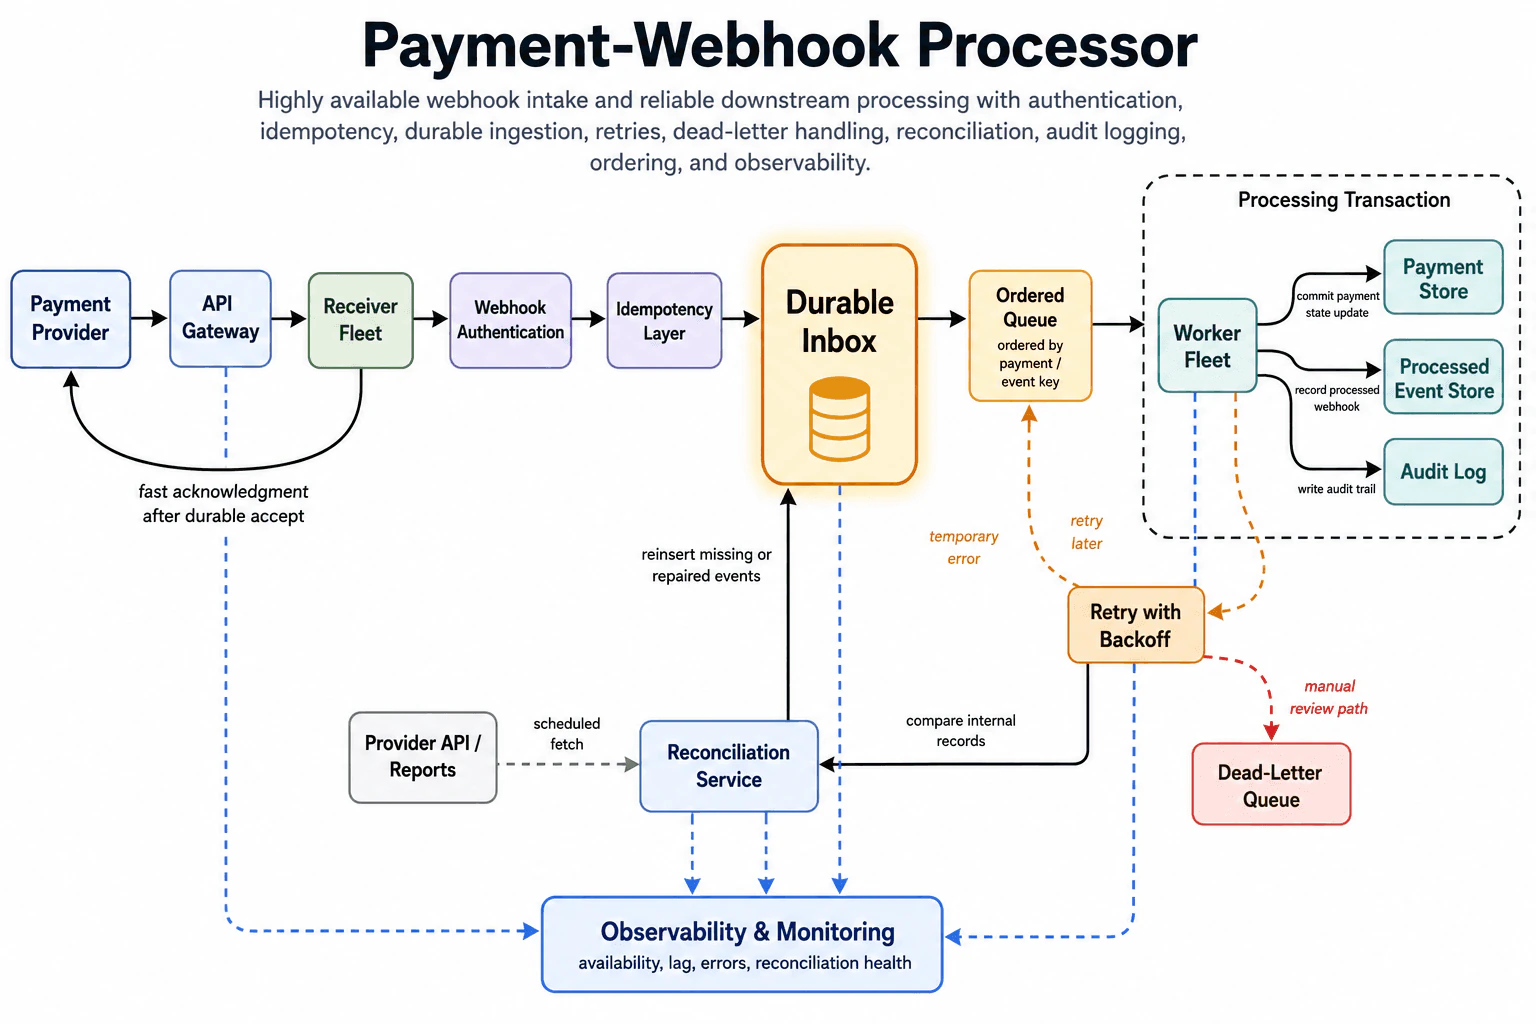
Design a highly available payment-webhook processor. diagram
How to Explain It in an Interview
1. Explain the goal and the main idea

I would begin by separating request acceptance from payment processing. The provider should receive a quick response after the webhook is safely stored. It should not wait for every payment update and audit write to finish.

The Durable Inbox is the safety point. Once the event is stored there, later work can retry without asking the provider to send it again.

2. Explain the secure intake path

The Payment Provider sends the webhook through the API Gateway. The Receiver Fleet accepts the request and passes it through Webhook Authentication. This step checks that the request came from the expected provider.

The Idempotency Layer then checks whether the same webhook was already accepted. Idempotency means a repeated request should not create a second payment change.

The event is written to the Durable Inbox before the service replies. Durable means the event remains saved if a process crashes. After that write succeeds, the Receiver Fleet sends the fast acknowledgment back to the Payment Provider.

3. Explain ordered worker processing

The Durable Inbox passes accepted events to the Ordered Queue. The queue groups related work by payment or event key. This keeps updates for the same payment in the correct order.

The Worker Fleet reads events from that queue. Inside the Processing Transaction, the worker updates the Payment Store, writes the event into the Processed Event Store, and adds an entry to the Audit Log.

The transaction boundary keeps these related writes together. They either complete together or fail together. This prevents payment state from changing without the processed marker or audit record.

4. Explain retries and dead-letter handling

A temporary worker error sends the event to Retry with Backoff. Backoff means the system waits before trying again. The delay helps avoid repeated pressure on a failing dependency.

After the wait, the event returns to the Ordered Queue. If repeated attempts still fail, it moves to the Dead-Letter Queue. This queue holds the event for manual review instead of blocking normal payment work.

5. Explain recovery and monitoring

The Reconciliation Service performs a scheduled fetch from the Provider API or Reports. It compares those records with the internal Payment Store. If it finds a missing or repaired event, it reinserts that event into the Durable Inbox.

Observability and Monitoring receives signals from the API Gateway, Durable Inbox, Worker Fleet, and Reconciliation Service. It tracks availability, delay, errors, and reconciliation health. The main trade-off is more components and more operational work, but the design gives strong recovery, ordering, and audit support.

Engineering Considerations / Design Trade-offs

The benefit is stronger payment correctness. The Durable Inbox protects accepted events from being lost. The Ordered Queue keeps related updates in the right order. The Processed Event Store helps prevent the same webhook from changing payment data twice. Retry with Backoff handles short failures, while the Dead-Letter Queue separates events that need manual work. The Reconciliation Service can repair missed updates. The downside is more moving parts. The team must monitor queue delay, failed retries, transaction errors, and reconciliation results. We accept this extra work because payment updates must be safe and traceable.

Why Interviewers Ask This

Interviewers ask this question to test how you design for real failures. They want to see whether you can separate fast request acceptance from background processing. They also check your understanding of authentication, duplicate handling, ordering, safe transactions, retries, audit records, and recovery. A strong answer explains why each part exists and describes the trade-offs without claiming perfect delivery or perfect availability.

Interviewer may ask next
What would you change if the payment provider often sends events out of order for the same payment?

I would keep the same architecture, but I would rely more strongly on the Ordered Queue and the payment or event key. Every event for the same payment should use the same key. This keeps those events on one ordered processing path.

The Worker Fleet should also check the current Payment Store state before applying an update. An older event should not replace a newer payment state. The Processed Event Store still prevents the same webhook from being applied twice. The Audit Log records accepted, ignored, and failed updates for later review.

If an expected event never arrives, the Reconciliation Service compares Provider API or Reports with the internal Payment Store. It can reinsert the missing event into the Durable Inbox. The main downside is slower processing for one busy payment because its events must wait in order.

What happens if one webhook keeps failing every time a worker processes it?

I would keep that event on the recovery path shown in the diagram. The Worker Fleet first sends it to Retry with Backoff. The system waits before trying again, and then returns the event to the Ordered Queue.

The Processed Event Store ensures that an earlier partial attempt does not cause the same completed update to run twice. The Processing Transaction also keeps the Payment Store, processed marker, and Audit Log consistent when an attempt fails.

If the event keeps failing, it moves to the Dead-Letter Queue. That prevents one bad event from blocking normal payment work. Monitoring should alert the team so the event can be inspected and replayed after the cause is fixed. The main downside is that this payment update may remain unresolved until manual action is completed.

30. Design a distributed tracing system for diagnosing cross-service latency.System DesignHardNvidia

Question Details

Design a tracing platform that propagates trace context, collects spans, samples traffic, stores and queries traces, identifies the critical path, protects sensitive data, scales ingestion, and remains useful during partial outages.

Short Interview Answer (30-60 seconds)

At a high level, this system follows one request across many services and shows where time is lost. The main challenge is collecting useful spans at high volume without slowing the application or exposing sensitive data. I would explain it in three flows: context and span collection, storage and search, then latency analysis. Services send spans through Edge Collectors and a scalable Ingestion Pipeline. The platform stores recent and older traces, builds an Index, and finds the critical path. The trade-off is better visibility versus higher processing and storage cost.

Detailed Explanation

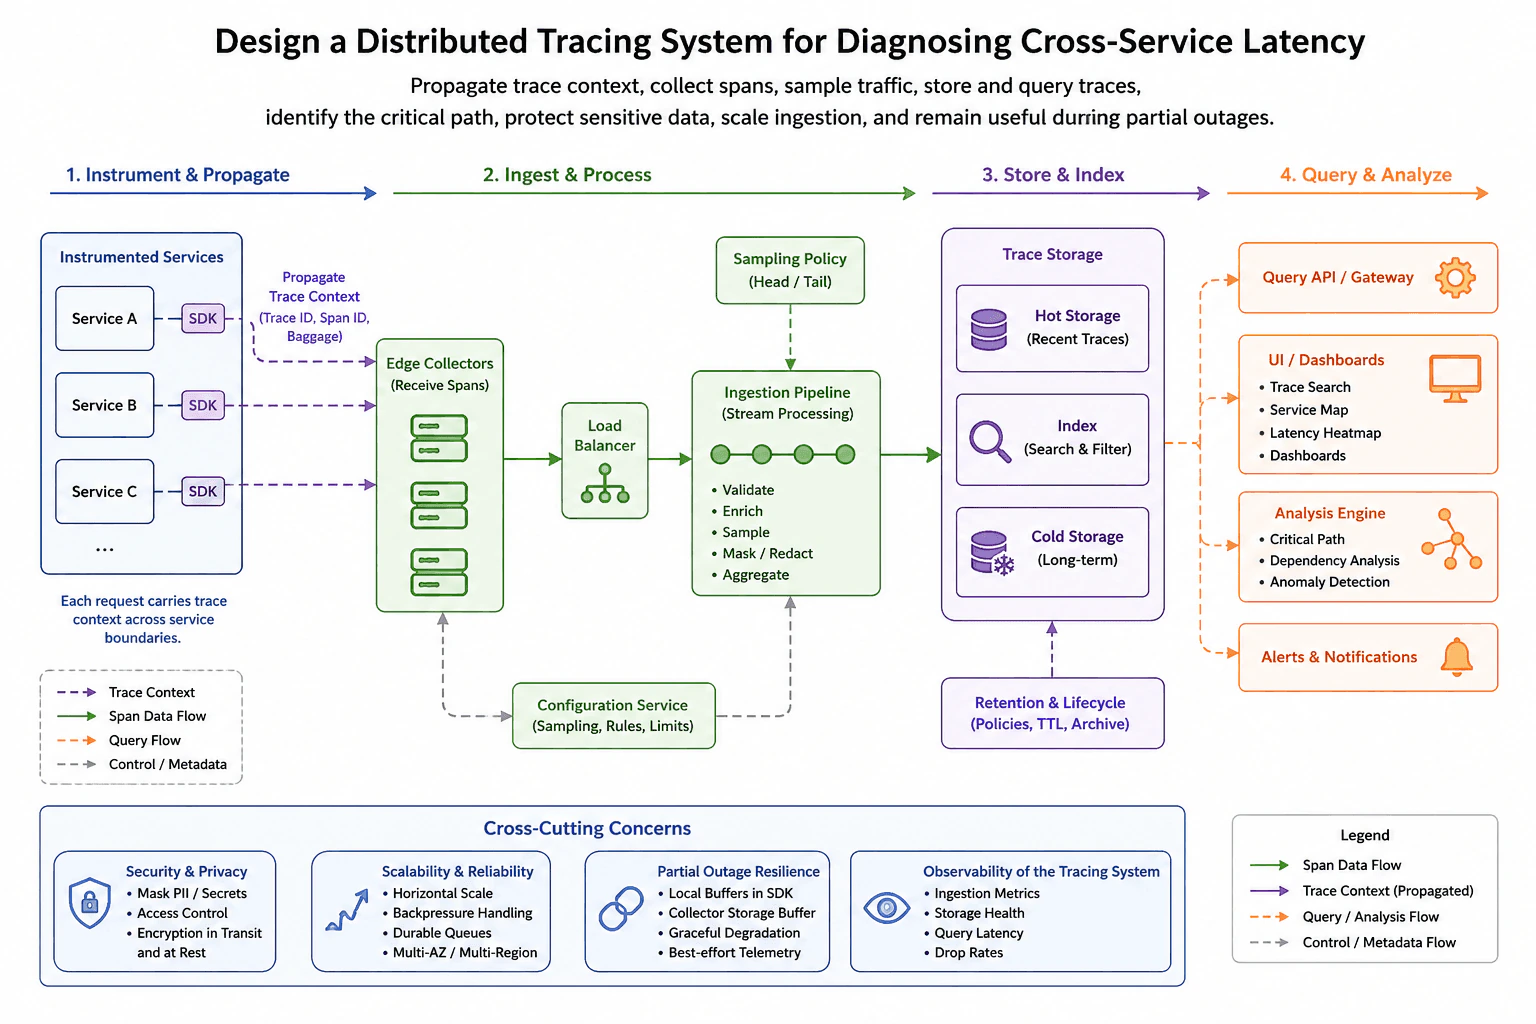
The goal is to follow one request across several services and find the slow part. Each service sees only its own work, so the platform must rebuild the complete request path. It must also handle heavy trace traffic, protect private data, and remain useful during partial outages. The diagram solves this through four stages: instrument and propagate, ingest and process, store and index, then query and analyze.

Useful Questions to Ask the Interviewer
  1. Which user flows and system capabilities are required for the first version?
  2. What traffic, data volume, latency, and availability targets should I design for?
  3. Which consistency, security, geographic, and cost constraints matter most?
Design a distributed tracing system for diagnosing cross-service latency. diagram
How to Explain It in an Interview
1. Explain trace context across services

I would start by saying that every request carries trace context across service boundaries. The context contains a Trace ID, Span ID, and Baggage. A Trace ID connects all spans created for one request. A Span ID identifies one unit of work inside that trace.

Service A, Service B, and Service C use an SDK. The SDK creates spans and passes the same trace context to the next service. This shared context lets the tracing platform rebuild the full request path later.

2. Explain collection and ingestion

The services send span data to Edge Collectors. These collectors receive spans near the applications. A Load Balancer spreads incoming work across the Ingestion Pipeline.

The Ingestion Pipeline validates and enriches each span. It also samples traffic, masks or redacts sensitive fields, and aggregates useful data. Sampling means keeping selected traces instead of storing every trace.

The Sampling Policy supports head and tail sampling. Head sampling makes the choice early. Tail sampling waits for more trace information before choosing. This can help keep slow or unusual traces.

The Configuration Service provides sampling rules and limits. It sends control information to the Edge Collectors and Ingestion Pipeline. This allows behavior to change without updating every application.

3. Explain storage and indexing

Processed spans move into Trace Storage. Hot Storage keeps recent traces for fast investigations. Cold Storage keeps older traces for a longer time at lower cost.

The Index stores searchable trace and span fields. It helps engineers find traces without scanning all stored data. Retention and Lifecycle rules control policies, time limits, and archival. These rules decide when older traces move toward long-term storage.

4. Explain search and latency diagnosis

The Query API and Gateway read through the Index and Trace Storage. The UI and Dashboards support trace search, service maps, latency heatmaps, and operational dashboards.

The Analysis Engine finds the critical path. The critical path is the chain of spans that controls the total request time. It also performs dependency analysis and anomaly detection. Alerts and Notifications surface important latency, error, or unusual behavior.

5. Explain scale, failures, and protection

Edge Collectors, ingestion workers, and storage can scale separately. Backpressure protects the system when incoming trace traffic becomes too large. Durable queues absorb short spikes and reduce data loss.

During a partial outage, SDKs use local buffers. Edge Collectors also use storage buffers. The platform retries when possible and continues with best-effort telemetry. Some spans may be missing, but stored traces and the query path can remain useful.

Sensitive fields are masked or redacted. Access Control limits who can view trace data. Encryption protects data while moving and while stored. The tracing platform also watches ingestion metrics, storage health, query latency, and drop rates. The main trade-off is keeping enough detail for diagnosis without creating too much cost or load.

Engineering Considerations / Design Trade-offs

The benefit is clear visibility across many services. Engineers can search one request and find its critical path quickly. Hot Storage makes recent investigations fast. Cold Storage reduces the cost of keeping older traces. The downside is more processing, storage, and operating work. Sampling reduces that cost, but it may remove a rare trace that would help debugging. Local buffers and durable queues help during short failures, but every buffer needs a size limit. Masking protects sensitive data, but it may remove useful details. We accept these limits because the tracing system must not harm the main application.

Why Interviewers Ask This

Interviewers want to see whether you can connect work across many services and find the real cause of latency. They also test whether you can separate collection, processing, storage, search, and analysis. A strong answer shows good judgment about sampling, sensitive data, scaling, partial outages, and cost. The goal is clear trade-off thinking, not memorizing product names.

Interviewer may ask next
How would you change this design if trace traffic became ten times larger?

I would keep the same architecture, but scale the collection, ingestion, indexing, and storage parts separately. More Edge Collectors would receive spans near the services. The Load Balancer would spread traffic across more Ingestion Pipeline workers.

I would also adjust the Sampling Policy. Normal traffic could use a lower sample rate. Tail sampling could still keep slow, failed, or unusual traces after more span data arrives. Backpressure would protect the pipeline when incoming work exceeds safe limits. Durable queues would absorb short spikes.

Hot Storage would keep a smaller recent window for fast investigations. Retention and Lifecycle rules would move older traces into Cold Storage sooner. The Index would scale with the searchable fields and trace volume.

Trace IDs and Span IDs would still connect the request correctly. The main downside is that stronger sampling may hide rare problems. More collectors, workers, index capacity, and storage also increase operating cost.

What happens when the Ingestion Pipeline is partly unavailable?

I would keep the same design and use the partial-outage controls shown in the diagram. SDKs would place spans in local buffers for a short time. Edge Collectors would also use storage buffers before sending data onward.

When healthy ingestion workers return, buffered spans can be retried. Durable queues help absorb temporary failures and traffic spikes. Backpressure stops the tracing system from using too much memory or affecting the main services.

If buffers reach their limits, the platform uses best-effort telemetry. This means it may drop some spans instead of blocking user requests. Ingestion metrics and drop rates show how much data was lost. Storage health and query latency show whether the remaining platform is working.

Already stored traces can still be searched through the Query API and Gateway. The main downside is that new traces may be incomplete, so the Analysis Engine may not identify the full critical path.

More questions load as you scroll

Disclaimer: This interview guide is for educational and informational purposes only. It is designed to help readers prepare, but it does not guarantee any interview result, hiring decision, offer, or outcome. Interview questions, hiring criteria, and preferred answers can vary by employer, interviewer, industry, location, and time. The examples and explanations reflect the authors' research and judgment, are provided without warranties of any kind, and should not be treated as the only correct approach. Diagrams are simplified illustrations intended to highlight the main components and their interactions; actual systems and implementations may be more complex. Alternative approaches may be equally valid or better suited to a particular question, context, or interviewer. To the fullest extent permitted by applicable law, the author, contributors, and publisher are not liable for decisions made, actions taken, or losses incurred based on this guide.

Company Notice: This guide is an independent educational resource and is not affiliated with, endorsed by, sponsored by, or approved by the company named in this guide. Company names are used only to identify interview experiences commonly reported by candidates. Interview practices can change without notice, and inclusion of company-specific content does not mean these questions are official, complete, or guaranteed to be asked. To the fullest extent permitted by law, the author, contributors, and publisher are not responsible for outcomes related to use of this material.