227 Php Developer Interview Questions & Answers

116 top • 13 Amazon • 21 Google • 10 Netflix • 7 Meta • 18 NVIDIA • 21 Apple • 21 Microsoft

Php Developer icon

Questions with Detailed ExplanationsWith Detailed Explanations

(Last Updated: August 28, 2026)

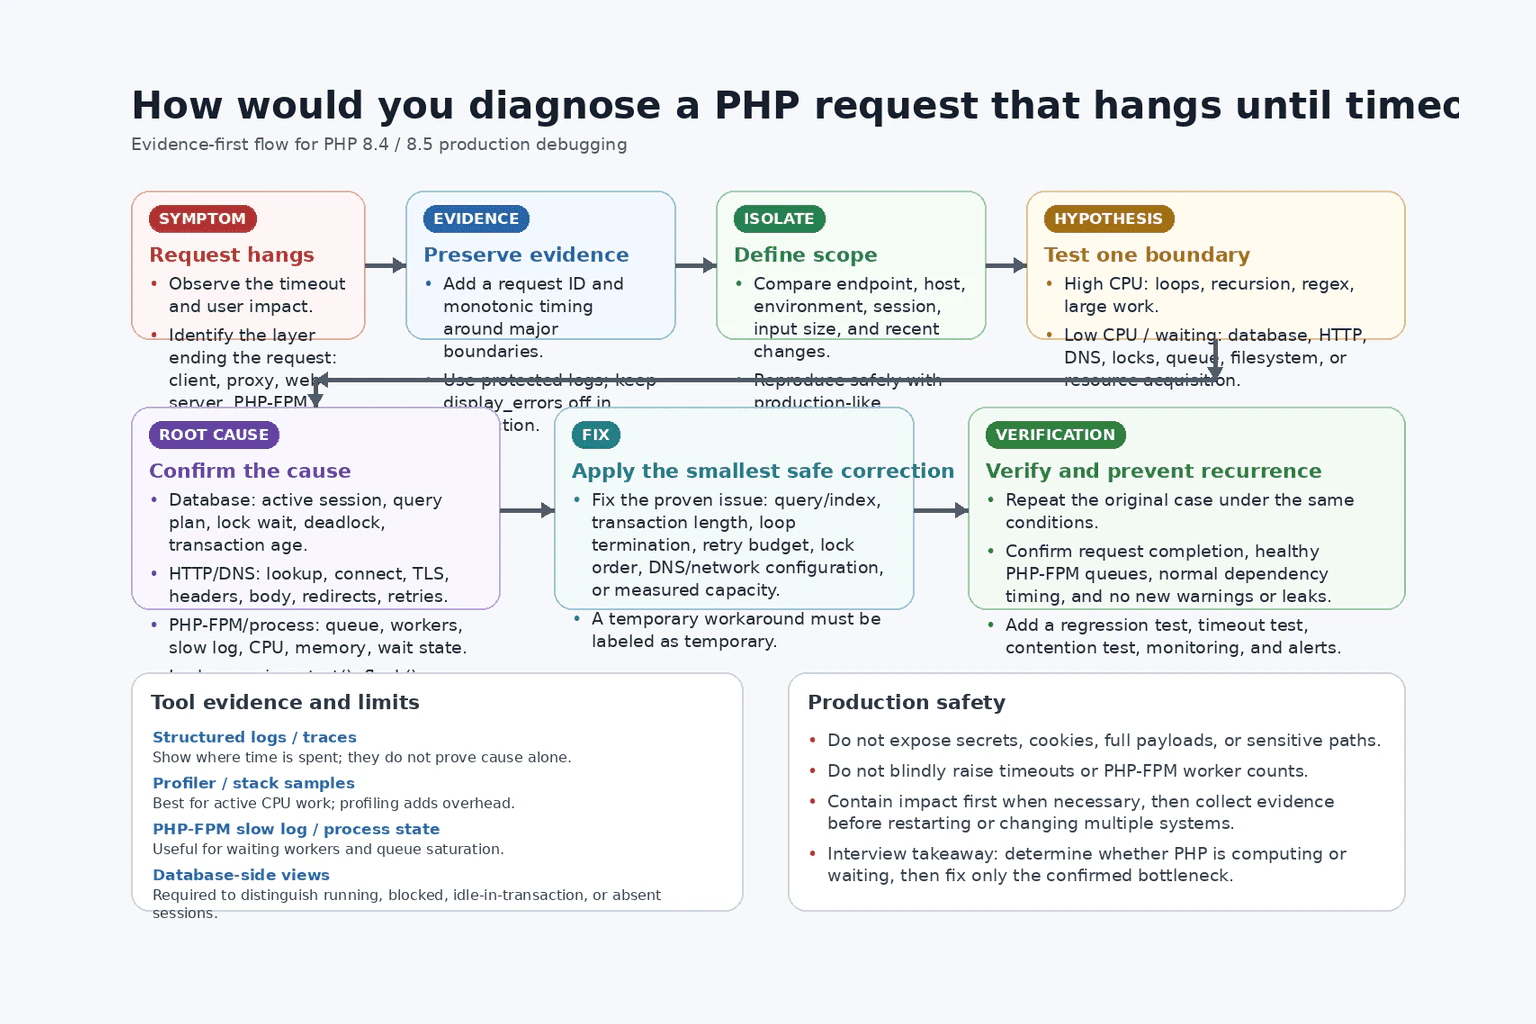
71. How would you investigate database connection exhaustion in PHP-FPM?Sql / DatabaseHard

Question Details

Explain how PHP-FPM worker counts, persistent connections, connection pools or proxies, long transactions, leaked work, timeouts, and database limits interact, and define a measurement-led remediation plan.

Short Interview Answer (30-60 seconds)

I would correlate PHP-FPM workers and queues with database session states, transaction age, query latency, locks, connection churn, and configured limits. Then I would fix slow or long-held work, persistent-connection misuse, retries, and capacity mismatches before changing limits or introducing a connection proxy.

Detailed Explanation

This question asks how I would find why a PHP service has used all the available paths to its data store. When that happens, new requests may wait, fail, or become very slow. I need to compare how many PHP tasks can run at once with how many data-store sessions are allowed. I must also find tasks that keep a session too long, fail to finish work, or repeatedly open new sessions. The goal is to use measurements to locate the real cause, make a safe correction, and prevent the same failure from returning.

Useful clarifying questions:

Useful Questions to Ask the Interviewer
  • Which database engine and version are in use?
  • Is PHP-FPM running on one host or across multiple replicas?
  • Which PHP-FPM process-management mode is configured, and what are the worker limits?
  • Are PDO persistent connections enabled?
  • Is there a database proxy or pooler between PHP and the database?
  • Which exact errors occur: too many connections, connection timeout, refused connection, or PHP-FPM queue growth?
  • Which background workers, scheduled jobs, administration tools, or other services share the database?
How would you investigate database connection exhaustion in PHP-FPM? diagram
How to Explain It in an Interview

I would start with a practical rule: I would not immediately raise the database connection limit. First, I would determine which clients own the connections, what those connections are doing, and why they remain occupied.

1. Confirm that the failure is connection exhaustion

I would collect the exact application exception, SQLSTATE or driver error, proxy error, and database log entry. A request can fail to obtain a connection because the database limit is reached, a proxy pool is full, the connection-acquisition timeout expires, networking is unhealthy, authentication fails, or the database is unavailable. These cases need different remedies.

I would place all PHP-FPM, application, proxy, and database events on the same timeline. This prevents me from treating a slow-query incident or network failure as a connection-limit problem.

2. Establish the real connection budget

PHP-FPM serves requests through worker processes. One worker handles one request at a time. A request may use no database connection, one connection, or more than one connection if the application talks to multiple databases or creates duplicate handles.

I would inventory:

  • Every PHP-FPM pool and application replica.
  • The configured and observed worker counts.
  • Queue consumers and long-running CLI processes.
  • Scheduled jobs, migrations, reporting tools, monitoring, and administration clients.
  • Read and write database endpoints if they are separate.
  • Connection-proxy client limits and backend-pool limits.
  • The database connection limit and any connections reserved for administrators or system processes.

A useful planning model is:

safe application budget = database connection limit - reserved operational capacity - other clients - safety margin

The PHP application must be designed against the safe application budget, not the database's full advertised maximum. I would also reserve enough access for diagnosis and recovery during an incident.

3. Measure PHP-FPM and database behavior together

On PHP-FPM, I would measure:

  • Active, idle, and total workers.
  • Whether the pool repeatedly reaches pm.max_children.
  • Listen-queue length and rejected or delayed requests.
  • Request throughput, duration, and error rate.
  • Slow-request traces.
  • Worker restarts and worker memory usage.
  • The number of application replicas over time.

On the database or proxy, I would measure:

  • Current and peak client connections.
  • Current and peak backend database sessions.
  • Connection acquisition time and acquisition failures.
  • New connections and disconnections per second.
  • Sessions grouped by application name, user, host, database, and state.
  • Active query age and transaction age.
  • Idle sessions and sessions idle while a transaction remains open.
  • Lock waits, blocking sessions, slow queries, CPU, memory, and storage latency.

The categories matter. A high number of active sessions may represent real concurrency, blocked work, or slow SQL. A high number of ordinary idle sessions may be expected when persistent connections or a proxy pool are used. An idle session with an open transaction is more serious because it can retain locks, snapshots, old row versions, or other transactional resources depending on the database.

4. Understand the PHP-FPM and PDO connection lifecycle

PHP-FPM workers normally survive across many requests. A non-persistent PDO connection is associated with its PDO object and is normally closed when PHP destroys the object or completes request cleanup, provided no remaining reference keeps it alive.

A PDO persistent connection can survive request completion and be reused by a later request in the same PHP-FPM worker process. It is not one shared PHP-level pool used by every worker. Therefore, many workers across many replicas can retain many separate persistent database sessions.

Persistent connections may reduce repeated connection setup cost, especially when connection establishment is expensive. However, they can also:

  • Keep a large number of idle sessions open.
  • Make retained session count scale with the number of worker processes.
  • Preserve connection-level state unless the driver and application reset it correctly.
  • Interact badly with session variables, temporary objects, advisory locks, or unfinished transactions.
  • Provide little benefit when a database proxy already manages backend connections efficiently.

I would inspect the actual PDO options, framework configuration, and driver behavior rather than assume persistence is enabled or safe.

5. Find work that occupies a connection for too long

Connection exhaustion does not require a permanent leak. If each request holds a connection for longer, the same traffic creates more simultaneous connection demand.

I would trace requests that:

  • Connect much earlier than the first database operation.
  • Keep a connection while calling an external API.
  • Perform file, network, sleep, or heavy computation inside a transaction.
  • Stream or iterate through a large result while doing unrelated work.
  • Wait on a database lock.
  • Execute slow or badly planned queries.
  • Produce an N+1 query pattern.
  • Retry immediately and repeatedly after transient failures.
  • Open multiple handles to the same database within one request.
  • Wait for user interaction or another service while a transaction remains open.

The safest transaction scope is usually narrow: acquire the connection when needed, start the transaction immediately before the related database work, execute only the required statements, commit promptly, and roll back on every failure path.

6. Separate connection retention from ordinary long-running work

In request-based PHP-FPM code, request cleanup normally releases non-persistent PDO objects. Therefore, a rising connection count is often caused by long requests, long transactions, blocked queries, persistent connections, additional replicas, or high connection churn rather than a classic permanent memory leak.

I would still inspect for incorrect lifecycle management, including:

  • Static or global registries that create and retain multiple connection objects.
  • Dependency-injection configuration that constructs duplicate connection services.
  • Reconnection logic that creates a replacement without releasing the prior handle.
  • Exception paths that leave a transaction open until request shutdown.
  • Long-running CLI consumers that never close, refresh, or validate stale connections.
  • ORM or framework workers that retain database state between jobs.
  • Separate read and write connections created even when only one is needed.

Setting pm.max_requests can recycle PHP-FPM workers and limit the lifetime of per-process state or gradual memory growth. It is a containment measure, not proof that the connection-lifecycle defect has been fixed.

7. Inspect transactions, locks, queries, and indexes

A slow query increases the time a request occupies its connection. A blocked query can hold both a worker and a connection while making no progress. A long transaction may also hold locks or prevent cleanup of old row versions.

I would identify:

  • The oldest active transactions.
  • Sessions idle inside a transaction.
  • Blocking and blocked sessions.
  • Queries with increased execution time or rows examined.
  • Query-plan changes after a deployment or data-growth event.
  • Missing, unused, or inappropriate indexes.
  • Large scans, sorts, temporary results, and lock-heavy updates.
  • Application changes that widened transaction boundaries.

I would use the database's native activity, lock, slow-query, and query-plan tools. Exact commands depend on the database engine, so I would not present MySQL, PostgreSQL, or another engine's session-state behavior as universal.

Improving a query or shortening a transaction can reduce occupied-connection time and therefore reduce required concurrency without increasing connection capacity.

8. Review retries and timeout behavior

Retries can turn a partial slowdown into connection exhaustion. If failed requests retry immediately, each layer may create more demand while the database is already unhealthy.

I would verify that retries are:

  • Limited to genuinely transient and safe-to-retry failures.
  • Bounded by a small maximum attempt count.
  • Delayed with backoff and jitter.
  • Constrained by an overall request deadline.
  • Safe for the transaction and operation's idempotency rules.

I would review timeouts at every layer:

  • Database connection or proxy-acquisition timeout.
  • Statement or query timeout where supported.
  • Lock-wait timeout.
  • Idle-transaction timeout where supported.
  • PHP execution and application request deadlines.
  • PHP-FPM request termination settings.
  • Web-server, load-balancer, and reverse-proxy timeouts.
  • Database-proxy client, queue, idle, and backend timeouts.

The timeouts must be coordinated. A client-facing request should not time out while PHP continues holding a database connection for substantially longer. However, timeouts that are too aggressive can cancel valid work and cause retry storms, so I would choose them from observed latency and service objectives.

9. Align PHP-FPM concurrency with database capacity

pm.max_children limits simultaneous PHP-FPM requests in a pool. Memory capacity is a major input because each worker is a separate process with its own memory footprint. Database capacity is another input because active workers may create database demand.

I would not assume one worker always equals one database connection. Instead, I would measure:

  • The percentage of requests that use the database.
  • Connections used per database-using request.
  • Average and high-percentile connection hold time.
  • Peak active workers and peak database sessions.
  • The effect of background jobs and autoscaling.

I would set or cap total concurrency across all replicas so expected demand remains below the safe connection budget. Configuring each replica safely in isolation is insufficient if autoscaling can multiply the total worker count beyond database capacity.

Lowering worker concurrency can protect the database, but it may increase the PHP-FPM request queue and user latency. The correct value balances worker memory, request throughput, database throughput, and acceptable queueing.

10. Decide whether persistent connections should remain enabled

I would keep PDO persistent connections only when measurements show that connection-establishment overhead is material and the retained-session count and connection-state behavior are controlled.

I would disable or avoid them when:

  • Worker count makes the retained connection total unsafe.
  • Session state cannot be reliably reset.
  • A proxy already provides effective pooling.
  • Connection setup is not an important part of latency.
  • Persistent idle sessions consume scarce database capacity.

Disabling persistence may increase connection creation rate, authentication work, TLS setup, or network overhead. I would therefore compare connection latency, database load, and total session count before and after the change rather than assuming either mode is universally better.

11. Evaluate a database connection proxy or pooler

A connection proxy can accept many application-side connections while maintaining a controlled backend pool, depending on the database, proxy, and pooling mode. It can be useful when many PHP-FPM workers or replicas create excessive connection churn or when the database handles a smaller number of backend sessions more efficiently.

I would verify:

  • Client connection limits and backend pool limits.
  • Queue size and connection-acquisition timeout.
  • Transaction pooling versus session pooling.
  • Transaction pinning and backend-session reuse rules.
  • Compatibility with session variables, temporary tables, advisory locks, prepared statements, and other connection-local state.
  • Failure handling, observability, and high availability.

A proxy does not repair slow SQL, wide transactions, lock contention, or retry storms. An unlimited proxy queue can merely replace fast connection errors with extreme latency and memory pressure. Its limits must therefore be explicit and observable.

12. Apply remediation in a safe order

My remediation plan would be:

  1. Confirm the failure type and preserve evidence from all layers.
  2. Stop or limit runaway traffic, retry storms, or unhealthy consumers if the database is at immediate risk.
  3. Preserve reserved administrative access for diagnosis and recovery.
  4. Identify and handle clearly abandoned, blocked, or harmful sessions using an approved operational procedure.
  5. Fix slow queries, missing or ineffective indexes, lock chains, and unnecessarily wide transactions.
  6. Move network calls, file work, and unrelated computation outside transactions.
  7. Ensure every transaction commits or rolls back on all code paths.
  8. Remove duplicate connections and correct persistent-connection misuse.
  9. Add bounded acquisition, query, lock, transaction, request, and retry deadlines.
  10. Right-size PHP-FPM and background-worker concurrency across all replicas.
  11. Introduce or tune a proxy when measured connection churn or backend-session pressure justifies it.
  12. Increase the database connection limit only after confirming the database has enough per-connection memory, process or thread capacity, CPU, storage throughput, and lock-management capacity.

Increasing the limit alone can worsen performance. More simultaneous queries may increase context switching, memory use, cache pressure, lock contention, and storage contention even though connection-refusal errors temporarily disappear.

13. Validate the corrected system

I would test with representative traffic, including normal peaks, background jobs, autoscaling, slow dependencies, and partial database degradation.

I would verify:

  • Peak client connections and backend sessions stay below their budgets.
  • Connection acquisition latency remains stable.
  • PHP-FPM queue length and worker saturation remain acceptable.
  • Query latency, lock waits, and database resource use do not regress.
  • Long transactions and idle-in-transaction sessions are absent or within an approved threshold.
  • Retry volume remains bounded during failures.
  • Administrative headroom is preserved.
  • Scaling an application replica does not unexpectedly exceed the shared budget.

I would add alerts for connection-budget utilization, acquisition failures, acquisition latency, oldest transaction age, idle-in-transaction sessions, connection churn, PHP-FPM queue growth, active-worker saturation, and abnormal retry rates. This turns the fix into a measurable capacity policy rather than a one-time configuration change.

Technical Approach
  1. Capture the exact driver, proxy, and database errors for the incident window.
  2. Inventory every PHP-FPM pool, replica, background process, scheduled job, proxy, and other database client.
  3. Calculate a safe application connection budget with operational headroom.
  4. Correlate PHP-FPM workers, queues, request duration, and retries with database client connections, backend sessions, query age, transaction age, and locks.
  5. Group sessions by client identity, user, host, database, state, query age, and transaction age.
  6. Classify the cause as excessive concurrency, persistent idle sessions, connection churn, slow SQL, blocked work, long transactions, retries, or duplicate connection creation.
  7. Trace the responsible requests and inspect their connection and transaction boundaries.
  8. Fix slow, blocked, duplicate, or long-held work before increasing limits.
  9. Add reliable rollback, cleanup, bounded retries, and coordinated timeouts.
  10. Right-size total PHP-FPM and background-worker concurrency across all replicas.
  11. Evaluate a proxy only when measured pooling or connection-churn needs justify it.
  12. Validate under representative and degraded load, then alert on budget utilization, acquisition time, transaction age, queues, and retry volume.
Practical Insights

This is mainly an operational capacity problem rather than an algorithm with Big O complexity. Collecting connection counts and worker metrics is usually inexpensive, but detailed tracing, slow-query logging, and high-cardinality labels can consume CPU, storage, memory, and network capacity. Each PHP-FPM worker uses process memory even while waiting, and each database connection may use database-side memory and process or thread resources. Lowering worker counts can protect the database but increase queueing. Raising connection limits can increase memory use, context switching, lock contention, and storage pressure. Persistent connections reduce setup work but may reserve idle sessions. A proxy can reduce backend connections but adds queueing, memory use, operational complexity, and another failure point.

Why Interviewers Ask This

Interviewers ask this question to test whether the candidate understands how PHP-FPM process concurrency interacts with finite database capacity. A strong answer distinguishes connection exhaustion from database CPU or query saturation and separates active queries, idle sessions, idle sessions with open transactions, persistent PDO connections, connection churn, slow requests, blocked work, and genuine connection-retention defects. It also demonstrates production judgment by measuring before changing limits, preserving administrative access, controlling retries and timeouts, considering all application replicas and background clients, and validating that a proposed fix improves both reliability and latency.

Common interview mistakes

Common mistakes include raising the database connection limit before proving the cause; treating every connection failure as a max-connections error; calculating capacity from only one PHP-FPM host; ignoring queue consumers, jobs, and other services; assuming every worker uses exactly one connection; assuming PDO persistent connections form one shared pool; calling every idle session a leak; ignoring sessions idle inside a transaction; performing network or file work inside transactions; failing to roll back after exceptions; retrying immediately without limits or jitter; using pm.max_requests as the permanent fix; setting contradictory timeouts across layers; adding a proxy without checking session-state compatibility; allowing an unlimited proxy queue; and declaring success after connection errors disappear while latency, memory use, lock contention, or database saturation becomes worse.

Interview tip

Present the answer as a measurement-led sequence: confirm the failure, establish the shared connection budget, correlate PHP-FPM and database metrics, classify session states, inspect transaction and connection lifecycles, correct the cause, and validate under load. Emphasize that increasing limits or adding a proxy is a capacity decision made after measurement, not the default first response.

Interviewer may ask next
How do PDO persistent connections behave under PHP-FPM?

A persistent PDO connection can remain available inside the PHP-FPM worker process after a request ends and may be reused by a later request handled by that same worker. It is not one shared PHP connection pool across all workers. Therefore, many workers and replicas can retain many separate database sessions. Persistence may reduce connection setup cost, but the application must account for retained capacity, unfinished transactions, and connection-local state.

Would you lower PHP-FPM worker counts or add a database connection proxy?

I would choose from measurements. I would lower or cap worker concurrency when the application can submit more simultaneous database work than the database can safely process. I would consider a proxy when many processes create excessive connection churn or backend sessions. A proxy does not fix slow queries, locks, long transactions, or retries, so those causes must still be corrected. Its backend pool, queue, acquisition timeout, pooling mode, and session-state compatibility must also be explicitly configured.

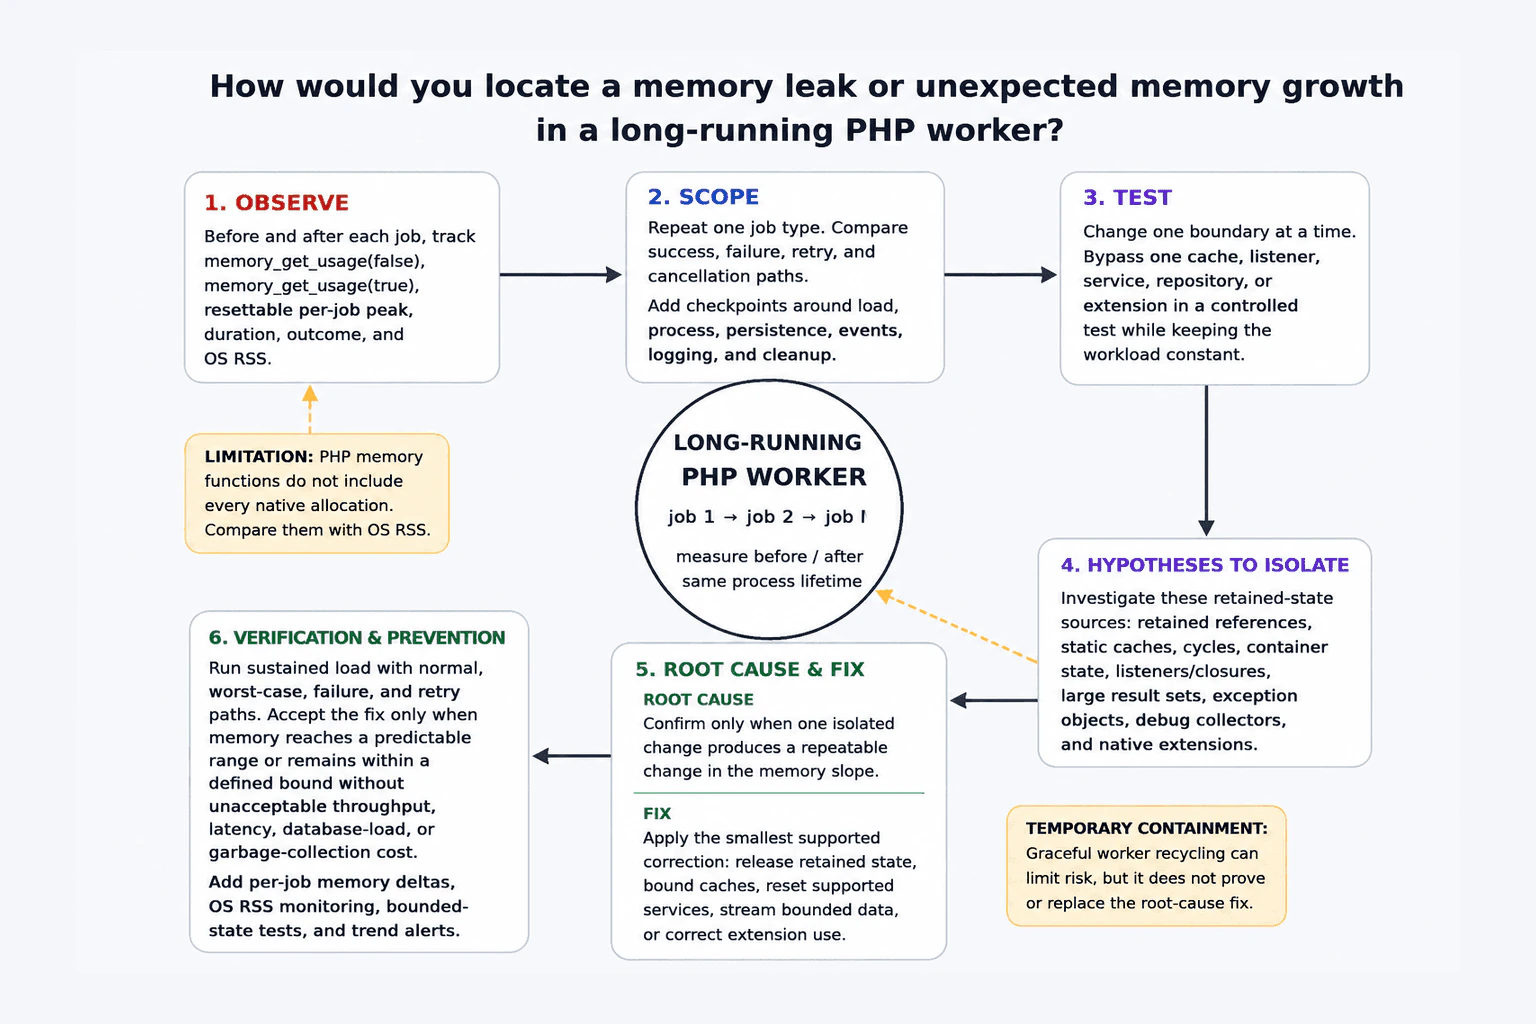
72. What is a stack trace in PHP?NEWDebuggingEasy

Question Details

Define a stack trace as the sequence of active function and method calls recorded when PHP creates a Throwable or when code requests a backtrace. Explain frames, files, line numbers, classes, functions, arguments, exception chaining, and a simple method for locating the first relevant application frame without assuming the top frame is always the root cause.

Short Interview Answer (30-60 seconds)

A PHP stack trace shows the sequence of function and method calls that led to a particular execution point. I inspect its frames, files, line numbers, classes, and functions to understand the call path and find the first relevant application frame without assuming the top frame is the root cause.

Detailed Explanation

A stack trace is like a history of the steps a program followed before reaching a certain point. It helps a developer see which parts of the program called other parts and in what order. When a problem occurs, the developer first tries to make the same problem happen again, checks how widely it happens, collects useful evidence, and follows this history back through the program. The goal is to find the part of the application's own code most closely connected to the problem. The first item shown can be useful, but it does not always reveal the real cause.

Useful Questions to Ask the Interviewer
  1. Do you want me to explain both traces stored on a Throwable and backtraces requested directly by PHP code?
  2. Should I also explain how chained exceptions can help identify an earlier failure?
What is a stack trace in PHP? diagram
How to Explain It in an Interview

A stack trace in PHP is an ordered record of function and method calls associated with a particular point in program execution. When an object implementing Throwable, such as an Exception or Error, is created, PHP records trace information that can be inspected with methods such as getTrace() or getTraceAsString(). Code can also request the current call stack directly with debug_backtrace().

Each entry in the trace is called a frame. A frame represents one level of the call stack. Depending on how the trace was produced and which call is represented, a frame may include fields such as file, line, function, class, type, object, and args. The type value can show how a method was called, such as -> for an instance method or :: for a static method.

For debugging, I begin by reproducing the problem when possible and confirming its scope. I determine whether it affects one request, one input, one environment, or a wider part of the system. Then I collect the relevant Throwable, application logs, and trace. I keep production traces private because paths, arguments, and surrounding diagnostic data can reveal sensitive information.

Next, I inspect the call path and look for the first frame that is relevant to my application code. A trace may also contain framework, Composer package, or PHP runtime calls. Those frames explain how execution moved through the system, but their presence does not prove that the framework or package caused the defect.

I inspect the relevant application's file, line, class, function, inputs, and nearby caller frames. I then compare that evidence with the exception message, logs, configuration, database results, or environment differences when those sources are relevant to the failure.

I do not assume that the first displayed frame is always the root cause. A frame may show where a Throwable was created or where one call led into another, while the real defect could be an earlier decision, invalid input, incorrect state, or data supplied by a caller. The trace describes the execution path; it does not automatically identify the defective statement.

Exception chaining is also important. A Throwable can reference a previous Throwable through getPrevious(). For example, application code may catch a lower-level exception and throw a new exception with additional context while preserving the original as the previous exception. I inspect the complete chain because an outer exception may explain the high-level operation while an earlier Throwable contains the original failure details.

Arguments can be useful because they may show what values were passed to a function, but they also create a security and privacy risk. Passwords, tokens, personal data, and other secrets must not be exposed to users or written carelessly to production logs. PHP also allows backtraces to omit argument values, such as by using the DEBUG_BACKTRACE_IGNORE_ARGS option with debug_backtrace().

A stack trace is only one source of evidence. Warnings, application logs, profiler data, database evidence, and environment differences answer different debugging questions. I use the smallest useful diagnostic step needed to test my current hypothesis rather than collecting unrelated information.

After identifying the cause, I fix the root problem instead of merely suppressing the error or hiding the symptom. A temporary workaround may reduce impact, but it is separate from the root-cause fix. Finally, I reproduce the original case again, verify that the fix works, check important related behavior, and add an automated regression test when practical.

Key Insight / Why This Solution Works
  1. Reproduce the failure when possible.
  2. Confirm its scope, such as one request, one input, one environment, or many users.
  3. Capture the relevant Throwable, logs, and stack trace without exposing sensitive information.
  4. Read the trace frames and identify their files, lines, classes, and functions.
  5. Locate the first frame relevant to the application instead of assuming the first displayed frame is the cause.
  6. Inspect nearby caller frames to understand how execution reached that code.
  7. Follow getPrevious() when the Throwable is part of an exception chain.
  8. Compare the trace with other relevant evidence such as inputs, configuration, logs, database results, or environment differences.
  9. Test the suspected cause with the smallest useful diagnostic step.
  10. Fix the root cause rather than suppressing the symptom.
  11. Reproduce the original case and verify the fix.
  12. Add regression coverage when practical.
Why Interviewers Ask This

Interviewers want to know whether the candidate understands what a PHP stack trace represents and can use it correctly during root-cause analysis. A strong answer explains trace frames, files, line numbers, classes, functions, arguments, Throwable chaining, and how to identify relevant application code without assuming that the first displayed frame proves the root cause.

Common interview mistakes

Common mistakes include assuming the first displayed frame is automatically the root cause, reading only the exception message and ignoring the call path, blaming framework or vendor code merely because it appears in the trace, ignoring a previous chained Throwable, confusing a stack trace with logs or profiler output, exposing raw traces to end users, logging sensitive argument values, suppressing errors instead of finding their cause, treating a workaround as the permanent fix, and changing code without reproducing and verifying the original failure.

Interview tip

Start with a one-sentence definition. Then explain what a frame contains and how you use the trace in practice. Emphasize reproduction, evidence, the first relevant application frame, Throwable chaining, safe handling of arguments, root-cause verification, and regression prevention. Do not claim that the first displayed frame automatically identifies the defect.

Interviewer may ask next
What information can a PHP stack trace frame contain?

Depending on the trace and the call represented, a frame may contain the file and line associated with the call, the function name, class name, call type such as -> or ::, an object, and function arguments. Not every frame contains every field. Arguments can help debugging, but they must be handled carefully because they may contain sensitive information.

Why should you not assume the first displayed stack-trace frame is the root cause?

A stack trace records the call path, not a guaranteed root-cause diagnosis. The first displayed frame may identify where the Throwable was created or a nearby call, while the bad input, incorrect state, or faulty decision originated elsewhere. I inspect the first relevant application frame, nearby callers, supporting logs or data, and any previous chained Throwable before deciding on the root cause.

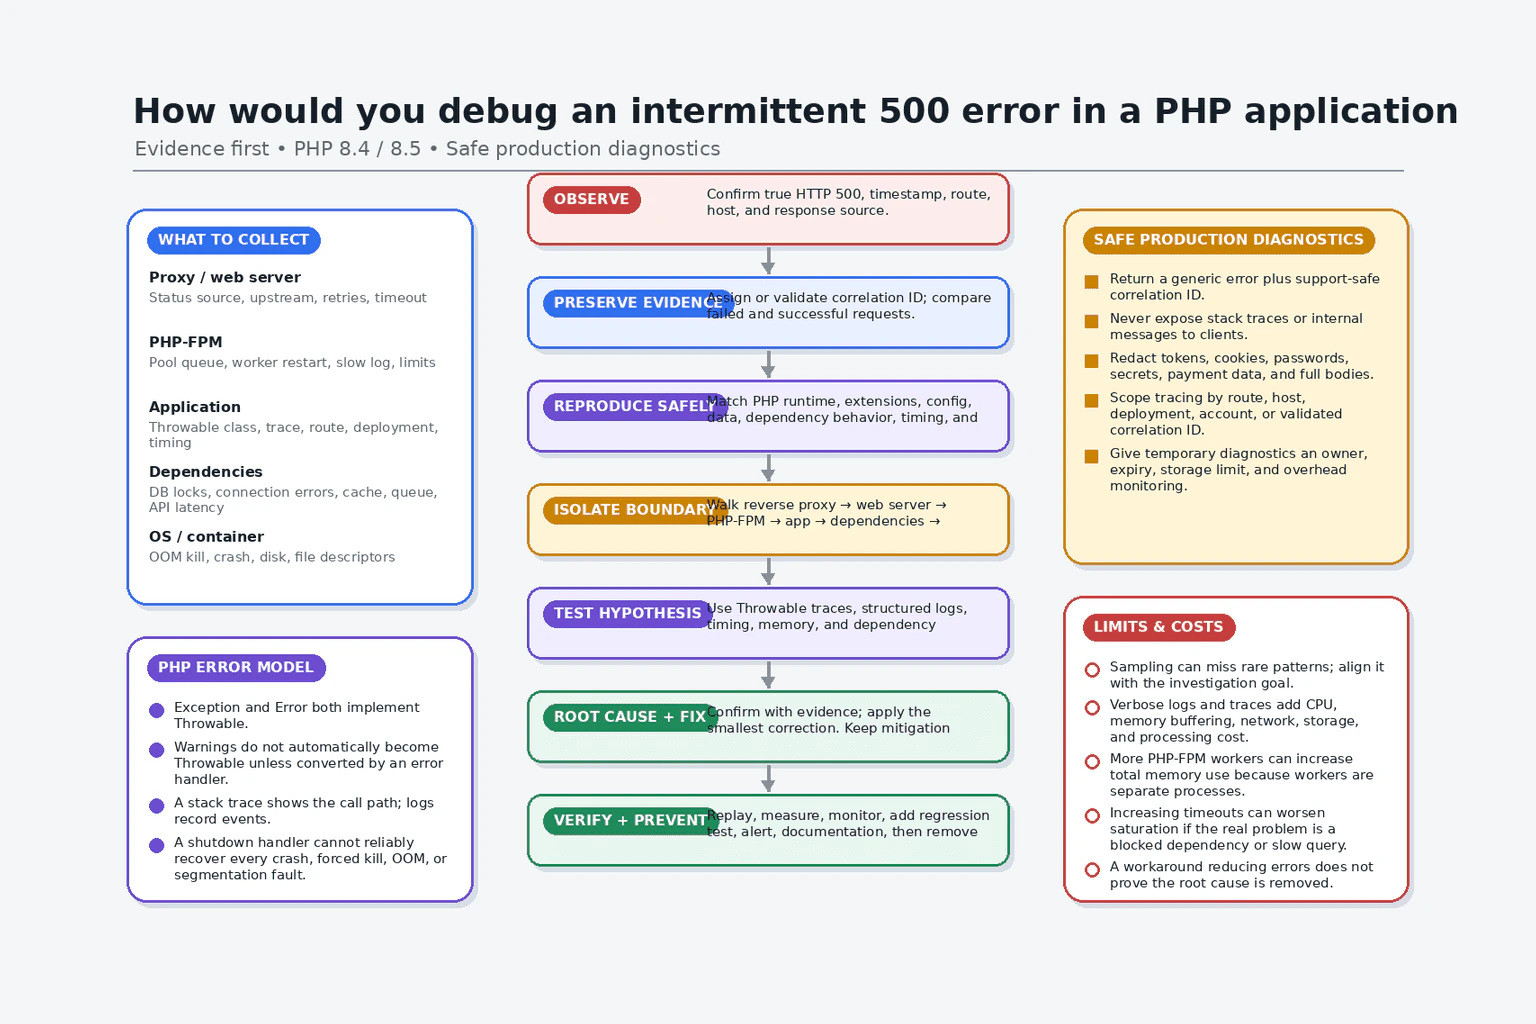
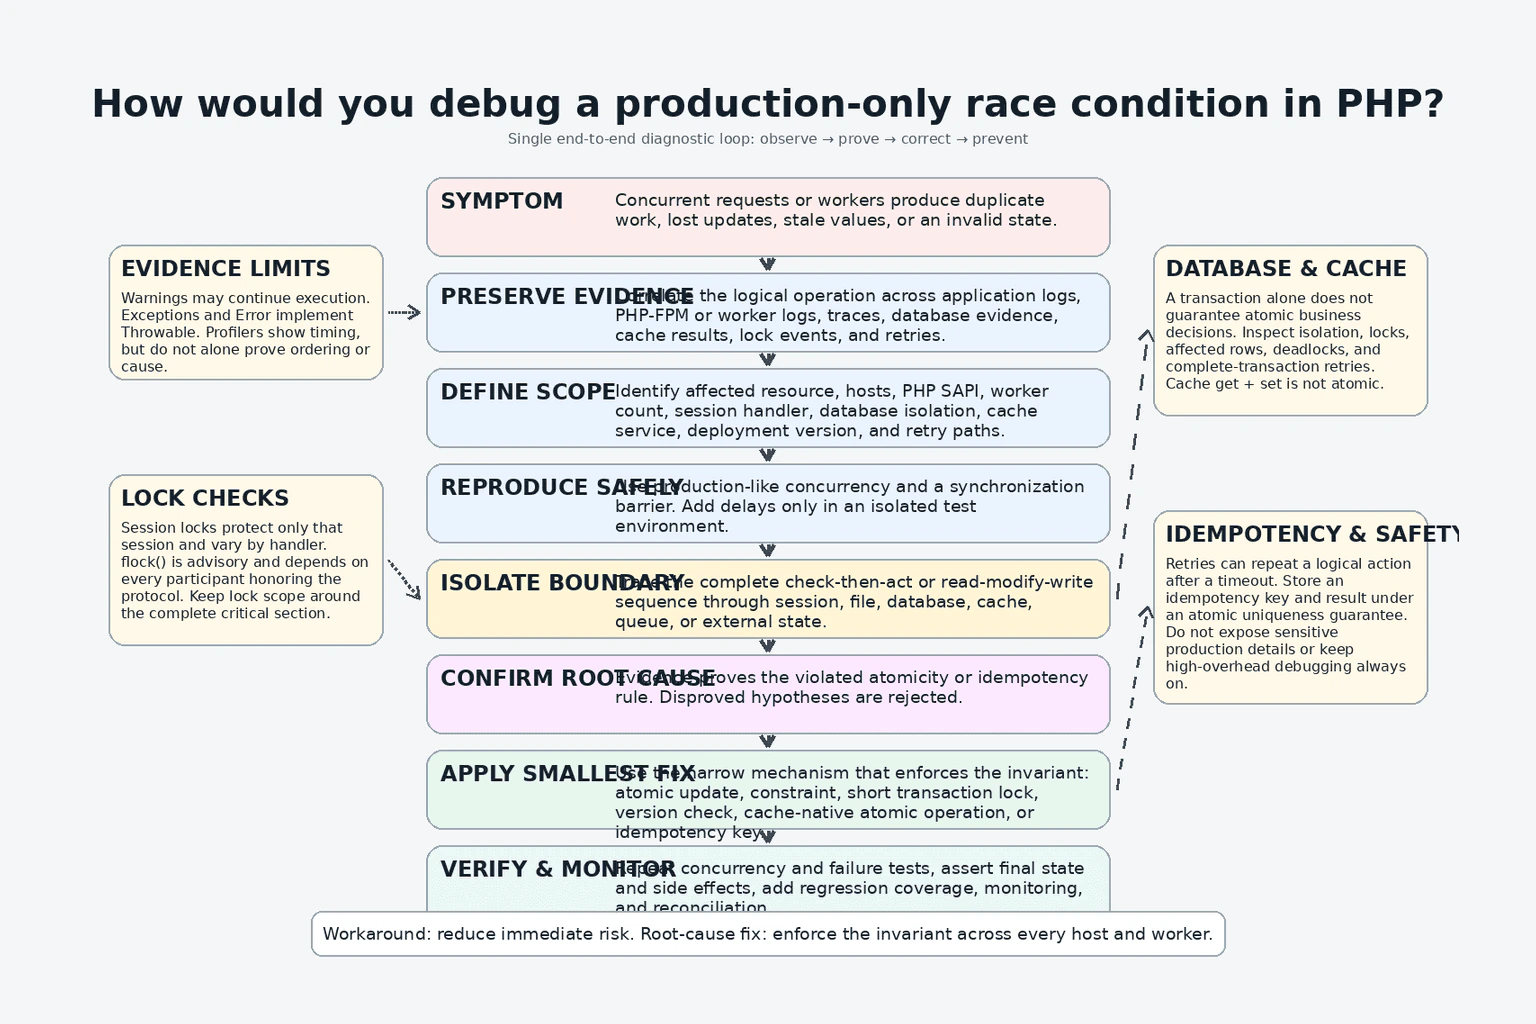
73. How would you debug a production-only race condition in PHP?DebuggingHard

Question Details

Describe collecting evidence across concurrent requests, reproducing timing, identifying shared state, session or file locks, database isolation, cache atomicity, and validating a synchronization or idempotency fix.

Short Interview Answer (30-60 seconds)

I would define the failed invariant, add privacy-safe correlated logs, and reproduce the timing with concurrent requests. I would inspect shared state, locks, transactions, cache operations, and retries, then enforce correctness with atomic updates, synchronization, uniqueness, or idempotency and verify the fix under repeated concurrency.

Detailed Explanation

This question asks how I would find a rare failure that happens only when two or more users or background tasks act at almost the same moment. Each action may work correctly by itself, but together they may create duplicate work, lose an update, or leave information in the wrong state. I must show how I would collect safe evidence, recreate the timing, identify the shared item being changed, correct the underlying coordination problem, and prove through repeated tests that the failure and its important variations can no longer occur.

Useful clarifying questions:

Useful Questions to Ask the Interviewer
  • What incorrect outcome occurs: duplicate work, a lost update, a stale value, or an invalid state?
  • Does the failure involve HTTP requests, queue workers, scheduled jobs, or several of them?
  • Which shared resources may be involved: sessions, files, database records, cache keys, queues, or external services?
  • Does production run on one host or multiple hosts, and which PHP SAPI and session handler are used?
  • Can clients, proxies, workers, or external services retry the operation?
How would you debug a production-only race condition in PHP? diagram
How to Explain It in an Interview

I would start by defining the failure precisely. A race condition is a correctness problem in which the result depends on the timing or order of concurrent operations. I would identify the invariant, meaning the business rule that must always remain true. Examples include one logical request creating at most one record, inventory never becoming invalid, and one state transition not being applied twice. I would separate the visible symptom from the invariant that was actually violated.

My smallest useful diagnostic step would be structured logging immediately before and after the suspected shared-state boundary. I would assign a correlation identifier to each logical operation and propagate it through related HTTP requests, jobs, and service calls. I would record safe resource identifiers, attempt number, start and finish times, host, process identifier, worker identifier, deployment version, transaction boundaries, lock attempts, affected-row counts, cache-operation results, retries, and intended state transitions. I would not log passwords, tokens, session contents, personal data, payment data, or complete request bodies.

I would collect evidence across all concurrent participants and order it on one timeline. Separate PHP requests normally have separate request-local variables, but they can still race through persistent or external state such as database records, cache keys, session storage, files, queues, and remote APIs. I would therefore trace the complete operation across every process rather than inspect one request in isolation.

I would classify the evidence correctly. An exception is an object thrown during execution and can be handled through Throwable. PHP Error objects also implement Throwable and represent failures such as type or argument errors. Warnings generally do not become exceptions automatically and may allow execution to continue, so I would capture them through configured error reporting and centralized logs rather than suppress them. Application logs explain business events and state transitions. Distributed traces connect work across requests and services. Profiler data shows timing and resource use but does not by itself prove the order that caused the incorrect state. Database evidence may include executed statements, transaction boundaries, lock waits, deadlocks, isolation settings, affected-row counts, and committed data.

I would not expose debugging details to end users or enable unrestricted production error display. Production diagnostics must be sent to protected logs or observability systems with access controls, retention limits, and redaction. I would use targeted instrumentation, sampling, and temporary diagnostic fields when normal logs are insufficient.

Next, I would compare production with the environment where the problem does not occur. Relevant differences include the PHP 8.4 or PHP 8.5 patch version, SAPI, PHP-FPM worker count, queue-worker count, process model, session handler, filesystem, database engine and isolation level, cache service, load balancer, retry policy, read replicas, deployment topology, extensions, Composer package versions, framework middleware, opcache configuration, and application settings. A development environment with one worker may accidentally serialize execution and hide a production race.

I would reproduce the timing in an isolated production-like environment. I would send multiple requests or jobs against the same logical resource. A synchronization barrier would pause workers immediately before the suspected critical operation and release them together. Controlled delays may be added only in the test environment to widen a timing window. Each test would assert the invariant and save the event timeline when it fails. I would vary worker counts, request order, delays, retries, and failure points. Random load can help discover a race, but a deterministic barrier-based test is better for proving the exact ordering and preventing regression.

I would then map every shared-state operation. I would look for unsafe read-modify-write sequences such as reading a value, making a decision in PHP, and writing a replacement value later. Two requests can read the same original value and both make decisions that were valid only before the other request committed. The correct fix normally moves the rule into an atomic operation or protects the complete decision-and-write critical section, not only the final write.

For session state, I would identify the configured session handler and measure how long each request keeps the session open. PHP sessions are normally locked to prevent concurrent writes, so requests using the same session can be serialized while the session is active. Calling session_write_close(), or session_commit(), stores the session data and releases the session lock after session updates are complete. Read-only access can use the read_and_close option where appropriate. However, custom handlers can have different locking guarantees, and a session lock protects only that session state; it does not automatically protect database rows, cache keys, files, or requests using different sessions.

For file access, I would verify that all cooperating readers and writers follow the same locking protocol. flock() provides advisory locking, which means every participating process must honor the lock for the protocol to work. I would acquire the appropriate lock before the complete critical section, check the return value, avoid indefinite waits, release it reliably, and test the actual filesystem used in production. I would not assume a host-local file lock coordinates applications running on multiple hosts or that every network filesystem has identical locking behavior.

For database state, I would inspect transaction boundaries, autocommit behavior, isolation level, query order, lock waits, deadlocks, affected-row counts, and retry handling. Starting a transaction does not automatically make an unsafe business decision atomic. Depending on the invariant and the database's documented behavior, suitable fixes may include one conditional UPDATE, an atomic increment, a uniqueness constraint, an upsert, a row lock such as SELECT ... FOR UPDATE followed by the update in the same short transaction, optimistic concurrency using a version value, or serializable isolation with complete-transaction retries. Row-locking and isolation behavior differs between database products, so I would confirm the selected engine's documentation rather than assume identical semantics. In systems such as PostgreSQL, SELECT FOR UPDATE locks selected rows against conflicting updates, while stronger isolation levels can require retrying the complete transaction after serialization failures.

I would keep database transactions short, access shared records in a consistent order, avoid network calls while holding database locks, and handle expected concurrency conflicts explicitly. If a deadlock or serialization failure is retriable, I would roll back and retry the complete transaction from the beginning with a bounded retry count and backoff. Retrying only the last statement can reuse decisions made from stale state.

For cache state, I would verify the exact command semantics supplied by the configured cache service and client. A separate get followed by set is not one atomic operation. Where appropriate, I would use a service-supported atomic increment, add-if-absent operation, compare-and-set mechanism, transaction, or server-side script. I would check expiration, eviction, replication, failover, and timeout behavior. I would also decide whether the cache is authoritative state or only a performance optimization. Correctness should not depend on a cache entry that may disappear unless the system is explicitly designed to handle that loss.

If a distributed lock is considered, I would require a precisely defined owner token, bounded acquisition time, lease duration, safe owner-only release, behavior after lease expiration, and protection against a stale owner continuing after losing the lock. A distributed lock adds failure modes and should not replace a simpler database constraint or atomic operation when those can enforce the invariant directly.

I would inspect retries and duplicate delivery separately from simultaneous execution. A client, reverse proxy, queue, webhook sender, or worker may repeat an operation after a timeout even when the first attempt succeeded. For an operation that must produce one logical effect, I would use an idempotency key that identifies all attempts belonging to the same logical action. I would store the key and result through an atomic insert or database uniqueness guarantee. A repeated request with the same key and equivalent input would return or resume the recorded result. Reusing the same key with conflicting input would be rejected.

A temporary workaround might reduce worker concurrency, serialize a route, disable an unsafe automatic retry, or place a narrow operational guard around the affected feature. I would label it as risk reduction, because it may reduce capacity and can leave the underlying correctness defect unresolved. Increasing a timeout, adding sleep(), or making the timing window less likely is not a root-cause fix.

The root-cause fix must enforce the invariant at the shared-state boundary. The correct mechanism may be an atomic conditional update, database constraint, short lock-protected transaction, optimistic version check, cache-native atomic command, idempotency record, or a carefully designed combination. I would choose the narrowest mechanism that remains correct across all application hosts and workers.

I would validate the corrected behavior with repeated concurrent tests, not one successful request. Tests would cover simultaneous operations, duplicate delivery, delayed execution, timeouts, partial failures, process termination, transaction rollback, deadlocks, serialization failures, lock acquisition failure, lease expiration, cache misses, cache eviction, and retries. I would verify the final authoritative state, number of side effects, affected-row counts, returned responses, emitted messages, and diagnostic timeline.

Finally, I would add a deterministic regression test and production monitoring for the invariant itself. Examples include duplicate-key conflicts, rejected version updates, idempotency replays, abnormal lock waits, unexpected state transitions, and reconciliation mismatches. The alert should represent a meaningful correctness risk, not merely the presence of concurrency.

Technical Approach
  1. Define the exact symptom and the invariant that must always remain true.
  2. Scope the affected operation, shared resource, deployment, hosts, workers, and time window.
  3. Add privacy-safe structured logs with correlation identifiers around the smallest suspected shared-state boundary.
  4. Combine evidence from all concurrent HTTP requests, workers, database operations, cache operations, files, sessions, and external calls into one timeline.
  5. Distinguish exceptions, Error objects, warnings, logs, traces, profiler data, and database evidence.
  6. Compare production and test environments, including PHP version, SAPI, worker counts, session handler, filesystem, database isolation, cache behavior, dependencies, and retry settings.
  7. Reproduce the issue with production-like concurrency, a synchronization barrier, controlled test-only delays, and invariant assertions.
  8. Map every shared resource and locate unsafe read-modify-write or check-then-act sequences.
  9. Verify session-lock lifetime, file-lock scope, database transaction and isolation behavior, cache atomicity, external side effects, and duplicate-delivery paths.
  10. Select the smallest mechanism that enforces the invariant: an atomic operation, constraint, transaction lock, version check, idempotency key, or carefully designed synchronization.
  11. Separate any capacity-reducing workaround from the root-cause correction.
  12. Test concurrent success, retries, duplicate delivery, delays, failures, rollback, deadlocks, lock loss, cache loss, and process termination.
  13. Add a deterministic regression test, invariant monitoring, safe diagnostics, and a recovery or reconciliation procedure.
Practical Insights

The investigation can increase log volume, trace storage, database observations, test traffic, CPU use, and network use, so diagnostics should be focused, redacted, sampled when safe, and removed or reduced after the incident. A concurrency test uses memory roughly in proportion to the number of active test workers and the evidence retained for each attempt. Locks can make requests wait and reduce throughput. Long transactions increase blocking, open-connection time, lock memory, and deadlock risk. Optimistic version checks avoid holding locks while application code runs, but conflicts require retries. Unique constraints are usually a direct and maintainable way to enforce uniqueness, although conflicts still need correct handling. Idempotency records require database space, retention rules, and cleanup. Cache coordination and distributed locks add network calls, timeout handling, and operational complexity. The preferred solution protects the smallest critical operation while keeping the authoritative rule correct across every host and worker.

Why Interviewers Ask This

Interviewers ask this question to test whether the candidate can investigate a timing-dependent production failure without guessing. It evaluates understanding of PHP request isolation, concurrent PHP-FPM or worker execution, shared state, session and file locks, database transactions and isolation, cache atomicity, retries, idempotency, safe production diagnostics, root-cause analysis, and verification under realistic failure conditions.

Common interview mistakes

Common mistakes include debugging only one request instead of reconstructing all concurrent participants; adding logs without correlation identifiers; exposing stack traces or sensitive production data; assuming request-local PHP variables are shared; assuming a transaction automatically prevents every race; locking only the final write while leaving the decision outside the lock; performing a separate cache get and set as though they were atomic; assuming session locking protects unrelated data; holding a PHP session open for the full request without need; using flock() without ensuring every process follows the protocol; assuming local file locks coordinate multiple hosts; adding a distributed lock without owner, lease, expiration, and stale-owner protections; holding database locks during remote API calls; retrying only part of a transaction; allowing unlimited retries; using sleep(), longer timeouts, or reduced concurrency as the permanent fix; ignoring duplicate delivery after timeouts; and declaring success after one test instead of repeated concurrency and failure testing.

Interview tip

Present the answer in this order: invariant, scope, evidence, production-like reproduction, shared-state analysis, root-cause fix, and verification. Mention PHP-specific concerns such as PHP-FPM or worker concurrency, session handlers, session_write_close(), flock(), Throwable, database isolation, cache command semantics, and retries. Clearly distinguish a temporary workaround from a fix that enforces correctness.

Interviewer may ask next
How would you choose between pessimistic locking, optimistic concurrency, and a unique constraint?

I would choose based on the invariant, conflict frequency, and retry cost. Pessimistic locking is useful when conflicts are likely and a decision requires protected access to current shared state, but the transaction must remain short. Optimistic concurrency uses a version or expected value in a conditional update and works well when conflicts are uncommon and the complete operation can be retried safely. A unique constraint is the strongest direct choice for a uniqueness rule, such as one idempotency record per logical request. These mechanisms can be combined, but I would avoid adding locks when an atomic statement or constraint alone proves the invariant.

What would you do if the race includes an external API that cannot participate in the database transaction?

I would not keep a database transaction or row lock open while waiting for the external network call. I would first commit a durable local state transition and, when appropriate, an outbox record under the same database transaction and uniqueness rule. A worker would send the external request using an idempotency key when the provider supports one. It would record the response through a conditional state transition so duplicate or late results cannot overwrite newer state. Timeouts with an unknown remote outcome require a pending state, bounded retries, reconciliation with the provider, and operator-visible recovery rather than assuming the call failed.

74. What is the difference between a notice, warning, exception, parse error, and fatal error in PHP?DebuggingEasy

Question Details

Describe when each occurs, whether execution continues, how modern PHP represents many errors, and how each should be investigated.

Short Interview Answer (30-60 seconds)

Notices and warnings normally report non-fatal conditions and let execution continue. Exceptions interrupt normal flow until caught. Parse errors prevent invalid code from compiling. Fatal errors stop the current execution. In modern PHP, many engine failures are Error objects, while Error and Exception both implement Throwable.

Detailed Explanation

This question asks you to explain the different ways a PHP program shows that something has gone wrong. Some messages point out a small concern but allow the current work to continue. Others report a more serious problem while still moving forward. Another kind immediately changes the normal path and must be handled. A writing mistake can prevent part or all of the program from starting. The most serious failures stop the current work. You should also explain how to find the real cause safely by checking the exact message, location, surrounding events, and environment instead of guessing.

Useful clarifying questions:

Useful Questions to Ask the Interviewer
  • Should I use PHP 8.4 and PHP 8.5 as the baseline?
  • Should I include behavior changed by custom error handlers?
  • Should I distinguish catchable Error objects from traditional fatal error levels?
What is the difference between a notice, warning, exception, parse error, and fatal error in PHP? diagram
How to Explain It in an Interview

I would begin by reproducing the issue with the smallest useful input in the same PHP version, SAPI, configuration, extensions, dependencies, and environment. I would establish whether it affects one request, one command, one host, or every environment. Then I would capture the exact error level or Throwable class, message, file, line, stack trace when available, relevant logs, and recent changes. The first reported failure is usually more useful than later failures caused by it.

A notice is a low-severity diagnostic, commonly represented by E_NOTICE or E_USER_NOTICE. It indicates suspicious behavior that may reveal a defect but does not normally stop execution. The exact PHP version matters because conditions may be promoted to another severity in newer releases. I would inspect the referenced value, input, and control path, then fix the incorrect assumption rather than hide the notice.

A warning is a non-fatal problem, commonly represented by E_WARNING or E_USER_WARNING. PHP normally reports it and continues with the next statement. However, the failed operation may return an unusable value, so later code can still fail or produce incorrect output. For example, an include of a missing file normally raises a warning and continues, while require causes a terminating Error. I would check the operation's return value, inputs, permissions, paths, configuration, dependencies, and environment differences.

A custom handler registered with set_error_handler() can process supported notice and warning levels and may throw an ErrorException. This changes the effective behavior from reporting and continuing to exception-style control flow. The handler itself is invoked for its selected supported levels even when the current error_reporting() mask excludes that level, so a production handler that wants to honor the mask should explicitly check error_reporting() & $errno. Traditional levels such as E_ERROR, E_PARSE, E_CORE_ERROR, and E_COMPILE_ERROR cannot be handled by set_error_handler().

An exception is an object in the Exception branch of PHP's throwable hierarchy. Application code, extensions, frameworks, or Composer packages may throw one when an operation cannot complete normally. Throwing it skips the remaining statements in the current try path and unwinds the call stack until PHP finds a matching catch block. If caught, execution can recover or translate the failure. If it remains uncaught, the current execution terminates after the configured global exception handling is considered. I would inspect its concrete class, message, trace, previous exception chain, inputs, and the operation that threw it.

A parse error occurs when PHP cannot understand the source code's syntax. Traditional parser failures have the E_PARSE level. Modern PHP also has ParseError, which extends CompileError, which extends Error. Invalid code cannot run because it cannot be compiled. A syntax error in the initially requested script occurs before that script can install a local handler or enter a try block. A ParseError caused while already-running code parses separately loaded or evaluated code can be caught when it arises inside an appropriate try block. The practical diagnostic steps are to read the first parser message, inspect the reported line and nearby lines, and run php -l on the affected file.

A fatal error is a general description for a failure that terminates the current execution; it is not one single exception class. Traditional fatal levels include E_ERROR, E_CORE_ERROR, E_COMPILE_ERROR, and E_USER_ERROR. Modern PHP also represents many engine failures as Error objects, such as TypeError, ValueError, ArgumentCountError, and ParseError. Error does not extend Exception, but both Error and Exception implement Throwable. Therefore, catch (Exception $e) does not catch Error objects, while catch (Throwable $e) can catch both branches when the failure occurs in a catchable context.

An uncaught Exception or Error ultimately terminates the current execution and is reported as a fatal failure. However, catch (Throwable $e) is not a guarantee that every terminating condition can be recovered from. Startup failures, compilation failures that occur before the handler is installed, and resource exhaustion such as an out-of-memory condition may prevent ordinary application-level handling or reliable cleanup.

The practical comparison is:

  • Notice: suspicious low-severity condition; execution normally continues.
  • Warning: non-fatal failed or risky operation; execution normally continues, but its result may be invalid.
  • Exception: a thrown Exception object; normal flow stops until a matching catch handles it.
  • Parse error: invalid PHP syntax; the affected code cannot be compiled or executed.
  • Fatal error: a terminating failure; execution stops unless the underlying modern Error or Exception is caught in a context where catching is possible.

A temporary workaround might skip the affected input or disable the failing feature. That is separate from the root-cause fix. The root-cause fix corrects the invalid syntax, unsafe assumption, bad input, incorrect path, dependency mismatch, configuration difference, or unhandled failure boundary. I would verify it with the smallest reproduction, the original failing case, related edge cases, and a production-like environment. Regression prevention should include automated tests, php -l or equivalent linting, static analysis, consistent configuration, centralized private logging, and monitoring. Detailed errors should be logged securely and not displayed to production users.

Technical Approach
  1. Reproduce the issue with the smallest useful input in the same PHP version, SAPI, configuration, extensions, dependencies, and environment.
  2. Establish scope: one request, one command, one worker, one host, or all environments.
  3. Capture the exact E_* level or Throwable class, message, file, line, trace when available, logs, and recent changes.
  4. Determine when it occurs: startup, parsing or compilation, runtime operation, thrown control flow, or shutdown.
  5. Determine the default result: continue, jump to a catch block, or terminate execution.
  6. Check whether set_error_handler(), set_exception_handler(), framework handlers, or SAPI configuration changes the observed behavior.
  7. Isolate and fix the first root cause rather than secondary messages.
  8. Keep any temporary workaround separate from the permanent fix.
  9. Re-run the original reproduction and related edge cases in a production-like environment.
  10. Add linting, tests, static analysis, secure logging, monitoring, or configuration checks to prevent regression.
Practical Insights

There is no meaningful algorithmic time or memory complexity for classifying these error types. Reading an already captured message is constant work, but reproducing an environment-specific failure may take significant operational time. Stack traces and detailed logs add CPU, storage, and input/output costs, especially in high-traffic systems, so logs should be structured, rate-limited when appropriate, retained for a defined period, and protected from sensitive-data leakage. Catching Throwable adds little direct runtime cost unless failures occur frequently. Exceptions and errors should not be used as normal high-volume control flow because creating traces and handling repeated failures is slower and harder to maintain than validating expected conditions directly.

Why Interviewers Ask This

Interviewers ask this to check whether the candidate can classify PHP failures, predict whether execution continues, and investigate each failure using appropriate evidence. It also tests whether the candidate understands the difference between traditional E_* error levels and modern Throwable objects, including the separate Error and Exception branches, and whether they can avoid unsafe practices such as suppressing errors or exposing production diagnostics.

Common interview mistakes

Common mistakes include saying that every warning stops execution, treating a fatal error as one PHP class, claiming that Exception is the parent of Error, or assuming catch (Exception $e) catches TypeError and other Error objects. Other mistakes are saying all parse errors are always catchable or never catchable, ignoring that ParseError extends CompileError in modern PHP, assuming error severities are unchanged across PHP versions, and forgetting that a custom error handler can convert supported notices or warnings into ErrorException. Production mistakes include using the @ operator to suppress evidence, catching Throwable without meaningful recovery, continuing after an operation returned an invalid value, debugging secondary errors before the first failure, and displaying stack traces, paths, queries, credentials, or user data publicly.

Interview tip

Present the answer using three checks for each type: when it occurs, whether execution normally continues, and whether it is a Throwable. Clearly separate traditional E_* levels from the modern Error and Exception hierarchy. Finish with a practical process: reproduce, collect evidence, isolate the first failure, fix the root cause, verify the result, and prevent regression.

Interviewer may ask next
Can PHP notices and warnings be converted into exceptions?

Yes. A handler registered with set_error_handler() can receive supported notice and warning levels and throw an ErrorException. That changes control flow, so code that previously continued may terminate if the ErrorException is not caught. The handler should explicitly check error_reporting() & $errno when it must honor the active reporting mask. It cannot convert levels that set_error_handler() does not handle, including E_ERROR, E_PARSE, E_CORE_ERROR, and E_COMPILE_ERROR.

Can catch (Throwable $e) handle every fatal failure in PHP?

No. It can catch Exception objects and catchable Error objects, including TypeError, ValueError, and ParseError when they arise inside a catchable execution context. It cannot reliably recover from failures that happen before the relevant try block or handler exists, and severe engine or resource failures may prevent normal handling or cleanup. Production systems therefore also need private logs, shutdown diagnostics where appropriate, monitoring, and process-level supervision.

75. What is Xdebug?NEWDebuggingEasy

Question Details

Define Xdebug as a PHP extension for development diagnostics. Explain step debugging with an IDE, breakpoints, stack and variable inspection, improved diagnostics, tracing, profiling, and code-coverage support. Explain that Xdebug modes have overhead, should be configured deliberately, and normally should not remain broadly enabled in production.

Short Interview Answer (30-60 seconds)

Xdebug is a PHP extension for development diagnostics. It supports IDE step debugging, breakpoints, stack and variable inspection, richer diagnostics, tracing, profiling, and code coverage. Its modes add overhead, so I enable only what I need and normally keep Xdebug broadly disabled in production.

Detailed Explanation

Xdebug is a development helper for PHP. It helps a developer understand what a program is doing when something goes wrong or behaves differently from what was expected. Instead of guessing, the developer can pause the program, look at its current values, follow how it reached that point, and collect information about what happened during a run. It can also help show which parts take more work and which parts were exercised by tests. These abilities are useful during development, but they can make a running application use more resources.

Useful Questions to Ask the Interviewer
  1. Would you like me to focus mainly on step debugging, or also explain tracing, profiling, and code coverage?
  2. Should I also explain why Xdebug is usually restricted or disabled in production?
What is Xdebug? diagram
How to Explain It in an Interview

Xdebug is a PHP extension for development diagnostics. When investigating a problem, I first reproduce it, determine its scope, review the available evidence, and choose the smallest useful diagnostic step instead of enabling every Xdebug feature.

For interactive debugging, Xdebug supports step debugging with an IDE such as PhpStorm or VS Code with a compatible debugger integration. I can set a breakpoint, which is a selected location where execution pauses. When PHP reaches that breakpoint, I can inspect variable values, review the call stack, and step through the code. The call stack shows the sequence of function or method calls that led to the current execution point. This is useful when an error message or application log does not provide enough context.

Xdebug also provides richer development diagnostics. I still distinguish different kinds of evidence. An exception represents an exceptional condition thrown by code. Error objects represent serious PHP runtime problems that are throwable in modern PHP. Warnings are diagnostic messages that normally do not stop execution by themselves. Application logs are records produced by the application or runtime. Stack traces show the chain of calls that led to a particular point or failure. Xdebug traces and profiler output provide other kinds of execution evidence.

Function tracing records execution activity so I can study which function calls occurred and, depending on configuration, additional information about those calls. Profiling collects performance evidence that helps identify where execution time is spent and how functions call one another. Code coverage records which executable parts of the code were exercised during a run, commonly while automated tests execute. Coverage shows execution, not whether the tests are logically correct.

Xdebug controls major capabilities through modes such as debug, develop, trace, profile, and coverage. Step debugging uses debug mode. Development helpers use develop mode. Function tracing uses trace mode. Profiling uses profile mode. Coverage uses coverage mode. Multiple modes can be enabled, but that does not mean they should all be active at the same time. Each enabled capability performs extra work, so I configure only what the investigation requires. ([xdebug.org](https://xdebug.org/docs/step_debug?utm_source=chatgpt.com))

The costs depend on the feature. Step debugging adds debugging work and can pause a request while I inspect it. Tracing can collect substantial execution data and create output files. Profiling collects call and timing information. Coverage tracks executed code and can noticeably slow test runs. These features can therefore increase execution time, CPU work, memory use, disk activity, or generated diagnostic data. Xdebug also provides an off mode for situations where its functionality is not needed. ([xdebug.org](https://xdebug.org/docs/step_debug?utm_source=chatgpt.com))

In production, I normally do not leave Xdebug broadly enabled. The overhead is usually unnecessary, and detailed development diagnostics can reveal internal implementation information if exposed incorrectly. Production troubleshooting should normally rely on controlled logs, monitoring, tracing, and other production-safe evidence. If Xdebug is required for a tightly controlled diagnostic session, I would limit the enabled mode, access, output, and duration and make sure sensitive values are not exposed.

Enabling Xdebug temporarily is only a diagnostic technique, not the root-cause fix. After the evidence identifies the real cause, I fix the underlying code or configuration problem. Then I reproduce the original scenario again, verify the expected result, and add or improve a regression test when appropriate. Finally, I disable diagnostic modes that are no longer required.

Technical Approach
  1. Reproduce the PHP problem consistently.
  2. Determine the scope, including the affected request, code path, environment, and conditions.
  3. Review existing evidence such as exceptions, Error objects, warnings, logs, stack traces, and environment differences.
  4. Choose the smallest useful Xdebug capability instead of enabling everything.
  5. Use step debugging when live program state is important, tracing when execution history is important, profiling when performance evidence is needed, or coverage when test execution evidence is needed.
  6. For step debugging, connect Xdebug to the IDE, set a breakpoint near the suspected code, reproduce the problem, and inspect variables and the call stack.
  7. Form and verify a root-cause hypothesis from the evidence.
  8. Fix the underlying code or configuration problem rather than treating Xdebug as the fix.
  9. Reproduce the original scenario and verify the correction.
  10. Add or improve a regression test when appropriate and disable Xdebug modes that are no longer needed.
Practical Insights

Xdebug does not normally change the algorithmic Big-O complexity of the application code, but its diagnostic features add operational cost. Step debugging adds debugger work and can intentionally pause execution. Tracing may collect large amounts of execution data and write files. Profiling gathers call and timing information. Code coverage tracks which code executes and can make test runs slower. Depending on the enabled feature and workload, these modes can increase execution time, CPU use, memory use, disk activity, or diagnostic-data volume. The practical rule is to enable only the capability needed for the investigation.

Why Interviewers Ask This

Interviewers want to know whether the candidate understands what Xdebug is, which debugging and diagnostic problems it solves, how it works with an IDE, and when tracing, profiling, and code coverage are useful. They also want to see sound operational judgment because Xdebug's diagnostic modes add overhead and should be enabled only when their evidence is needed.

Common interview mistakes

Common mistakes include describing Xdebug only as an error-display tool and ignoring step debugging, tracing, profiling, and coverage; enabling every mode instead of choosing the smallest useful one; confusing a stack trace with a function trace or profiler output; assuming code coverage proves that tests are correct instead of only showing which code executed; treating Xdebug as the root-cause fix instead of using it to collect evidence; suppressing errors instead of investigating them; leaving expensive modes broadly enabled in production; and exposing detailed diagnostics or sensitive variable values to users.

Interview tip

Start by defining Xdebug as a PHP extension for development diagnostics. Then name its main capabilities: IDE step debugging, breakpoints, stack and variable inspection, richer diagnostics, tracing, profiling, and code coverage. Finish with the tradeoff: these modes add overhead, so enable only what you need and normally keep Xdebug broadly disabled in production.

Interviewer may ask next
How does step debugging with Xdebug work?

Xdebug communicates with a compatible IDE debugger integration. I reproduce the problem, set a breakpoint at a useful location, and start a debugging session. When PHP execution reaches that breakpoint, Xdebug pauses execution and the IDE lets me inspect variables, examine the call stack, and step through the code. This gives direct evidence about program state instead of relying on guesses. Step debugging is provided by Xdebug's debug mode. ([xdebug.org](https://xdebug.org/docs/step_debug?utm_source=chatgpt.com))

Why should Xdebug normally not remain broadly enabled in production?

Xdebug's diagnostic capabilities perform extra work. Step debugging, tracing, profiling, and coverage can add execution, CPU, memory, disk, or data-collection costs depending on how they are configured and used. Detailed diagnostics can also expose internal information if they are shown or stored carelessly. Production systems should normally use production-safe logging and monitoring instead. If Xdebug is temporarily required for a controlled investigation, only the necessary capability should be enabled, access and output should be restricted, sensitive information should be protected, and the capability should be disabled afterward. ([xdebug.org](https://xdebug.org/docs/step_debug?utm_source=chatgpt.com))

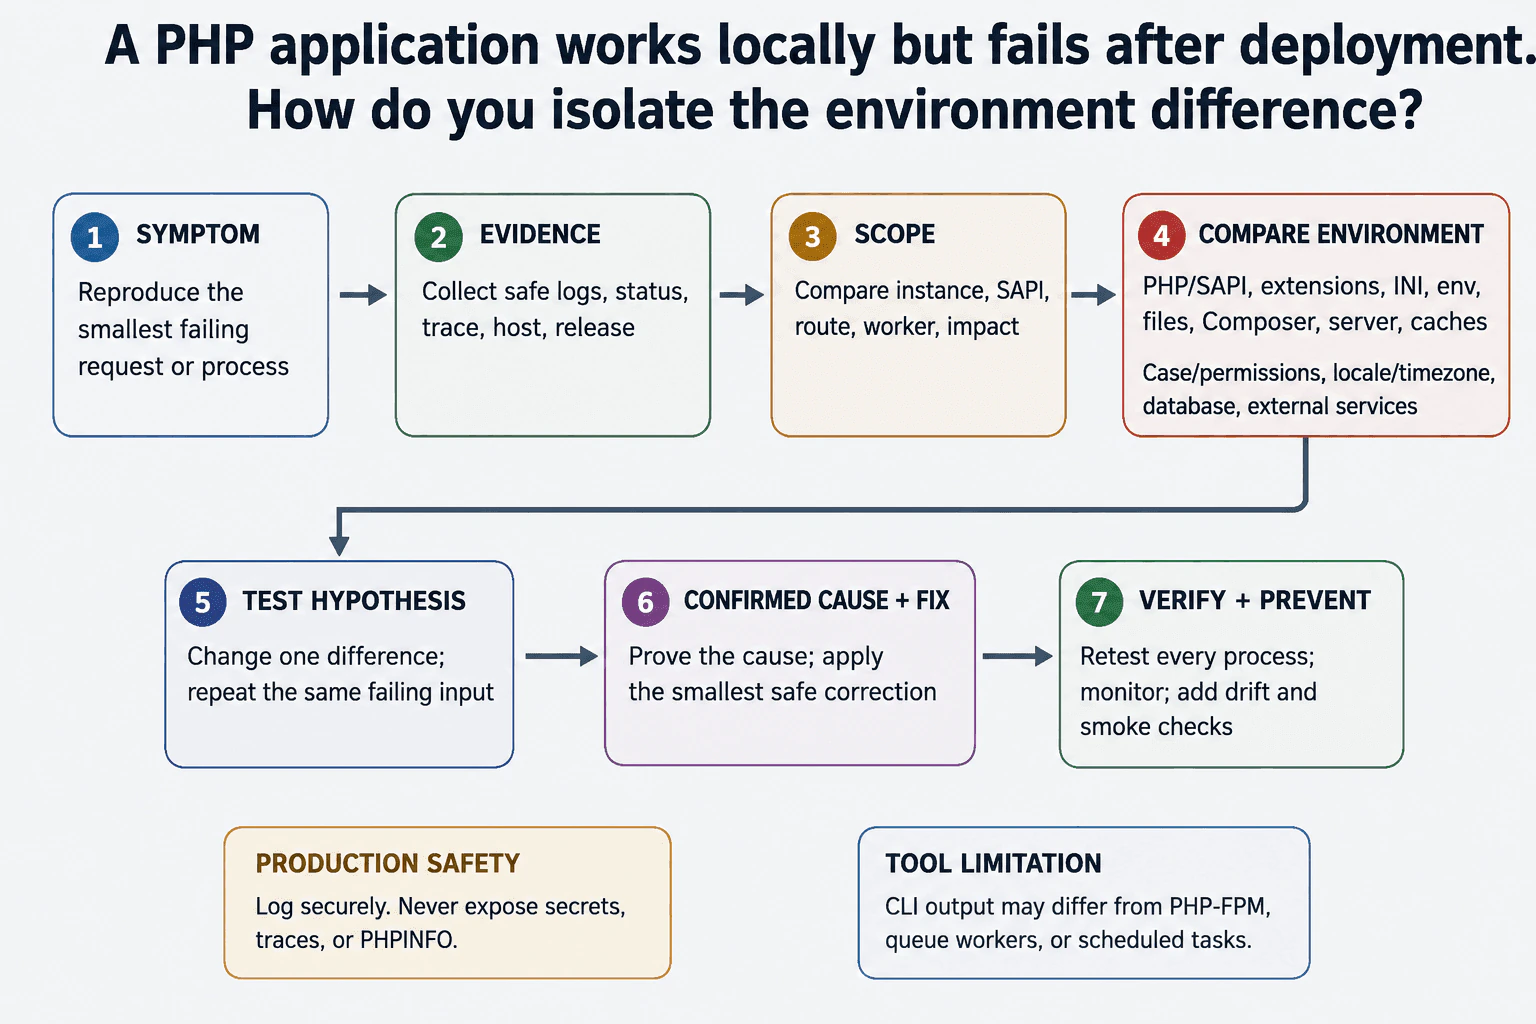
76. How do you enable useful error reporting in a PHP development environment?DebuggingEasy

Question Details

Explain error_reporting, display_errors, log_errors, environment-specific configuration, and why detailed errors must not be shown to production users.

Short Interview Answer (30-60 seconds)

In development, I set error_reporting to E_ALL, enable display_errors and display_startup_errors, and enable log_errors with a protected writable log destination. In production, I keep reporting and logging enabled but disable error display so users never see sensitive diagnostic details.

Detailed Explanation

This question asks how to make software problems visible while a website or service is being built and tested. A useful setup should immediately show the developer what failed and should also keep a record that can be reviewed later. Small warning signs should not be hidden because they may reveal a real defect. The setup must change when the system becomes public. Detailed failure information is helpful to the development team, but showing it to visitors may reveal private file locations, settings, stored information, or other clues that could create a security risk.

Useful clarifying questions:

Useful Questions to Ask the Interviewer
  • Which PHP SAPI is running: CLI, PHP-FPM, CGI, or an Apache module?
  • Can I change php.ini or the server configuration, or only application-level settings?
  • Where are PHP errors currently sent, and how are those logs protected and monitored?
How do you enable useful error reporting in a PHP development environment? diagram
How to Explain It in an Interview

I first reproduce the problem, confirm whether it affects one request or the whole environment, and collect the existing response and log evidence. The smallest useful diagnostic step is to check the effective PHP error settings and the active configuration file before changing anything.

For a controlled development environment, I normally configure:

error_reporting = E_ALL display_errors = On display_startup_errors = On log_errors = On error_log = /protected/path/php-error.log

error_reporting selects which PHP diagnostic levels are reported. E_ALL is the normal development choice because it includes all error levels defined by the running PHP version, including warnings, notices, and deprecation messages.

display_errors determines whether reported diagnostics are added to the program output. I enable it during controlled development so the developer receives immediate evidence. For command-line debugging, PHP may display diagnostics through standard output or standard error depending on the SAPI and configuration.

display_startup_errors controls diagnostics produced during PHP startup. I enable it temporarily in development when investigating startup or configuration failures. Application code cannot reliably enable it for a failure that occurs before that code executes, so it should be configured outside the failing script.

log_errors tells PHP to send reportable diagnostics to the configured error destination. I normally enable it in development and production because logs preserve evidence when no response is visible, output is interrupted, or a worker, scheduled command, or background process fails.

error_log can identify a writable protected file, syslog, or another destination supported by the environment. If it is not explicitly set, PHP normally uses the error logger provided by its SAPI, such as the web server log or standard error for CLI. I verify the actual destination instead of assuming that a particular file is used.

I prefer environment-specific configuration in php.ini, an additional INI file, a PHP-FPM pool, the web-server configuration, container settings, or deployment configuration. CLI, PHP-FPM, CGI, and an Apache module can load different configuration files and values. I therefore check the active SAPI and loaded configuration with an appropriate diagnostic command or a temporary protected diagnostic page, then remove any public diagnostic page after use. Long-running services such as PHP-FPM may need a reload or restart before configuration changes take effect.

Runtime calls such as error_reporting(E_ALL) and ini_set('display_errors', '1') can help isolate a problem in code that successfully starts executing. They are not a complete replacement for environment configuration because they cannot reveal a parse, compile, or startup failure that prevents the same script from running. Server-level or INI configuration is therefore the safer baseline for development diagnostics.

In production, I normally keep error_reporting = E_ALL and log_errors = On, but set display_errors = Off and display_startup_errors = Off. Reporting should not be disabled merely to hide errors. Detailed output may expose absolute paths, stack traces, source structure, query details, configuration data, or request values. The application should return a generic user-safe error response while authorized developers investigate protected logs and monitoring data.

After enabling useful reporting, I reproduce the failure and classify the evidence correctly. A warning may allow execution to continue. An Error or an uncaught exception is a throwable failure and may terminate the current execution. A startup or parse failure may occur before application handlers are installed. Logs and traces show PHP execution evidence, while profiler or database evidence must come from the relevant profiler, database, framework, extension, or external service rather than from error_reporting alone.

I fix the root cause instead of using the @ error-control operator, lowering the reporting level, or hiding the output as a workaround. If a temporary workaround is required, I identify it clearly and still track the real correction.

Finally, I repeat the original reproduction steps, verify that the error is gone, confirm that no new diagnostics were introduced, and test that production responses remain generic. When practical, I add an automated regression test. I also verify log permissions, access controls, rotation, retention, disk monitoring, and sensitive-data filtering so logging remains useful and safe.

Technical Approach
  1. Reproduce the failure and determine its scope.
  2. Capture the current response, logs, timestamp, and request or command context.
  3. Identify the active PHP SAPI and loaded configuration files.
  4. Check the effective values of error_reporting, display_errors, display_startup_errors, log_errors, and error_log.
  5. In controlled development, use E_ALL, enable display, and enable protected logging.
  6. Reload or restart the relevant long-running service when required.
  7. Reproduce the failure and classify the evidence as a warning, Error, exception, parse or startup failure, or environment difference.
  8. Fix the root cause instead of suppressing the diagnostic.
  9. Repeat the original test and check for additional diagnostics.
  10. Verify that production logs details securely while displaying only a generic response.
  11. Add regression coverage and maintain log access, rotation, retention, and monitoring.
Practical Insights

Checking or enabling these settings has constant time and memory cost for each configuration lookup and does not change the algorithmic complexity of the application. When no errors occur, the runtime overhead is usually small. When many errors occur, formatting and writing messages can add CPU work, input and output activity, latency, and storage use. A repeated warning inside a large loop can create a large log quickly. Error messages and stack traces also use some temporary memory, but there is no reliable fixed amount because trace depth and message size vary. Operational and maintenance costs include securing logs, filtering sensitive data, rotating files, setting retention limits, monitoring disk space, and investigating noisy or duplicate events.

Why Interviewers Ask This

Interviewers want to confirm that the candidate can collect useful debugging evidence without exposing sensitive production information. This evaluates practical knowledge of error_reporting, display_errors, display_startup_errors, log_errors, error_log, environment-specific configuration, PHP SAPIs, verification, and safe production behavior.

Common interview mistakes

Mistakes include enabling display_errors or display_startup_errors on a public production system; setting error_reporting to 0 to hide defects; using the @ operator to suppress evidence; assuming E_ALL makes every framework, database, or external-service problem appear in PHP's error log; assuming CLI and PHP-FPM load the same configuration; editing the wrong php.ini; forgetting to reload PHP-FPM or another long-running process; relying only on ini_set inside a script that cannot parse or start; assuming error_log always means a specific file; using an unwritable or publicly accessible log path; logging credentials, tokens, personal data, request bodies, or session values; allowing repeated errors to fill storage; confusing a generic error page with a root-cause fix; and failing to repeat the original test after the change.

Interview tip

Explain the environment split first: development displays and logs full diagnostics, while production logs them but never displays them. Then mention E_ALL, startup errors, the active SAPI and configuration file, protected log destinations, root-cause correction, verification, and regression prevention.

Interviewer may ask next
Why should error_reporting remain enabled in production when display_errors is disabled?

error_reporting selects which PHP diagnostic levels are reported, while display_errors controls whether those diagnostics are included in output. Keeping E_ALL and log_errors enabled preserves evidence for authorized developers. Disabling display_errors protects users from file paths, stack traces, query details, configuration information, and other sensitive internal data.

Why might changing error settings inside a PHP script fail to reveal the original problem?

The script must begin executing before error_reporting or ini_set calls can run. A parse, compile, or startup failure may happen earlier, so the runtime change is never applied. I would configure the active php.ini, PHP-FPM pool, web server, container, or CLI environment, verify the effective settings, reload the relevant service when needed, and then reproduce the failure again.

77. How would you debug a PHP page that returns a blank screen?DebuggingEasy

Question Details

Give a systematic process covering HTTP status, server and PHP logs, syntax checks, error configuration, recent changes, dependencies, and a minimal reproduction.

Short Interview Answer (30-60 seconds)

I would reproduce the request, inspect its HTTP status and body, correlate it with server and PHP logs, lint recent changes, verify safe error logging, check dependencies and environment differences, and create a minimal reproduction. Then I would fix the root cause, retest the page, and prevent regression.

Detailed Explanation

A blank page means the visitor receives no useful result, but it does not reveal what failed. The page might stop before producing content, hide the failure reason, send an empty result, or depend on something unavailable. I would avoid random changes. First, I would repeat the problem and learn whether it affects one page, one person, one machine, or everyone. I would collect evidence, compare the failing situation with a working one, narrow the problem to its smallest failing part, correct the real cause, and confirm the repair without exposing private information.

Useful clarifying questions:

Useful Questions to Ask the Interviewer
  • Does the blank page occur in production, testing, development, or every environment?
  • Is it limited to one URL, request method, user, or input?
  • What HTTP status code and response headers are returned?
  • Did it start after a deployment, configuration change, or dependency change?
  • Which web server and PHP SAPI handle the request, such as Apache with mod_php, Nginx with PHP-FPM, or Apache with PHP-FPM?
How would you debug a PHP page that returns a blank screen? diagram
How to Explain It in an Interview

I would begin with reproduction, scope, evidence, and the smallest useful diagnostic step.

  1. Reproduce the exact request and define the scope. I would repeat the same URL, HTTP method, input, authentication state, headers, and environment. I would determine whether the failure is consistent or intermittent and whether it affects one route or the whole application. I would also compare it with a known working request. Before changing code, I would record the time, deployment version, host, and any request or correlation ID available.
  1. Inspect the complete HTTP response. I would use browser developer tools, curl, or an API client to inspect the status code, response headers, redirects, content type, and raw body. A browser can look blank even when the server returned an error document, an empty successful response, a redirect loop, or content that client-side code hides.

An HTTP 500 response commonly indicates an application or server-side failure. A 200 response with an empty body can result from an early exit or die, a branch that renders nothing, discarded output buffering, a missing template, incorrect routing, or code that completes without writing a response. A 502 or 504 response points first toward communication or timeout problems between the web server and an upstream handler such as PHP-FPM, although the underlying trigger may still be slow or failed PHP execution.

  1. Correlate the request with the correct logs. I would inspect the web server error log, PHP error log, PHP-FPM pool log when PHP-FPM is used, and the application's own logs. I would search by timestamp, request ID, route, process, or host rather than reading unrelated entries.

I would distinguish the evidence types. An exception is an object that application code may catch. A PHP Error represents serious runtime problems such as calling an undefined function and is also throwable in modern PHP. Warnings normally allow execution to continue but can still explain missing includes, failed file access, or invalid configuration. A stack trace shows the call path to an uncaught throwable. Logs record events over time. A profiler or trace can show where execution spends time or stops, but I would use one only when basic response and log evidence is insufficient, especially for intermittent failures or timeouts.

  1. Check PHP syntax with the relevant runtime version. I would run php -l path/to/file.php on recently changed files or use the project's established lint command for all PHP files. A parse error can produce a blank response when errors are not displayed. Linting checks syntax without executing the file, so it does not detect runtime, dependency, database, or business-logic failures.

I would confirm that the CLI binary used for linting is compatible with the PHP version serving the request. The CLI and web SAPIs can use different PHP versions, extensions, and configuration files. Therefore, a successful CLI lint is useful evidence but does not prove that the web runtime is configured correctly.

  1. Verify error configuration safely. I would inspect the active error_reporting, display_errors, display_startup_errors, log_errors, and error_log settings for the SAPI that serves the page. In a controlled development environment, displaying errors can make diagnosis faster. In production, detailed errors should not be displayed because they can reveal file paths, queries, credentials, tokens, or internal code. Production should return a safe error response while recording detailed information in protected logs.

I would not rely on adding ini_set('display_errors', '1') inside the failing script to reveal every problem. If the file cannot be parsed or PHP fails before that statement executes, the runtime setting is never applied. For those failures, I would use server-level or SAPI-level configuration, logs, and linting. I would not leave a public phpinfo() or PHP-FPM status endpoint exposed; any temporary diagnostic endpoint must be restricted and removed after use.

  1. Review recent code and deployment changes. I would compare the failing release with the last known working release. I would inspect changed PHP files, routes, templates, bootstrap code, environment variables, PHP configuration, web server configuration, container or host images, file ownership, permissions, generated caches, and deployment steps.

Reverting a release may restore service quickly, but that is a workaround unless the change responsible for the failure is identified. I would preserve evidence before rollback when possible, then investigate and correct the root cause in a controlled environment.

  1. Verify dependencies, autoloading, and platform requirements. I would confirm that vendor/autoload.php exists and that the deployed vendor directory matches the committed composer.lock. For an application with a lock file, deployment should normally run composer install so that the locked versions are installed; running an uncontrolled composer update in production can change dependency versions and introduce new failures.

I would run Composer's platform-requirement check when appropriate to verify the actual PHP version and required extensions. I would also check whether Composer scripts completed successfully, whether generated autoload files are current, and whether production autoloader optimization is consistent with the application's class-loading behavior. Composer packages, core PHP, PHP extensions, and framework bootstrap code are separate layers, so I would identify which layer fails rather than treating them as one system.

  1. Check environment and external dependencies using evidence. I would compare the failing environment with a working one: PHP version, SAPI, loaded extensions, php.ini files, environment variables, filesystem paths, permissions, memory limit, execution-time limit, timezone, and web server or PHP-FPM configuration.

If logs or traces point toward a database, I would verify connectivity, credentials, network access, connection limits, query errors, locks, and timeouts. Database evidence could include driver exceptions, database logs, connection metrics, or a safely executed health query. I would similarly check external APIs, queues, caches, storage, and DNS only when the request path uses them or evidence points to them. I would not assume that every blank page is a database failure.

  1. Build a minimal reproduction. I would reduce the failing path to the smallest request that still demonstrates the problem. I might first confirm that a simple PHP response works, then add the front controller, bootstrap file, Composer autoloader, routing, controller, service, database call, and template rendering one layer at a time. Alternatively, I could remove layers from the failing request until it works. The boundary where behavior changes identifies the smallest useful area to investigate.

A minimal reproduction should use safe test data and should not be deployed as an unprotected production diagnostic page. It is an isolation technique, not the final fix.

  1. Correct the root cause and separate it from temporary mitigation. The root-cause fix depends on the evidence. Examples include correcting invalid syntax, restoring a missing deployment artifact, installing a required extension, fixing an autoload mapping, correcting a file permission, handling a throwable, repairing configuration, or adding a timeout and failure path around an external dependency.

A rollback, process restart, cache clear, increased limit, or temporary feature disablement may reduce impact, but it should be documented as mitigation unless it permanently removes the identified cause. I would not suppress errors with @, hide warnings, or increase memory and timeout limits without understanding why the limits were reached.

  1. Verify the repair. I would repeat the original request with the same inputs and confirm the expected status code, headers, content, and side effects. I would check that no new PHP, server, database, or application errors appear in logs. I would test related routes and both success and failure cases. Where multiple instances or workers exist, I would verify that the corrected release and configuration reached all of them.
  1. Prevent regression. I would add the most relevant protection: an automated test for the failing path, syntax checks in continuous integration, Composer lock-file and platform checks, deployment validation, a health check, structured error logging, request IDs, monitoring for empty or 5xx responses, or an alert for PHP-FPM and dependency failures. The prevention should target the identified cause rather than adding unrelated complexity.

The main tradeoff is diagnostic visibility versus security and operational risk. Development can expose more detail in a controlled environment. Production should reveal little to the visitor while preserving enough protected evidence for engineers to find the cause.

Technical Approach
  1. Reproduce the exact request and record its scope, time, environment, and deployment version.
  2. Inspect the HTTP status, headers, redirects, content type, and raw body.
  3. Correlate the request with web server, PHP, PHP-FPM, and application logs.
  4. Classify the evidence as an exception, PHP Error, warning, server failure, timeout, or empty application response.
  5. Lint changed files with the relevant PHP version and remember that linting does not execute code.
  6. Verify the serving SAPI's PHP version, loaded configuration, error reporting, and secure logging settings.
  7. Review recent code, configuration, deployment, permission, and cache changes.
  8. Verify Composer installation, autoloading, lock-file consistency, required PHP extensions, and platform requirements.
  9. Check databases and external services only when the request path or evidence supports doing so.
  10. Compare failing and working environments.
  11. Reduce the failure to a safe minimal reproduction.
  12. Apply the root-cause fix, distinguish temporary mitigation, verify related behavior, and add targeted regression prevention.
Practical Insights

Most first-line checks are inexpensive because they inspect one response, a small time window in the logs, and recently changed files. Their time cost grows with the number of servers, workers, releases, and log sources involved. Searching unstructured or very large logs can be slow, while timestamps and request IDs make it faster. PHP syntax linting processes each checked file, so checking the whole codebase takes roughly more time as the number and size of files increase. It uses temporary memory but does not run the application. Profiling and detailed tracing add CPU, memory, storage, and latency overhead, so they should be sampled or used in controlled conditions. A minimal reproduction and automated regression test require maintenance effort, but they reduce repeated investigation and future outage risk.

Why Interviewers Ask This

Interviewers ask this question to evaluate whether the candidate investigates an unclear server-side failure systematically instead of guessing. A strong answer demonstrates knowledge of HTTP responses, PHP errors and exceptions, web server and PHP logs, syntax validation, runtime configuration, Composer dependencies, PHP extensions, environment differences, safe production diagnostics, failure isolation, root-cause correction, verification, and regression prevention.

Common interview mistakes

Common mistakes include making random changes before reproducing the issue; checking only what the browser displays instead of the raw HTTP response; enabling detailed error display publicly in production; assuming ini_set() inside the failing file can reveal a parse error in that file; suppressing warnings with @; ignoring web server, PHP-FPM, startup, or application logs; reading logs without correlating the correct request; using a different CLI PHP version and configuration from the web SAPI; assuming every blank page is a database problem; running composer update directly in production; ignoring missing extensions or platform requirements; changing many variables at once; treating a restart, cache clear, limit increase, or rollback as proof of root cause; leaving phpinfo() or status pages exposed; profiling production without controlling overhead; and verifying only the original URL without checking related behavior and logs.

Interview tip

Present the investigation in a strict order: reproduce and scope, inspect the raw HTTP response, correlate logs, lint syntax, verify the serving PHP environment, review recent changes and dependencies, isolate a minimal reproduction, fix the root cause, verify the repair, and prevent regression. Clearly distinguish safe development diagnostics from secure production behavior.
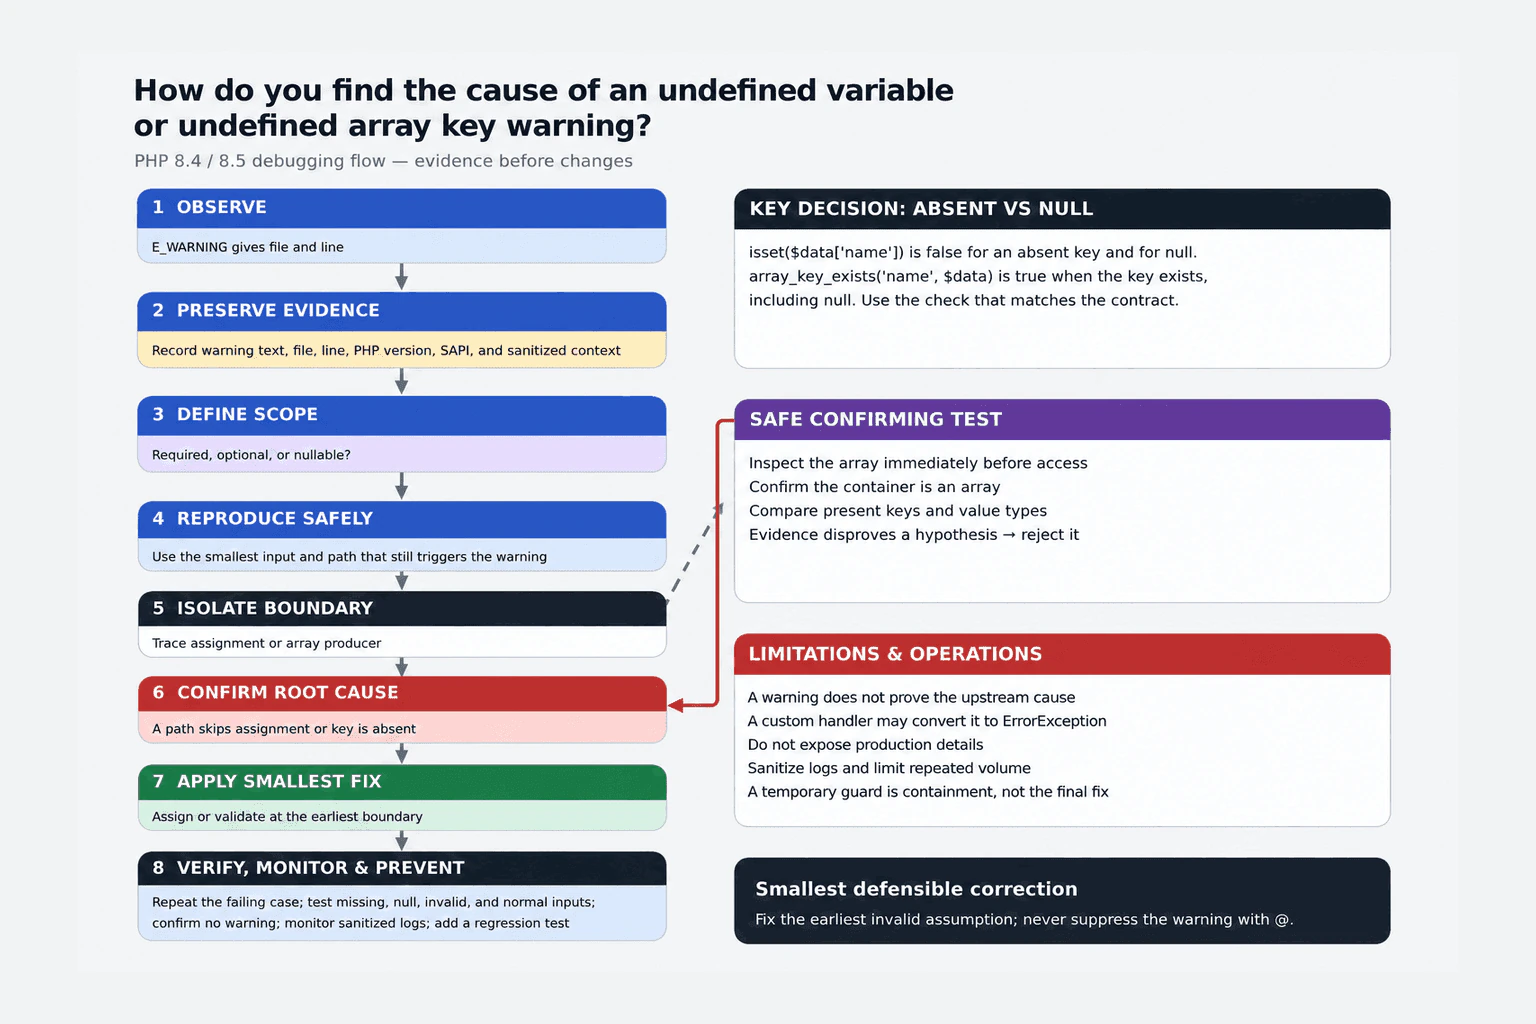
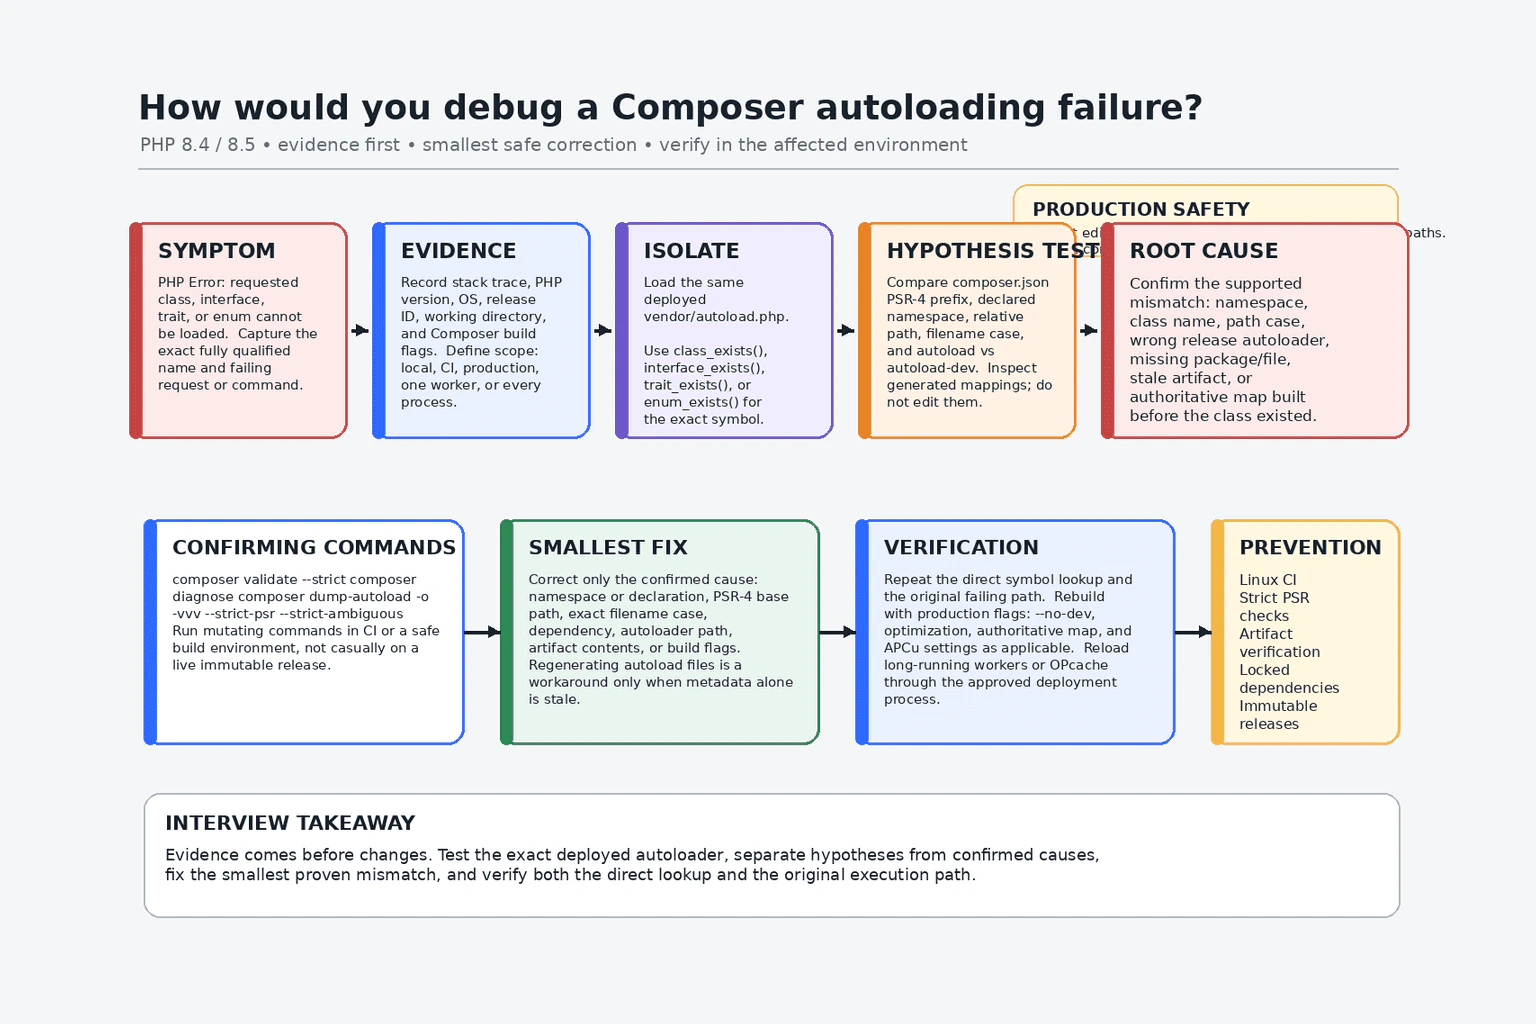
Interviewer may ask next
What would you do if the page returns HTTP 200 but the response body is empty?

I would confirm the empty raw body with curl or browser developer tools and correlate the request with logs. Then I would trace the request through the front controller, bootstrap, middleware, routing, controller, and rendering path. I would check for early exit or die, branches that return no content, output buffers that are cleaned or never flushed, missing templates, swallowed throwables, and middleware that replaces the response. I would reduce the path to a minimal response and add each layer back until the empty result returns.

How would your debugging process differ between development and production?

In development, I can enable detailed error display in a controlled environment, attach a debugger, and collect full traces. In production, I would keep detailed error display disabled, return a safe response, and use protected logs, request IDs, metrics, limited tracing, and monitoring. I would preserve evidence, avoid uncontrolled live experiments, restrict diagnostic endpoints, control profiler overhead, protect sensitive data, use mitigation only when necessary to reduce impact, and validate the root-cause fix safely before a controlled deployment.

78. How would you debug an intermittent 500 error in a PHP application?DebuggingMedium

Question Details

Explain correlation IDs, web-server and PHP-FPM logs, exception traces, request context, dependency failures, sampling, reproduction, and safe production diagnostics.

Short Interview Answer (30-60 seconds)

I would scope and reproduce the failure, assign a correlation ID, and trace affected requests through the web server, PHP-FPM, application, database, and dependencies. I would collect sanitized evidence, add targeted diagnostics only when needed, isolate one cause at a time, verify the fix, and prevent regression.

Detailed Explanation

This question asks how I would find a failure that appears only sometimes and causes a visitor's request to fail. I should explain how I would identify which requests are affected, what those requests have in common, and which part of the service stops working. I also need to show how I would gather useful evidence without exposing private information or making the live service less stable. Finally, I should explain how I would repeat the failure safely, prove the real cause, check the repair, and reduce the chance of the same failure returning.

Useful clarifying questions:

Useful Questions to Ask the Interviewer
  • Which routes, request methods, users, hosts, regions, or deployment versions are affected?
  • Is the response definitely an HTTP 500, and which component generated it?
  • Is a correlation ID already propagated through the infrastructure and application logs?
  • Can I access reverse-proxy, web-server, PHP-FPM, application, database, operating-system, and dependency evidence?
  • Did the issue begin after a deployment, configuration change, traffic increase, data change, or dependency incident?
  • What privacy, security, performance, and change-control limits apply to production diagnostics?
How would you debug an intermittent 500 error in a PHP application? diagram
How to Explain It in an Interview

I would begin with reproduction, scope, evidence, and the smallest useful diagnostic step.

First, I would verify the exact response status, timestamp, route, request method, host, deployment version, and component that generated the response. An application may return an HTTP 500, while a reverse proxy or gateway may return a different server-side status such as 502 or 504 when PHP-FPM is unavailable or times out. I would not assume that every server error came from application code.

I would define the scope by comparing failed requests with successful requests. I would look for patterns involving a route, request payload shape, customer account, authenticated state, server or container, deployment version, traffic level, geographic region, data record, or external dependency. Intermittent failures are often easier to isolate by finding the smallest difference between success and failure.

Next, I would attempt a safe reproduction. I would use a sanitized copy of a failed request and match the relevant production conditions, including the PHP version, loaded extensions, php.ini settings, PHP-FPM pool configuration, Composer dependencies, framework configuration, environment variables, permissions, deployment artifact, data shape, and external-service behavior. I would also test timing, concurrency, and repeated execution when the evidence suggests a race condition, resource limit, lock, or transient dependency failure.

I would make sure each request has a correlation ID. A correlation ID is a unique value used to connect all events related to one request. A trusted proxy may create it, or the application may generate a cryptographically random value when it is missing. The value should be validated before being copied into logs or response headers. It should appear in the response header and in structured logs from every relevant component that supports it.

Using the correlation ID and timestamp, I would inspect evidence in this order:

  1. Reverse-proxy or load-balancer evidence, to confirm the response status, selected upstream, connection result, retries, and timeout behavior.
  2. Web-server logs, such as Nginx or Apache logs, to identify upstream failures, malformed responses, permission problems, or routing differences.
  3. PHP-FPM logs and metrics, to identify worker termination, pool saturation, queue growth, slow requests, process restarts, memory pressure, or configuration limits.
  4. Application logs, to identify uncaught Throwable objects, domain failures, invalid state, and application-specific context.
  5. Database, cache, queue, file-system, DNS, and external-service evidence, to identify connection failures, deadlocks, lock waits, timeouts, rate limits, invalid responses, or temporary unavailability.
  6. Operating-system and container evidence, to identify out-of-memory termination, process crashes, file-descriptor exhaustion, disk problems, or resource throttling.

In modern PHP, both Exception and Error implement Throwable. An Exception commonly represents a condition intentionally reported by application or library code. An Error represents serious runtime problems such as type errors and other engine-level failures. Warnings are runtime messages that do not automatically become Throwable objects unless the application deliberately converts them with an error handler. Logs record events, while a stack trace records the call sequence that led to a Throwable. Profiler or tracing evidence shows time and resource use. Database evidence includes query errors, execution time, locks, deadlocks, connection counts, and server health.

For a failed request, I would capture the Throwable class, message, code, stack trace, correlation ID, route name, request method, deployment version, host or container identifier, elapsed time, memory usage, and dependency timings. I would also record whether the response had already started and which application stage failed. I would not log passwords, authentication tokens, cookies, session contents, payment data, secret environment values, database credentials, or unrestricted request bodies. The client should receive a generic error response and a support-safe correlation ID, not an internal error message or stack trace.

I would verify PHP's production error settings. Errors should be logged, but sensitive details should not be displayed to users. I would not recommend suppressing errors with the @ operator or hiding failures without recording them. I would also confirm that the framework or application has a final exception handler that records uncaught Throwable objects and returns a controlled response. A shutdown handler may help record certain fatal termination details available through error_get_last(), but it cannot reliably recover from every process crash, forced termination, out-of-memory event, or segmentation fault. Infrastructure and operating-system evidence are still required.

I would inspect PHP-FPM carefully. I would check pool settings such as pm.max_children, request_terminate_timeout, request_slowlog_timeout, and slowlog where configured. I would inspect active and idle workers, queued connections, worker restart counts, request duration, and memory use. Increasing a timeout or worker limit without evidence can worsen saturation or memory pressure, so I would treat such changes as controlled mitigations rather than automatic fixes.

I would isolate dependencies instead of assuming PHP itself is responsible. For a database, I would inspect connection errors, query duration, lock waits, deadlocks, transaction scope, and connection exhaustion. For caches, queues, file systems, DNS, and external APIs, I would inspect latency, timeout type, response validity, connection reuse, rate limits, and retry behavior. I would verify that retrying is safe because retrying a non-idempotent operation can create duplicate writes or duplicate external actions.

Because the problem is intermittent, normal logs may not contain enough evidence. I would then add targeted production diagnostics. I would prefer structured logs or distributed tracing for one route, host, deployment version, account, or validated correlation ID. I could record all failures while sampling a limited percentage of successful requests for comparison. Sampling reduces storage and processing cost, but it can miss rare successful patterns or events that occur before the failure is recognized. Therefore, the sampling rule must match the investigation goal.

Temporary diagnostics should be narrowly scoped, access-controlled, rate-limited where appropriate, and protected by data-redaction rules. They should have an owner, an expiration time, a storage limit, and monitoring for latency, CPU, memory, and log-volume impact. I would avoid enabling unrestricted debug mode or verbose request-body logging across all production traffic.

I would then form one falsifiable hypothesis at a time. For example, if failures occur only on one PHP-FPM host, I would compare its configuration, extensions, files, permissions, environment, and resource state with healthy hosts. If failures follow a slow database call, I would inspect the query plan, lock behavior, transaction duration, connection state, and timeout chain. If failures occur during external-service latency, I would compare dependency timing with the application's timeout, retry, and fallback behavior.

I would clearly separate a workaround from the root-cause fix. A workaround might remove an unhealthy host from rotation, disable an optional feature, reduce traffic, apply a safe fallback, or temporarily adjust capacity. The root-cause fix changes the faulty code, query, configuration, deployment process, resource policy, or dependency interaction that created the failure. A reduction in errors after a workaround is useful evidence, but it does not prove that the defect has been removed.

Finally, I would verify the correction under the conditions that previously failed. I would replay sanitized requests, test relevant data states, exercise concurrency or timeout behavior when applicable, and compare error rate, latency, resource use, and dependency measurements before and after the change. I would monitor the corrected deployment long enough to cover the failure pattern. I would then add a focused regression test where practical, improve permanent structured logging or alerts, document the root cause, and remove temporary diagnostics.

Technical Approach
  1. Confirm the exact status code, response source, timestamp, route, host, and deployment version.
  2. Define the scope by comparing failed and successful requests.
  3. Reproduce the failure with sanitized data and matching runtime, configuration, dependency, timing, and concurrency conditions.
  4. Create or validate a correlation ID and propagate it through supported layers.
  5. Correlate reverse-proxy, web-server, PHP-FPM, application, database, dependency, and operating-system evidence.
  6. Distinguish Throwable traces, warnings, logs, profiling data, database evidence, and environment differences.
  7. Capture only sanitized request context, deployment metadata, timing, memory, and dependency details.
  8. Add narrowly targeted, sampled, and time-limited production diagnostics only when existing evidence is insufficient.
  9. Form one falsifiable hypothesis and isolate one component or dependency at a time.
  10. Apply a safe workaround only when necessary, while continuing the root-cause investigation.
  11. Implement the root-cause correction and verify it under the original failure conditions.
  12. Add regression protection, permanent monitoring, and documentation, then remove temporary diagnostics.
Practical Insights

Searching existing structured logs usually adds no extra cost to live requests, but investigation time grows with the number of systems, hosts, and requests involved. Additional logging and tracing consume CPU, memory buffers, disk space, network bandwidth, and log-processing capacity. Recording large stack traces or request details for every request can increase latency and storage cost, so diagnostics should be limited and sampled. Profiling may add more runtime overhead than normal logging. Increasing PHP-FPM workers can increase total memory use because each worker is a separate process. Long-term maintenance cost is reduced when correlation IDs, structured logs, deployment metadata, alerts, and regression tests already exist.

Why Interviewers Ask This

Interviewers use this question to evaluate whether a candidate can investigate an unstable production failure methodically instead of guessing. A strong answer demonstrates knowledge of PHP error behavior, PHP-FPM and web-server boundaries, request correlation, safe production observability, dependency isolation, environment comparison, incident risk management, root-cause verification, and regression prevention.

Common interview mistakes

Common mistakes include assuming every server-side error is an application-generated HTTP 500, enabling display_errors or unrestricted debug mode in production, exposing Throwable messages or traces to clients, logging secrets or complete request bodies, using an unvalidated client-provided correlation ID, reviewing only application logs, ignoring PHP-FPM and operating-system evidence, treating warnings and Throwable objects as identical, changing several variables at once, increasing timeouts or worker limits without measuring capacity, retrying non-idempotent operations, collecting unlimited verbose logs, confusing a mitigation with a root-cause fix, and declaring success before the intermittent failure has been observed over a meaningful verification period.

Interview tip

Explain the investigation as a controlled narrowing process: confirm the source, compare failures with successes, reproduce safely, correlate evidence, test one hypothesis, and verify the correction. Mention PHP-FPM, Throwable handling, dependency failures, sanitized diagnostics, sampling tradeoffs, and the difference between mitigation and root-cause repair.

Interviewer may ask next
What would you do if the error occurs only in production and cannot be reproduced locally?

I would compare production with the test environment, including PHP versions, extensions, php.ini values, PHP-FPM settings, Composer packages, framework configuration, environment variables, permissions, deployment files, data shape, traffic, and dependency behavior. I would then use correlation IDs and narrowly scoped production diagnostics to collect sanitized evidence from failed requests and a sampled set of successful requests. I would limit the diagnostic duration and monitor its overhead. The collected evidence would be used to build a closer reproduction rather than making speculative production changes.

When would increasing a PHP-FPM timeout be an acceptable response?

It may be an acceptable temporary mitigation when evidence shows that valid work is being terminated just before completion and the longer duration will not exhaust workers, memory, or upstream timeouts. I would first inspect the complete timeout chain across the proxy, web server, PHP-FPM, application, database, and external services. I would monitor queue length, active workers, memory, latency, and error rate after the change. The permanent fix must still address the slow query, blocked dependency, capacity problem, or incorrect timeout design.

79. How do you find the cause of an undefined variable or undefined array key warning?DebuggingMedium

Question Details

Trace the input and control flow, distinguish missing from null values, inspect conditional initialization, validate external data, and fix the root cause rather than suppressing the warning.

Short Interview Answer (30-60 seconds)

I reproduce the warning, start from its file and line, and trace backward to where the value should be assigned. I check every conditional path and validate external input. For arrays, I distinguish a missing key from a null value, fix the invalid assumption, and add a regression test.

Detailed Explanation

See the Code while reading this explanation.

This warning means the program tried to use information that had not been prepared or supplied. I first make the problem happen again and record exactly where it appears. Then I follow the path taken by that information and check every decision that could have skipped its creation. I also confirm whether incoming information was missing, incomplete, or shaped differently from what the program expected. The correct goal is not to hide the message. It is to repair the earlier step that allowed missing information to reach this point and prove that the same case now works safely.

Useful clarifying questions:

Useful Questions to Ask the Interviewer
  • Does the warning occur for every request or only for particular input?
  • Is the value created internally or received from a request, file, database, cache, or external service?
  • Is the value required, optional, or allowed to be null?
  • Does the warning occur in every environment or only in one configuration?
How do you find the cause of an undefined variable or undefined array key warning? diagram
How to Explain It in an Interview

I begin by reproducing the warning with the smallest input and control-flow path that still causes it. I record the warning text, file, line, PHP version, SAPI, environment, request identifier, and safe contextual information. In PHP 8.4 and PHP 8.5, reading an undefined variable or undefined array key produces an E_WARNING. A warning normally allows execution to continue, so I investigate the warning and logs rather than expecting an exception or Error object.

For an undefined variable, I find the first place where the variable is read and trace backward to every possible assignment. I inspect if, elseif, switch, and match paths, loops that may execute zero times, early returns, failed operations, exception paths, and function or closure scope boundaries. The usual cause is that at least one path reaches the read before the variable has been assigned.

For an undefined array key, I inspect the array immediately before the failing access and confirm its actual keys, value types, source, and expected contract. I avoid recording passwords, access tokens, personal information, or complete production payloads. Safe diagnostics can include expected key names, present key names, value types, a correlation identifier, and the branch that executed.

I then distinguish absence from null. isset($data['name']) returns false when name is absent and also when it exists with the value null. array_key_exists('name', $data) returns true when the key exists, even if its value is null. I use array_key_exists() when missing and null have different meanings. It checks only the specified level, so nested data must be validated one level at a time or with a dedicated validator.

Next, I classify the value as required, optional, or nullable. Required external data should be validated when it enters the application and should produce a controlled validation failure when it is missing or invalid. Optional data may receive an intentional default. Nullable data may contain null, but the key may still be required when the contract distinguishes null from absence.

The null coalescing operator, such as $name = $data['name'] ?? 'Guest';, does not emit an undefined-key warning. However, it treats a missing key and a null value the same way. I use it only when both cases are valid and the fallback is part of the intended contract. Adding ?? everywhere can conceal malformed input or an upstream defect.

I fix the earliest incorrect assumption. The fix may be to initialize a variable before branching, assign it in every valid branch, return early for an invalid state, validate a required key, correct the code producing the array, or explicitly support an optional value. Using @, reducing error_reporting, or adding a meaningless default only hides evidence and is not a root-cause fix.

In development and automated tests, I report E_ALL so warnings are visible. In production, I keep errors out of the user response, log them through the configured logging system, sanitize context, and control log volume. Runtime configuration can differ between CLI, PHP-FPM, Apache, containers, and test runners, so I compare the PHP version, loaded configuration, environment variables, request shape, deployed code, extensions, and SAPI when the issue occurs in only one environment.

Finally, I repeat the exact failing case and test normal input, missing keys, present null values, invalid types, empty values, and every relevant branch. I confirm that no new warning appears and that the chosen behavior matches the data contract. I then add a regression test for the failing path and, where useful, static analysis or array-shape documentation to detect similar defects earlier.

Key Insight / Why This Solution Works
  1. Reproduce the warning with the smallest reliable input and control-flow path.
  2. Record the warning text, file, line, PHP version, SAPI, environment, and safe request context.
  3. Inspect the variable or array immediately before the failing read.
  4. Trace backward to every place where the value should be assigned or the array should be created.
  5. Check conditional branches, zero-iteration loops, early returns, failed operations, exception paths, and scope boundaries.
  6. Identify whether the data is internal or received from an external source.
  7. For arrays, determine whether the key is absent, present with null, or present with an invalid type.
  8. Define the contract: required, optional, or nullable.
  9. Fix the earliest invalid assumption instead of suppressing the warning.
  10. Verify the original case, normal cases, missing-input cases, null cases, invalid types, and environment differences.
  11. Add a focused regression test and, when useful, boundary validation, static analysis, or array-shape documentation.
Code
<?php

declare(strict_types=1);

error_reporting(E_ALL);

/**
 * @param array<string, mixed> $input
 * @return array{email: string, middleName: ?string, displayName: string}
 */
function buildUserProfile(array $input): array
{
    if (!array_key_exists('email', $input) || !is_string($input['email'])) {
        throw new InvalidArgumentException(
            'The required email key is missing or is not a string.'
        );
    }

    $email = trim($input['email']);

    if ($email === '' || filter_var($email, FILTER_VALIDATE_EMAIL) === false) {
        throw new InvalidArgumentException('The email value is invalid.');
    }

    if (!array_key_exists('middle_name', $input)) {
        throw new InvalidArgumentException(
            'The middle_name key must be present, even when its value is null.'
        );
    }

    $middleName = $input['middle_name'];

    if ($middleName !== null && !is_string($middleName)) {
        throw new InvalidArgumentException(
            'The middle_name value must be a string or null.'
        );
    }

    if (is_string($middleName)) {
        $middleName = trim($middleName);
    }

    $displayNameValue = $input['display_name'] ?? $email;

    if (!is_string($displayNameValue)) {
        throw new InvalidArgumentException(
            'The display_name value must be a string when provided.'
        );
    }

    $displayName = trim($displayNameValue);

    if ($displayName === '') {
        $displayName = $email;
    }

    return [
        'email' => $email,
        'middleName' => $middleName,
        'displayName' => $displayName,
    ];
}

/**
 * @param array<string, mixed> $input
 */
function logInputShape(array $input): void
{
    $types = [];

    foreach ($input as $key => $value) {
        $types[$key] = get_debug_type($value);
    }

    error_log(
        'User payload structure: ' . json_encode(
            $types,
            JSON_THROW_ON_ERROR
        )
    );
}

$input = [
    'email' => 'developer@example.com',
    'middle_name' => null,
];

try {
    logInputShape($input);
    $profile = buildUserProfile($input);

    echo json_encode(
        $profile,
        JSON_PRETTY_PRINT | JSON_THROW_ON_ERROR
    ), PHP_EOL;
} catch (InvalidArgumentException $exception) {
    fwrite(STDERR, $exception->getMessage() . PHP_EOL);
    exit(1);
}
Why Interviewers Ask This

The interviewer is testing whether the candidate can investigate PHP warnings using evidence, trace data and control flow, distinguish missing values from null values, validate external data, identify environment-specific causes, and correct the root cause instead of hiding the warning with suppression or an unjustified default.

Common interview mistakes

Common mistakes include suppressing the warning with @; lowering error reporting; reading a key before validating the array; adding ?? without deciding whether missing and null should mean the same thing; assuming isset() can distinguish absence from null; using array_key_exists() on the outer array and assuming that it validates nested keys; initializing a variable with a meaningless value only to silence the warning; inspecting only the failing line instead of the earlier producer and control flow; forgetting that a loop may run zero times; confusing function scope with block scope; trusting request, database, cache, or service data without validation; logging complete sensitive payloads; testing only the successful branch; and fixing one consumer while leaving the upstream data contract incorrect.

Interview tip

Present a clear sequence: reproduce the warning, capture safe evidence, inspect the failing read, trace assignments and branches backward, distinguish missing from null, define the data contract, fix the earliest invalid assumption, and verify with edge cases and a regression test. State explicitly that suppression and unjustified defaults are not root-cause fixes.

Interviewer may ask next
What is the difference between isset() and array_key_exists() when checking an array key?

isset($array['key']) returns false both when the key is absent and when it exists with a null value. array_key_exists('key', $array) returns true when the key exists, including when its value is null. I use array_key_exists() when absence and null have different meanings, and isset() when both may be treated as unavailable.

When is the null coalescing operator an appropriate fix for an undefined array key warning?

It is appropriate when the field is genuinely optional, a missing key and a null value intentionally have the same meaning, and the fallback is part of the documented behavior. It is not appropriate when the key is required, when null differs from absence, or when the fallback would hide malformed upstream data. Required input should be validated and rejected in a controlled way.

80. How would you diagnose a PHP request that hangs until timeout?DebuggingMedium

Question Details

Explain how to identify blocking database calls, HTTP calls, file or session locks, infinite loops, DNS delays, deadlocks, and resource exhaustion using logs, traces, timeouts, and process inspection.

Short Interview Answer (30-60 seconds)

I would reproduce the timeout, narrow its scope, identify which layer ends the request, and add request-level timing evidence. Then I would inspect PHP workers, database calls, HTTP calls, locks, loops, DNS, deadlocks, and resource usage. I would mitigate safely, fix the proven cause, and verify it.

Detailed Explanation

This question asks how I would find why a web request starts but does not finish before its allowed waiting time ends. I should not guess or immediately increase the limit. I should first learn which requests fail, where they fail, and whether the problem happens every time or only under certain conditions. Then I should collect proof showing the last successful step and what the request is waiting for. I should correct the confirmed cause, repeat the original test, and add protection so the same problem is found earlier or does not return.

Useful clarifying questions:

Useful Questions to Ask the Interviewer
  • Does the timeout affect one endpoint, one server, one user session, or all requests?
  • Is it constant or intermittent, and when did it begin?
  • Which component reports the timeout: the client, load balancer, reverse proxy, web server, PHP-FPM, application, database, or another service?
  • Were there recent deployments, configuration changes, traffic increases, or dependency incidents?
  • Can the request be reproduced safely with production-like data and dependencies?
How would you diagnose a PHP request that hangs until timeout? diagram
How to Explain It in an Interview

I would use an evidence-first process and begin with the smallest diagnostic step that can divide the problem into smaller areas.

1. Reproduce the failure and define its scope

I would reproduce the hanging request safely and record the endpoint, sanitized input shape, user or session conditions, server, PHP SAPI, PHP-FPM pool when applicable, environment, start time, and observed timeout duration.

I would compare:

  • Affected and unaffected endpoints.
  • Affected and unaffected servers or containers.
  • Authenticated and unauthenticated requests.
  • Requests using the same session and different sessions.
  • Small and large inputs.
  • Production and non-production environments.
  • Requests before and after a recent deployment or configuration change.

This identifies whether the failure is tied to application code, a particular host, shared state, input size, traffic, or an environment difference.

2. Identify the timeout layer

A request can be ended by the client, load balancer, reverse proxy, web server, PHP-FPM, an application-level deadline, a database timeout, or an HTTP client timeout. I would determine which component closes the request first and compare its deadline with the other configured limits.

I would not assume that PHP's max_execution_time explains the observed wall-clock duration. On non-Windows systems, time spent in many system calls, stream operations, database work, or other blocking operations may not be counted in the same way as PHP execution time. PHP-FPM can also enforce request_terminate_timeout independently. Therefore, I would inspect the actual SAPI and platform configuration instead of relying on one PHP setting.

Increasing a timeout may hide the symptom, occupy workers for longer, and increase queueing. It is not the first diagnostic action.

3. Add correlation and timing evidence

I would assign a unique request ID and include it in structured application logs, proxy logs, PHP-FPM logs, database metadata where safely supported, and outgoing HTTP headers when appropriate.

I would add monotonic elapsed-time measurements around major boundaries such as:

  • Request routing and middleware.
  • Authentication and authorization.
  • session_start() and session release.
  • Database connection and individual queries.
  • External HTTP calls.
  • DNS-dependent connection attempts.
  • Cache, queue, filesystem, and lock operations.
  • Template rendering or response serialization.

A monotonic clock is appropriate for measuring durations because wall-clock adjustments should not make an operation appear to take a negative or inaccurate amount of time.

The logs must not expose passwords, tokens, cookies, personal data, complete request bodies, database credentials, or sensitive production paths. I would keep display_errors disabled in production and send diagnostic details to protected logs or an error-monitoring system.

Exceptions, PHP Error objects, warnings, logs, traces, profiler samples, and database evidence are different forms of evidence. An exception or Error shows that execution failed. A warning may reveal a related problem but does not necessarily stop execution. A trace shows where time was spent across components. A profiler shows frequently executing PHP code. Database-side tools show what the database session is actually doing.

4. Determine whether the worker is computing or waiting

I would inspect the affected PHP process while the request is hanging.

If the process continuously consumes high CPU, I would investigate:

  • Infinite or extremely long loops.
  • Recursion without a reachable base case.
  • Unbounded retry logic.
  • Pathological regular-expression behavior.
  • Large serialization, parsing, sorting, or transformation work.
  • Algorithms whose runtime grows badly with input size.

If the process uses little CPU and remains blocked, I would investigate:

  • Database queries or lock waits.
  • HTTP connections or response reads.
  • DNS resolution.
  • Session or file locks.
  • Filesystem or network storage.
  • Queue or cache operations.
  • Resource acquisition, such as a database connection.

A PHP profiler is most useful when PHP code is actively consuming CPU. A distributed trace, PHP-FPM slow log, process stack sample, operating-system inspection, or dependency-side evidence is usually more useful when the worker is waiting.

5. Inspect PHP-FPM and request capacity

When PHP-FPM is used, I would inspect:

  • Active and idle workers.
  • The listen queue and maximum queue length.
  • Whether pm.max_children has been reached.
  • Slow-request log output.
  • request_slowlog_timeout and request_terminate_timeout settings.
  • Worker memory usage and recycling behavior.
  • Whether one route or dependency is occupying many workers.

A request may appear to hang before its PHP code begins because it is waiting in the PHP-FPM listen queue. Increasing pm.max_children without checking available memory, CPU, downstream capacity, and per-worker memory can cause swapping, database overload, or a larger failure. Capacity changes must be based on measurements.

If another SAPI is used, I would inspect the equivalent worker, thread, event-loop, or process model rather than applying PHP-FPM assumptions.

6. Inspect database calls

I would correlate the request time with database-side activity and look for:

  • A long-running query.
  • A query waiting for a row, table, metadata, or advisory lock.
  • A transaction left open longer than expected.
  • A deadlock, deadlock retry, or lock timeout.
  • A missing or unsuitable index.
  • A query plan that scans or sorts much more data than expected.
  • Exhausted database connection limits.
  • A connection attempt waiting on DNS, networking, TLS, or authentication.

Application timing shows that PHP entered a database operation, but database-side evidence shows whether the session is executing, blocked, idle in a transaction, or absent because connection establishment never completed.

I would inspect the database's active-session view, lock-wait information, deadlock records, slow-query facilities, execution plan, transaction age, and connection counts. The exact commands depend on the selected database and driver.

I would configure explicit connection, statement, and lock deadlines where the database, extension, and application architecture support them. I would not claim that all PHP database drivers expose the same timeout options.

The durable fix may be an index, a corrected query, smaller result set, shorter transaction, consistent lock order, bounded retry, corrected connection handling, or capacity change supported by evidence.

7. Inspect outgoing HTTP calls

An external request can wait during:

  • DNS lookup.
  • TCP connection establishment.
  • TLS negotiation.
  • Request upload.
  • Response headers.
  • Response-body transfer.
  • Redirect handling.
  • Retry delays.

I would capture destination category, start time, elapsed time, HTTP status when available, error type, retry count, and client timing metrics without logging secrets or sensitive query parameters.

The HTTP client should use explicit connection and total deadlines. Depending on the client, separate read or inactivity deadlines may also be available. I would verify the behavior of the actual client, such as the cURL extension or a Composer package, rather than assuming all clients use identical options.

I would also check whether redirects, retry middleware, sequential service calls, or large response bodies make the total duration exceed the request deadline. Each individual attempt may be bounded while the combined operation is still too long.

A temporary workaround could fail fast, use safe cached data, disable a non-essential integration, or move non-interactive work to a background job. The root-cause fix may require correcting the dependency, request shape, retry budget, timeout policy, fallback design, or connection configuration.

8. Inspect session locks

With PHP's standard file-based session handler, session_start() normally obtains an exclusive lock for that session. Concurrent requests using the same session can therefore run serially. A long request that keeps the session open can make another request from the same user wait at session_start().

I would confirm this by:

  • Adding timing immediately before and after session_start().
  • Sending concurrent requests with the same session identifier.
  • Comparing them with requests that use different sessions.
  • Recording when session_write_close() occurs.

After the request finishes updating session data, I would release the lock early with session_write_close(). I would not release it before all required writes are complete, because later changes to the in-memory session data would not automatically be persisted by that closed session.

Alternative session handlers may have different locking behavior, so I would verify the configured handler instead of assuming file locking in every environment.

9. Inspect file locks and application mutexes

I would inspect flock() usage, cache locks, queue locks, framework mutexes, distributed locks, and temporary-file coordination.

For each lock, I would determine:

  • Which process owns it.
  • Which process is waiting.
  • How long it has been held.
  • Whether the owner is still alive.
  • Whether all error paths release it.
  • Whether multiple locks are acquired in a consistent order.
  • Whether the wait has a bounded deadline.

An application deadlock can occur when one worker holds lock A and waits for lock B while another holds lock B and waits for lock A. A durable fix can include consistent acquisition order, smaller critical sections, reliable finally-based release, bounded waiting, fencing or ownership checks for distributed locks, and idempotent retry behavior.

10. Inspect infinite loops and unbounded work

For a CPU-bound request, I would inspect stack samples or profiler output and compare runtime against input size. I would verify that:

  • Every loop condition can eventually become false.
  • Pagination advances and detects the final page.
  • Recursive calls reach a base case.
  • Retry loops have maximum attempts and a total time budget.
  • Stream-reading loops handle end-of-file, empty reads, and errors correctly.
  • Data structures are not growing without a bound.

Raising max_execution_time is not a root-cause fix for an infinite loop. I would correct the termination or progress condition, bound the input or work, and add a regression test using the triggering case.

11. Inspect DNS and connection establishment

A request may hang before an external server receives any traffic because name resolution or connection establishment is delayed.

I would measure or separate:

  • DNS lookup time.
  • TCP connection time.
  • TLS negotiation time.
  • Time to first response byte.
  • Response transfer time.

I would test from the same server, container, network namespace, and PHP runtime environment as the failing request. A successful lookup from a developer laptop does not prove that production resolver configuration is healthy.

I would inspect resolver configuration, unreachable name servers, search-domain behavior, service discovery, IPv4 and IPv6 paths, container DNS, network policy, and recent infrastructure changes.

Hard-coding an IP address may be useful for a tightly controlled diagnostic comparison, but it is generally not a durable fix because addresses can change, load balancing can be bypassed, and TLS certificate validation normally depends on the hostname.

12. Inspect deadlocks and blocking beyond the database

I would distinguish a database deadlock from a general lock wait and from an application-level deadlock.

A database deadlock is normally detected by the database, which aborts one participant so the application can handle or retry it. A lock wait may instead continue until the lock is released or a lock deadline is reached. An application deadlock involving files, distributed locks, subprocess pipes, or other resources may not be detected automatically.

I would collect evidence showing the owners, waiters, resources, and acquisition order before changing retry behavior. Blind retries can increase load and repeat the same deadlock when the ordering problem remains.

13. Inspect resource exhaustion

I would correlate the request period with:

  • CPU saturation or throttling.
  • Memory usage, memory limits, swapping, and out-of-memory termination.
  • Disk capacity, inode capacity, and disk latency.
  • Open file-descriptor and socket limits.
  • Database connections and server-side connection limits.
  • PHP-FPM worker and queue saturation.
  • Network connection limits and ephemeral-port pressure.
  • Container limits.
  • Cache, queue, or downstream-service saturation.

Resource exhaustion can produce both active and blocked failures. For example, CPU saturation can slow all workers, while a full PHP-FPM pool can leave new requests waiting in a queue. Severe memory pressure may cause swapping, termination, or repeated worker restarts rather than a clean PHP memory-limit error.

I would not make an exact performance or memory claim without measurements from the affected environment. Adding workers or raising limits is a possible mitigation only after confirming available capacity and downstream tolerance.

14. Separate workaround from root-cause fix

A workaround reduces immediate impact but may not remove the cause. Examples include:

  • Lowering an external-call deadline so workers fail faster.
  • Temporarily disabling a non-essential integration.
  • Serving safe cached data.
  • Releasing a session lock earlier.
  • Routing traffic away from an unhealthy instance.
  • Reducing traffic or concurrency.
  • Restarting a stuck worker after collecting sufficient evidence.

A root-cause fix removes the confirmed source of the hang. Examples include:

  • Correcting a loop or retry condition.
  • Adding the appropriate database index.
  • Shortening a transaction.
  • Fixing lock acquisition order.
  • Correcting DNS or network configuration.
  • Bounding an HTTP operation and its total retry budget.
  • Closing or releasing leaked resources.
  • Correcting PHP-FPM capacity based on measured worker memory and downstream capacity.

I would clearly state which action is temporary and which is permanent.

15. Verify the fix and prevent regression

After applying the correction, I would repeat the original request under the same relevant conditions and verify:

  • The request completes within its expected service target.
  • The correct component, not merely the client, reports successful completion.
  • The previously blocked query, call, lock, lookup, or loop now progresses normally.
  • PHP-FPM workers and queues return to healthy levels.
  • CPU, memory, connections, file descriptors, and disk behavior remain acceptable.
  • No new exceptions, Error objects, warnings, failed session writes, or resource leaks appear.
  • Concurrent and dependency-failure cases behave safely.

I would then add the most useful prevention mechanism, such as:

  • A regression test for the triggering input.
  • An integration test with a deliberately slow dependency.
  • A test for timeout and retry budgets.
  • A same-session concurrency test.
  • A database lock-contention or query-performance test.
  • Request-duration and dependency-latency monitoring.
  • Alerts for PHP-FPM queueing, worker saturation, database lock waits, DNS failures, or resource exhaustion.

The main interview point is that I would not diagnose a hanging request by guessing or by simply increasing timeouts. I would determine where the time is spent, distinguish active computation from blocking, gather evidence from both PHP and its dependencies, correct the confirmed cause, and verify that the failure does not return.

Technical Approach
  1. Reproduce the request safely and record the exact conditions.
  2. Determine whether the issue affects one endpoint, host, environment, session, input type, or all traffic.
  3. Identify which client, proxy, web server, PHP runtime, database, or dependency deadline ends the request.
  4. Add a correlation ID and monotonic timing around each major operation without logging sensitive data.
  5. Determine whether the PHP process is actively using CPU or waiting on another resource.
  6. Inspect the PHP SAPI and, when applicable, PHP-FPM workers, queues, slow logs, and termination settings.
  7. Inspect database sessions, queries, plans, transactions, lock waits, deadlocks, and connection limits.
  8. Inspect HTTP calls, redirects, retry budgets, DNS lookup, connection setup, TLS, and response timing.
  9. Test for session locks, file locks, distributed locks, and inconsistent lock ordering.
  10. Inspect loops, recursion, stream reads, pagination, regular expressions, retries, and input-dependent work.
  11. Check CPU, memory, disk, file descriptors, sockets, ports, workers, and downstream capacity.
  12. Apply a safe workaround only when necessary, then implement the evidence-backed root-cause fix.
  13. Repeat the original scenario, verify normal behavior at every affected layer, and add monitoring or regression tests.
Practical Insights

The investigation adds temporary processing, storage, and operational cost. Timing logs and traces use some CPU, memory, network bandwidth, and log storage, so detailed collection should be limited, sampled, or enabled only for selected requests in busy production systems. Profiling can add more overhead and should be used carefully. The amount of investigation grows with the number of boundaries involved, such as PHP workers, databases, HTTP services, DNS, files, locks, and infrastructure. No exact performance or memory cost can be claimed without measurement. Long-term maintenance becomes easier when the system already has request IDs, structured logs, explicit dependency deadlines, slow-request evidence, dashboards, and alerts.

Why Interviewers Ask This

Interviewers ask this question to evaluate whether the candidate can investigate a stuck PHP request systematically instead of guessing. A strong answer demonstrates knowledge of PHP execution environments, PHP-FPM worker behavior, database and network blocking, session and file locks, infinite loops, DNS delays, deadlocks, resource exhaustion, safe production diagnostics, timeout boundaries, root-cause correction, verification, and regression prevention.

Common interview mistakes

Common mistakes include increasing max_execution_time or proxy deadlines before locating the blocked operation; assuming max_execution_time always measures the full wall-clock request duration on every platform and SAPI; enabling display_errors in production; suppressing warnings instead of investigating them; logging secrets or complete production payloads; changing several components at once; testing only from a developer laptop; ignoring the timeout enforced by a proxy, web server, PHP-FPM, database, or HTTP client; assuming every hang is a slow query; overlooking same-session locking; treating every database wait as a deadlock; using external calls without explicit deadlines; allowing redirects and retries to exceed the total request budget; profiling a process that is blocked instead of inspecting its wait state; increasing PHP-FPM workers without measuring memory and downstream capacity; restarting workers before collecting useful evidence; confusing a workaround with a permanent fix; and failing to repeat the original scenario after the correction.

Interview tip

Present the answer as a narrowing process: reproduce, scope, identify the timeout layer, correlate, measure, distinguish CPU work from waiting, inspect each blocking boundary, mitigate safely, fix the proven cause, and verify prevention. Explicitly mention database calls, HTTP calls, session and file locks, loops, DNS, deadlocks, PHP-FPM saturation, and resource limits.

Interviewer may ask next
How would you confirm that PHP session locking is causing concurrent requests from the same user to hang?

I would add timing immediately before and after session_start(), then send concurrent requests using the same session identifier and compare them with requests using different sessions. If the second same-session request waits until the first request calls session_write_close() or ends, that is strong evidence of session-lock contention. I would verify the configured session handler because not every handler uses the same locking behavior. After all required session updates are complete, I would release the lock early with session_write_close(), repeat the concurrency test, and confirm that required session data is still persisted correctly.

What would you do if lowering an external HTTP timeout stops the PHP request from hanging but causes more failed responses?

I would treat the shorter timeout as a protective workaround rather than the complete fix. I would measure DNS, connection, TLS, response-header, body-transfer, redirect, and retry time using the actual HTTP client. I would then determine whether the dependency is unavailable, consistently slow, receiving an inefficient request, or being retried beyond the request's total deadline. The durable design could use a bounded retry budget, cached or partial data, asynchronous processing for non-interactive work, a safe fallback, or a corrected dependency. I would verify both request duration and user-visible reliability under normal and failure conditions.

More questions load as you scroll

Disclaimer: This interview guide is for educational and informational purposes only. It is designed to help readers prepare, but it does not guarantee any interview result, hiring decision, offer, or outcome. Interview questions, hiring criteria, and preferred answers can vary by employer, interviewer, industry, location, and time. The examples and explanations reflect the authors' research and judgment, are provided without warranties of any kind, and should not be treated as the only correct approach. Diagrams are simplified illustrations intended to highlight the main components and their interactions; actual systems and implementations may be more complex. Alternative approaches may be equally valid or better suited to a particular question, context, or interviewer. To the fullest extent permitted by applicable law, the author, contributors, and publisher are not liable for decisions made, actions taken, or losses incurred based on this guide.