This interview guide is for educational and informational purposes only. It is designed to help readers prepare, but it does not guarantee any interview result, hiring decision, offer, or outcome. Interview questions, hiring criteria, and preferred answers can vary by employer, interviewer, industry, location, and time. All answers, examples, and explanations in this guide are suggested examples for interview preparation, not definitive answers or instructions for professional practice. They are based on research and judgment, are provided without warranties of any kind, and should be adapted to the question, role, and applicable laws and professional requirements. Diagrams are simplified illustrations intended to highlight the main concepts and their relationships; actual situations, systems, and practices may be more complex. Alternative approaches may be equally valid or better suited to a particular question, context, or interviewer. To the fullest extent permitted by applicable law, the contributors and publisher are not liable for decisions made, actions taken, or losses incurred based on this guide.
State Laws and Professional Responsibilities
Laws and requirements governing an occupation vary by state and jurisdiction. You are responsible for checking the current laws, licensing requirements, and scope-of-practice rules that apply to your location and role, and for ensuring that your answers and actions comply with them. Adapt examples in this guide to those requirements. This guide is not legal advice.
Identity, Image, and Privacy Notice
To respect individual privacy, some names, profile photographs, avatars, biographical details, and other identifying information displayed in this guide may be replaced with pseudonyms, licensed stock images, illustrative avatars, composite images, or representative descriptions. Unless a person is expressly identified as an actual contributor, a displayed name, image, or profile should not be understood as depicting or identifying a specific candidate, interviewer, employee, or other real individual. These representations are provided for editorial and illustrative purposes only and do not imply endorsement, employment, participation, or affiliation with this guide or any company mentioned in it. Any resemblance to an actual person is coincidental.
Company Notice
This guide is an independent educational resource and is not affiliated with, endorsed by, sponsored by, or approved by the company named in this guide. Company names identify reported interview experiences or the employer context of clearly labeled original practice exercises. Interview practices can change without notice, and inclusion of company-specific content does not mean these questions are official, complete, or guaranteed to be asked. To the fullest extent permitted by law, the author, contributors, and publisher are not responsible for outcomes related to use of this material.
Content Accuracy and Verification
To the fullest extent permitted by applicable law, we do not represent or warrant that interview guides, questions, answers, examples, or diagrams are accurate, complete, current, error-free, or suitable for any particular purpose. You are responsible for independently reviewing and verifying the information before relying on it.
Questions or comments?
Contact us for general questions, or share feedback, technical corrections, and comments with the community.
121. What is the difference between Dispose() and Finalize() from a memory-pressure perspective?Performance And ScalingEasy
i Question Details
Contrast deterministic cleanup with finalizer-based cleanup and explain why relying on finalization can delay resource release.
Short Interview Answer (30-60 seconds)
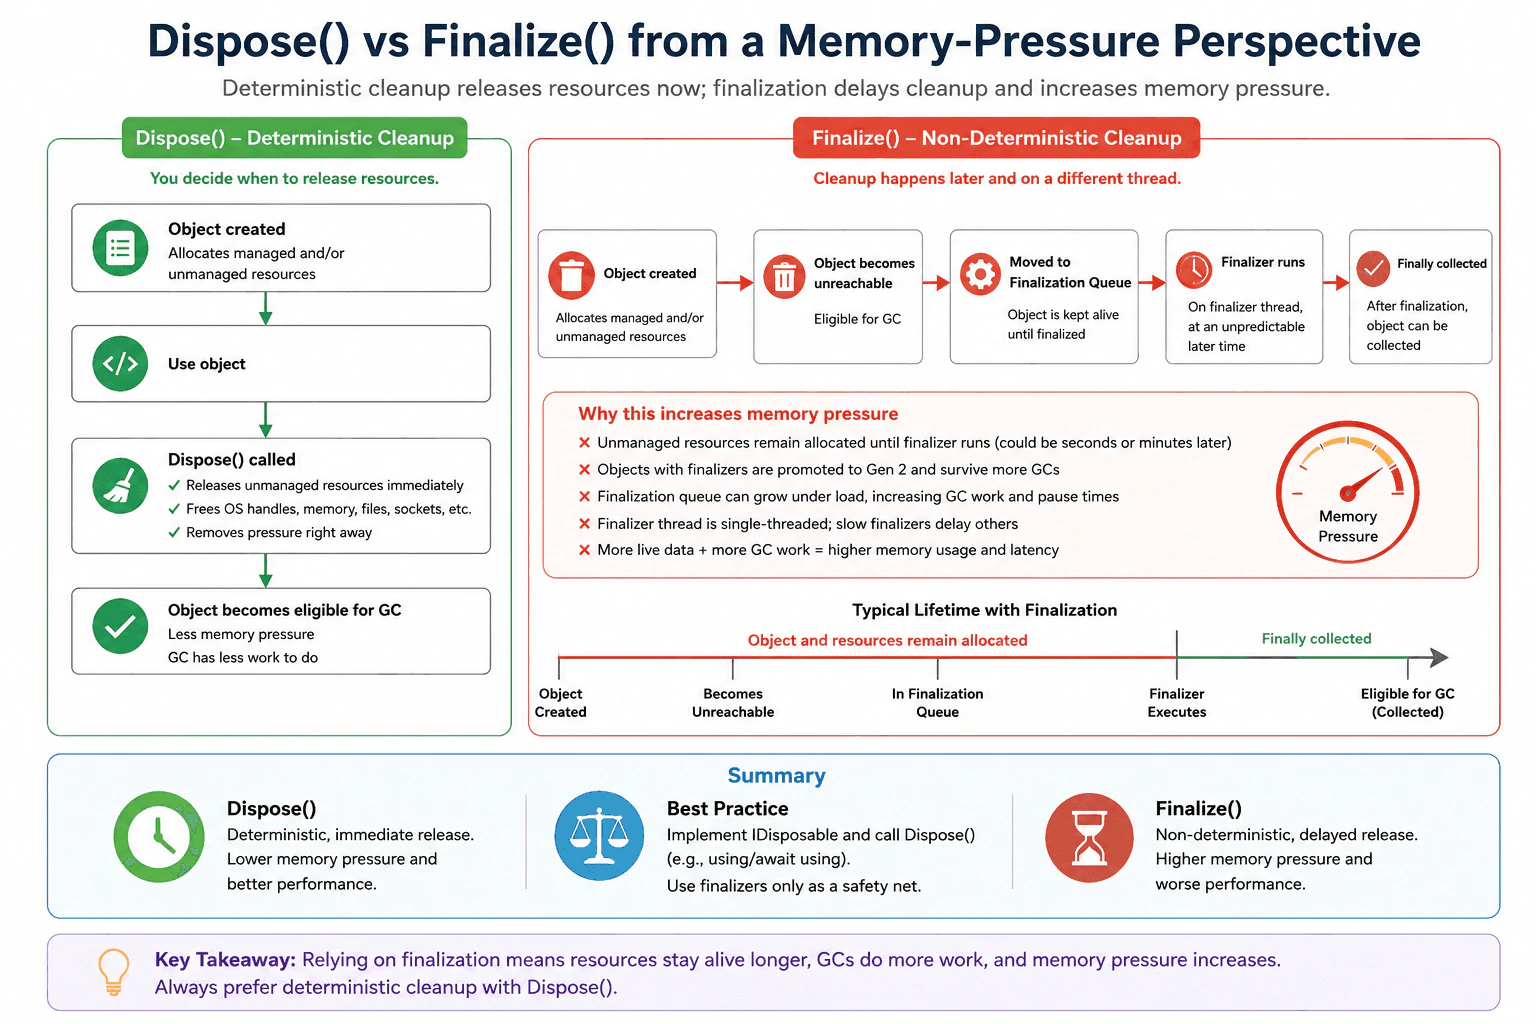
Dispose() is deterministic cleanup. You call it when you are done, so unmanaged resources are released right away and memory pressure drops sooner. Finalize() is a backup path that runs later through the GC, so resources can stay alive longer and the GC has more work to do.
Detailed Explanation
Dispose() means your code lets go of things right away. Finalize() means the system lets go of them later. When you wait for Finalize(), the object can stay alive longer, and memory, handles, and other resources can stay in use longer too. That adds more pressure to memory and can slow cleanup. The app may also keep wasteful objects around for another GC cycle. So Dispose() is the normal choice when you know you are finished, and Finalize() is only a backup when cleanup was missed.
Useful Questions to Ask the Interviewer
Does this class own files, sockets, or database connections?
Should callers use using or await using?
How to Explain It in an Interview
Dispose() is deterministic cleanup. You call it when the object is done. It can close unmanaged resources now and it can also call GC.SuppressFinalize(this) so the finalizer is skipped. That lowers memory pressure because the object can be collected sooner and the GC has less extra work.
Finalize() is not deterministic. The object first becomes unreachable, then it waits on the finalizer queue, then the finalizer thread runs later. Until that happens, the object and any resources it still holds can stay alive longer. That may push more objects into later GC cycles and raise memory use. So in most code, use IDisposable with using or await using, and keep a finalizer only as a safety net for unmanaged resources.
Technical Approach
Check whether the object owns unmanaged resources.
Implement IDisposable and call Dispose as soon as work is done.
Use using or await using at call sites.
Add a finalizer only if Dispose can be missed and unmanaged cleanup is still required.
Practical Insights
Dispose has low and predictable cost because cleanup happens when you call it. Finalize adds extra GC work because objects must wait for the finalizer queue and usually live longer. The practical cost is more memory pressure, more GC work, and slower resource release.
Why Interviewers Ask This
Interviewers ask this to see whether you understand deterministic cleanup, delayed cleanup, and how finalization can increase memory pressure by keeping resources alive longer.
Common interview mistakes
Treating Finalize as the same as Dispose.
Relying on finalizers for normal cleanup.
Forgetting to call Dispose from using or await using.
Assuming finalization releases resources right away.
Adding a finalizer when the type only owns managed resources.
Interview tip
Say that Dispose is the normal path because it releases resources now, while Finalize is only a backup path that can delay release and increase memory pressure.
Interviewer may ask next
What happens if a class has a finalizer but Dispose is never called?
The object can survive longer because it must wait for the finalizer queue and the finalizer thread. That delays resource release, increases memory pressure, and can add more GC work. The exact impact depends on how many objects are waiting and what resources they hold.
Should every disposable class also have a finalizer?
No. A finalizer is only needed when the class directly owns unmanaged resources that might not be released otherwise. If the class only wraps managed disposable objects, Dispose is usually enough. A finalizer adds extra GC work and should be avoided unless it is truly needed.
122. What’s the difference between output caching, response caching, and HybridCache?Performance And ScalingMedium
i Question Details
Compare what gets cached, where the cache sits, and what kinds of repeated reads benefit from each option.
Short Interview Answer (30-60 seconds)
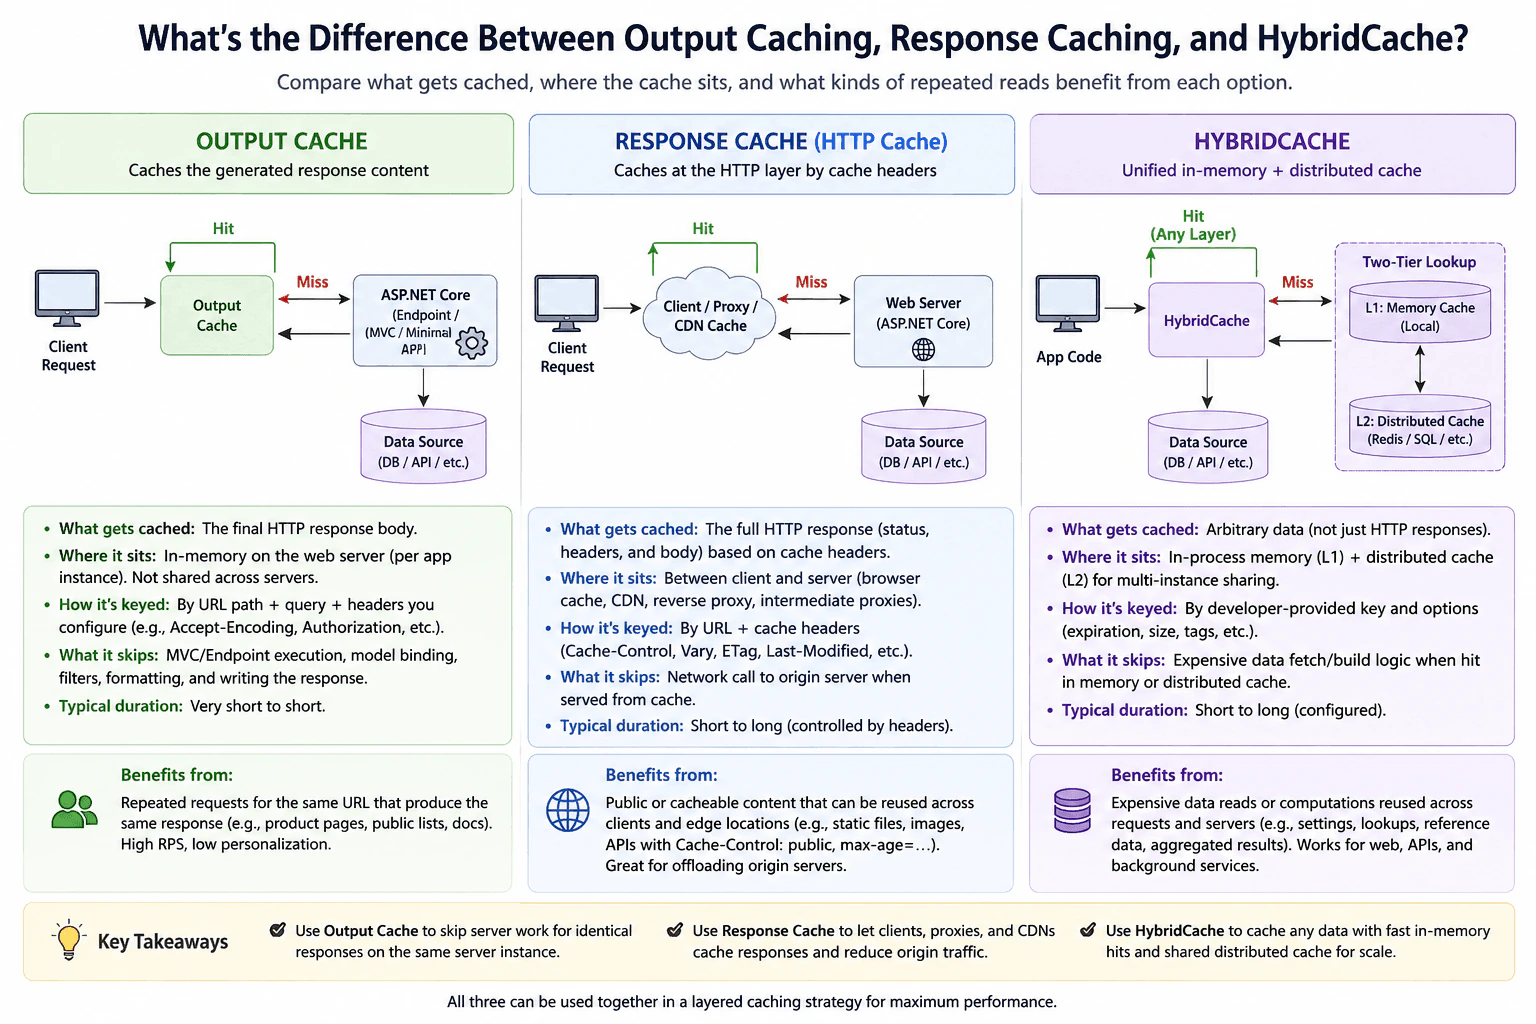
I would say output caching stores the final endpoint result inside the app, response caching stores the full HTTP response using cache headers at the client proxy or CDN layer, and HybridCache stores app data in memory first and can fall back to a shared cache. Output caching helps repeated identical endpoint hits, response caching helps public cacheable HTTP responses, and HybridCache helps repeated expensive data reads across requests and app instances.
Detailed Explanation
These three options all help repeated reads, but they sit in different places. Output caching saves the final result your app already produced, so the app can skip that work for the same request again. Response caching saves the whole HTTP response through cache rules, so browsers, proxies, or CDNs can reuse it without asking the app every time. HybridCache is for app data, not full responses. It keeps hot data in memory first and can also use a shared cache, so many app reads can reuse the same data safely and quickly.
Useful Questions to Ask the Interviewer
Is the data the same for every user, or does it change per user or per request?
Should the response be reused by the app only, or also by browsers, proxies, or CDNs?
Do multiple app instances need to share the same cached data?
How to Explain It in an Interview
Start by saying what is being reused. Output caching reuses the endpoint result inside the app. Response caching reuses the full HTTP response outside the app when cache rules allow it. HybridCache reuses application data or computed values, not the HTTP response itself.
Then explain where each one sits. Output caching is inside the ASP.NET Core app. Response caching sits at the HTTP layer, often in a client, proxy, or CDN. HybridCache sits in front of the data source and usually checks in process memory first, then a shared cache if needed.
Next explain the best fit. Output caching is good for repeated identical requests to the same endpoint. Response caching is good for public cacheable content. HybridCache is good for expensive data reads that many requests or many app instances repeat.
Finish with the tradeoff. The more public the response is, the more response caching helps. The more app specific the data is, the more output caching or HybridCache fits. The key is to match the cache layer to the kind of repeated read.
Technical Approach
Identify what is repeated.
Decide whether you want to cache a full HTTP response, a rendered endpoint result, or app data.
Pick the layer that matches the reuse pattern.
Check sharing, freshness, and user specific data before choosing the cache.
Practical Insights
Output caching is cheap for repeated same route hits because the app can skip endpoint work after the first response. Response caching is cheap for the origin server because clients, proxies, or CDNs can reuse the whole HTTP response, but it depends on cache rules and public content. HybridCache adds some key lookup cost, but it can save much more work when many requests reuse the same expensive data. The tradeoff is stale data, memory use, and the need to choose good keys and expiration.
Why Interviewers Ask This
Interviewers ask this to check whether you can tell apart three cache layers that solve different repeated read problems. They want to see if you know what gets cached, where the cache sits, and when each option helps performance. They also want to hear whether you can choose the right cache for the workload instead of treating all caches as the same thing.
Common interview mistakes
A common mistake is treating all three caches as the same thing. Output caching, response caching, and HybridCache sit in different layers and help different repeated reads. Another mistake is caching personalized or fast changing data without thinking about freshness or user identity. People also forget that response caching depends on cache rules, while HybridCache is for data and not for the full HTTP response. The last mistake is choosing a cache because it sounds fast instead of matching it to the workload.
Interview tip
Explain the layer first, then explain what is stored, then explain who reuses it. That makes the difference between output caching, response caching, and HybridCache very easy to follow.
Interviewer may ask next
When would output caching be a bad choice?
It is a bad choice when the response changes per user or depends on request details that should not be shared, because output caching stores the final endpoint result inside the app and can serve the wrong content if the key is too broad. That matters for personalized pages, security sensitive data, and fast changing results.
Can HybridCache replace response caching for public HTTP pages?
Not really. HybridCache caches application data, not the full HTTP response, so it does not sit at the browser, proxy, or CDN layer. It matters when you want reusable data behind multiple endpoints or app instances, but response caching is still better for public HTTP responses that should be reused outside the app. The tradeoff is that HybridCache gives app level control, while response caching can reduce origin traffic more broadly.
123. How do you tell whether database queries are the bottleneck?Performance And ScalingHard
i Question Details
Focus on the evidence you would check first, such as query timing, logging, and whether the slowdown scales with row count.
Short Interview Answer (30-60 seconds)
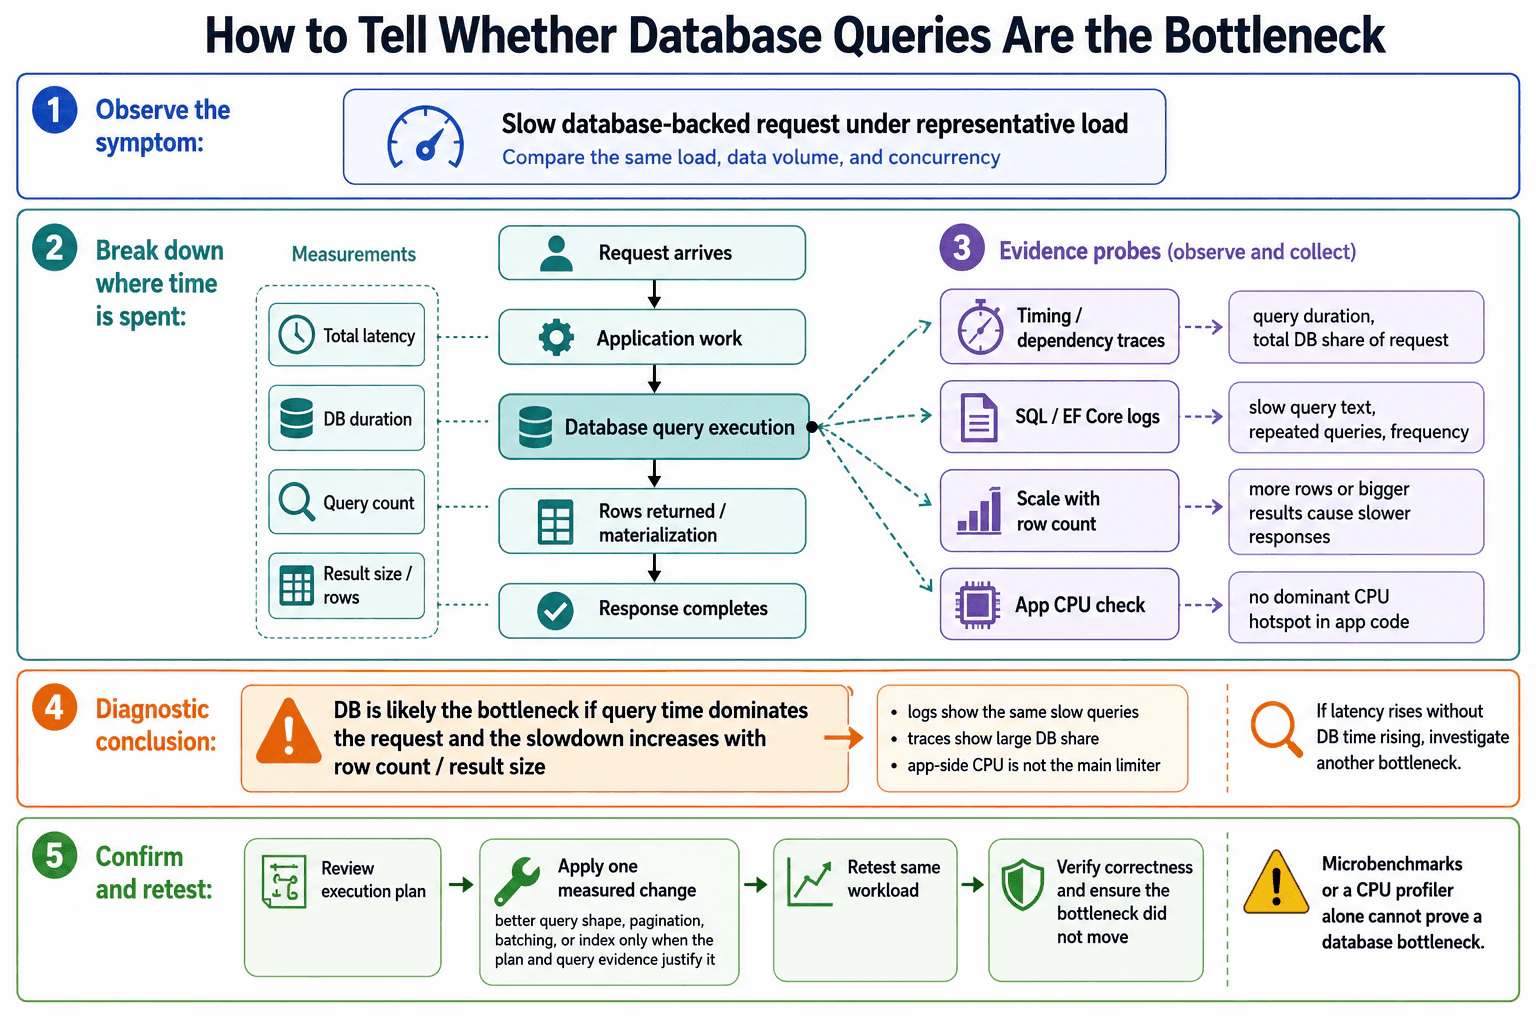
I first measure the whole request and separate application time from database time. Then I check query duration, the total database share of the request, SQL or EF Core logs, query count, result size, and whether latency grows as the row count grows. If database time dominates while application CPU stays relatively flat, the database is a strong bottleneck candidate. I then inspect the slow query and its execution plan, make one evidence based change, and retest with the same workload. A CPU profiler alone cannot prove a database bottleneck.
Detailed Explanation
I would start by measuring the slow request instead of guessing where the delay comes from. I want to know how long the complete request takes and how much of that time is spent waiting for stored data compared with work done inside the application. I would repeat the same test with similar traffic, data volume, payload size, and concurrency. I would also see whether the delay becomes worse when more records are returned. That gives me useful evidence before I decide which part of the system needs attention.
Useful Questions to Ask the Interviewer
Does the slowdown happen for every request or mainly when more rows are returned?
Can we see request timing and query logs from a representative environment?
Are we comparing the same traffic, payload size, data volume, and concurrency when reproducing the issue?
How to Explain It in an Interview
I would use the complete database backed request as the measurement boundary, from request arrival until the response completes. Inside that boundary, I separate application work from database query execution and from the work needed to return and materialize rows. This matters because a slow request does not automatically mean the C# code is slow.
The first evidence I would check is query timing. A dependency trace or equivalent request timing should show the duration of each database call and the total share of request time spent in database calls. If most of the request latency is inside those calls, that is strong evidence that the database path deserves deeper investigation.
Next I would inspect SQL or EF Core logging. I would look at the query text, query count, repeated queries, frequency, and which queries consistently take the most time. Timing tells me where the time is going. Logging tells me what database operations were executed. I use both pieces of evidence together rather than treating either one as complete proof.
I would also measure result size and row count. If the same logical request becomes progressively slower as more rows are returned, I would compare that growth with database duration and application CPU. If database time grows while application CPU remains relatively flat, that supports the database as the primary bottleneck. If database duration remains flat, the extra cost may instead be row transfer, object materialization, serialization, or another application stage.
I would also check connection pool wait or transaction wait when the evidence suggests database related waiting. A request can spend time waiting for an available connection or transaction contention even when the query itself is not especially expensive. That waiting time must not be confused with C# CPU work.
My conclusion would be evidence based. I would call the database the likely bottleneck when database calls consume a large part of total request latency, the same slow queries appear in logs or traces, and latency grows with row count or result size while application CPU does not become the dominant cost. If total latency rises without database time rising, or an application CPU hotspot grows instead, I would investigate another bottleneck.
After identifying a specific slow query, I would review its execution plan and choose one targeted change. That could be a better query shape, pagination, batching, or an index, but I would add an index only when the query and execution plan support that decision. An index is not a universal performance fix.
Finally, I would retest with the same representative traffic, payload size, data volume, and concurrency. I would compare the same request latency and database timing measurements, verify that the returned result is still correct, and check whether the bottleneck moved to another resource or dependency. After deployment, I would keep watching the same request and dependency measurements. A microbenchmark or a C# CPU profiler can answer a narrow question, but neither one alone proves that the database is the root cause.
Technical Approach
Define the symptom as high end to end latency for the database backed request.
Capture a baseline using representative traffic, payload size, data volume, and concurrency.
Measure the complete request from arrival through application work, database query execution, row materialization, and response completion.
Separate total latency into application work and database related time instead of attributing the whole request to C# code.
Check query timing and dependency traces for each query duration and the total database share of the request.
Check SQL or EF Core logs for query text, query count, repeated queries, frequency, and consistently slow queries.
Measure result size and row count, then see whether database duration rises as more rows are returned.
Check application CPU so a growing application hotspot is not mistaken for a database problem.
Check connection pool wait or transaction wait when database related waiting is suspected.
If the evidence points to one slow query, inspect its execution plan and choose one targeted change supported by that evidence.
Retest with the same representative workload and compare the same measurements.
Verify correctness and check whether the bottleneck moved to another dependency or resource.
Practical Insights
The investigation adds observation cost rather than changing the request algorithm itself. Query logging and tracing can add runtime overhead, so they should be configured carefully in production. Larger result sets can require more database work, more data transfer, and more object materialization. A query change can reduce work, but pagination, batching, or an added index also has costs. An index uses storage and can make writes more expensive. Pagination changes how data is retrieved. Batching can increase memory use or transaction scope. The important rule is to measure the same workload before and after the change so the tradeoff is visible.
Why Interviewers Ask This
Interviewers ask this to see whether I diagnose performance problems from evidence instead of guessing. They want to know whether I can separate time spent in application work from time spent waiting for the database, use query timing and logs correctly, notice how performance changes as the amount of returned data grows, choose a targeted change only after finding the cause, and verify the result with the same representative workload.
Common interview mistakes
Common mistakes include assuming every slow database backed request is caused by the database, optimizing before measuring, looking only at average latency, testing with unrealistically small data, ignoring query count and result size, treating SQL logs as timing evidence by themselves, confusing application CPU time with dependency waiting, ignoring connection pool or transaction waits, adding an index without examining the query and execution plan, using a CPU profiler as proof of a database root cause, using a microbenchmark as proof of service performance, comparing before and after results with different workloads, and failing to check whether the optimization moved the bottleneck elsewhere.
Interview tip
Explain the diagnosis as an evidence chain. Start with total request latency, separate database time from application work, show what query timing and logs tell you, explain how row count changes the evidence, then describe one measured query change and the same workload retest. Make it clear that no single tool proves the root cause.
Interviewer may ask next
What if the request gets slower as row count grows, but database query duration stays almost unchanged?
I would not call database query execution the primary bottleneck from that evidence. For the same database backed request, I would keep the full request as the measurement boundary and compare database duration with row transfer, materialization, serialization, and application CPU time. If database duration stays flat while total latency grows, the added cost is probably outside query execution. Row count correlation alone is not enough. I would measure the stage that grows before choosing a change.
How would you verify a query optimization safely after deployment?
I would use the same database backed workload and the same measurement boundary that established the baseline. I would compare request latency, database duration, query count, result size, errors, and relevant resource saturation before and after the change. I would also verify that the returned data is correct and check whether the delay moved to application work, connection waits, or another dependency. The main tradeoff is that more tracing or logging can add overhead, so production observation should collect enough evidence without creating a new performance problem.
124. How do you tell whether external API calls are the bottleneck?Performance And ScalingHard
i Question Details
Explain how you would isolate downstream HTTP latency from your own code path and confirm the delay with measurements.
Short Interview Answer (30-60 seconds)
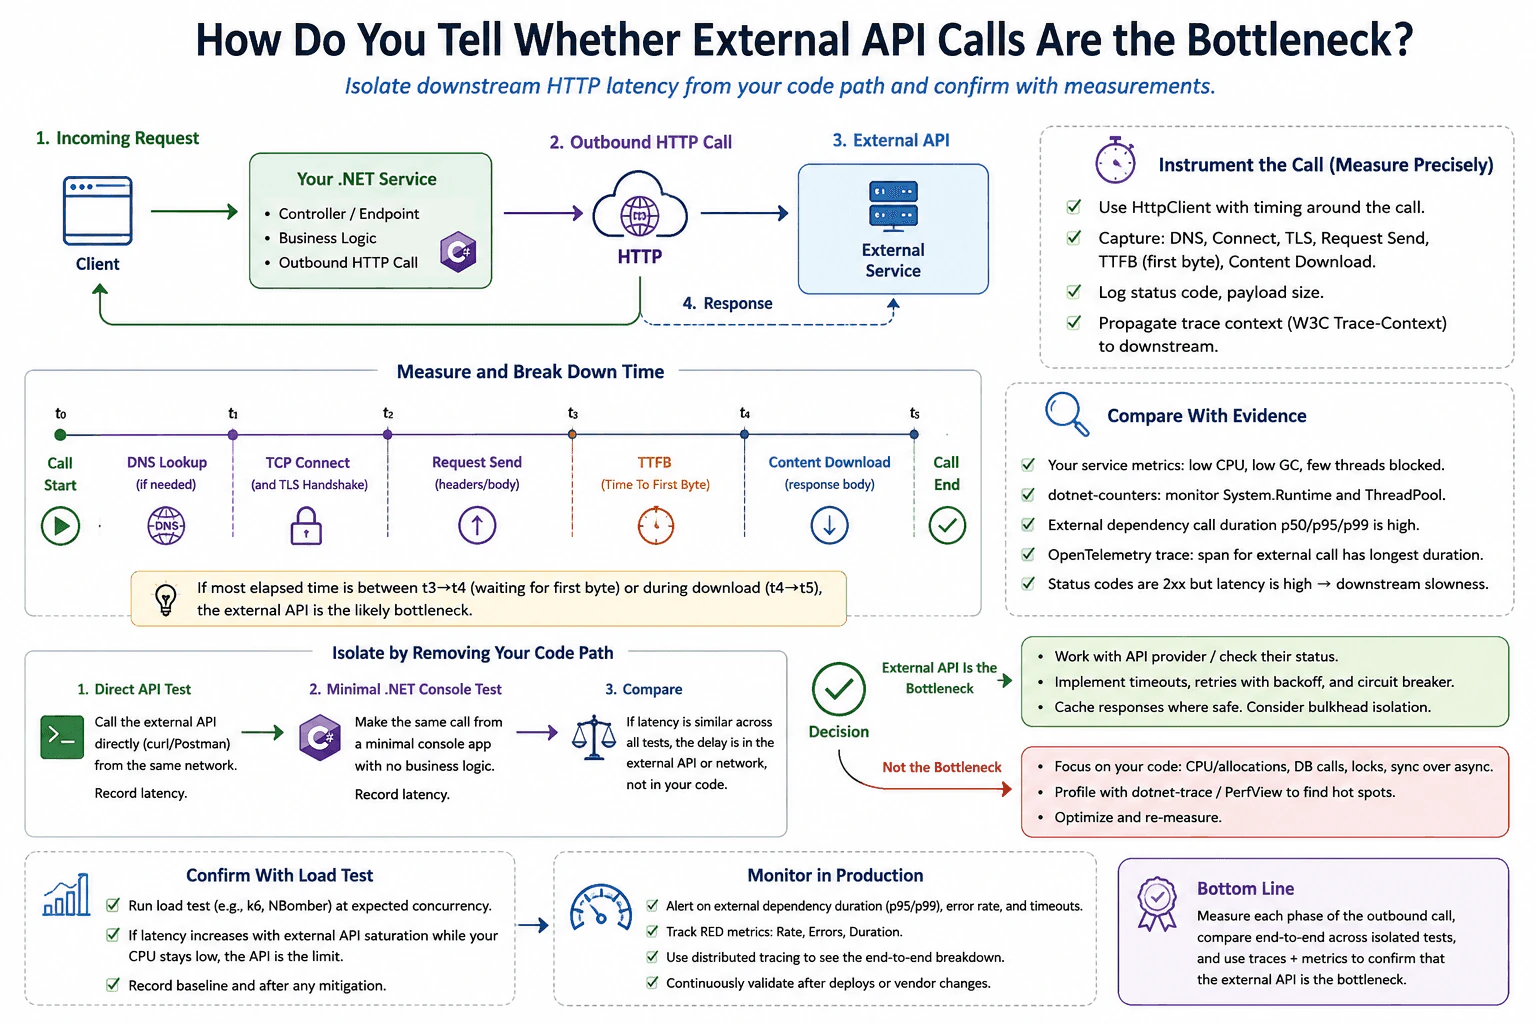
I would first measure the whole request and then measure just the outbound call. If the outbound time makes up most of the delay and my own CPU, memory, and thread use stay low, I would treat the outside service as the likely bottleneck. Then I would confirm it with traces, counters, and the same load after one targeted change.
Detailed Explanation
Sometimes a service feels slow because it must wait for another system on the internet. In that case, the work inside your app may be fine, but the full request still takes a long time. I would first measure the whole request and then measure only the outside call. If the outside call takes most of the time, and my own app stays light, I would treat the other system or the network as the likely cause. Then I would confirm it with a simple test, the same load, and the same metric.
Useful Questions to Ask the Interviewer
Which metric matters most here, p95, error rate, or throughput?
Can I add timing around the outbound call and compare it with total request time?
Is a fast stub or test environment acceptable for the first check?
How to Explain It in an Interview
I would start with the symptom. For example, p95 latency is high on one endpoint, but CPU is not high. Then I would set a clear boundary around the outbound HttpClient call and time that call separately from the rest of the request. I would also compare the total request time with the external call span. If the external span is most of the delay, the outside service or the network is the likely bottleneck.
Next I would use low overhead metrics first. dotnet counters can show CPU, GC, thread pool health, and thread blocking. OpenTelemetry traces can show where the request spends time across services. If I need deeper proof, I would use dotnet trace or EventPipe and then inspect the run with PerfView or Visual Studio Profiler to see the call stacks and where the wait happens. That helps me tell whether I am really waiting on the remote call or whether my own code is slow.
I would then isolate the code path. I could call the same external service from a minimal console app or a fast stub and compare the time. If the same delay appears outside the full app, that supports the external API or network as the bottleneck. If the delay disappears, I would look back at my code for CPU work, serialization, locks, queue delay, or ThreadPool starvation. A microbenchmark alone would not be enough, because it does not represent the real request path.
After that I would make one targeted change only if the evidence supports it. That change might be caching, fewer calls, batching, timeout handling, retries with backoff, or a better dependency choice. I would not call async code faster by default. I would rerun the same representative load, compare the same percentile metric, and confirm that correctness still holds. I would also check that the bottleneck did not move to another dependency or to more memory use. After deployment, I would keep watching the same latency and dependency metrics in production.
Technical Approach
Define the symptom and success metric
Capture a baseline for the whole request
Measure only the outbound HTTP call
Compare the external call time with the total request time
Use counters and traces to see whether your code is busy or mostly waiting
Reproduce with representative load
Test one targeted change
Retest with the same workload
Verify correctness and production metrics
Practical Insights
The main cost is measurement time, tracing overhead, and the work needed to repeat the same load. dotnet counters is light. dotnet trace and deep profiling give more detail but add more overhead, so I would use them in a short controlled run or on a sampled production window. A fix like caching or fewer calls may reduce latency, but it can add stale data risk, more memory use, and more code to keep correct.
Why Interviewers Ask This
The interviewer wants to see whether you can measure a slow request in the right order, separate your own code time from outside wait time, choose the right tools, and make a safe change without guessing.
Common interview mistakes
Optimizing before measuring.
Using average time only and ignoring p95 or p99.
Running a tiny local test and calling it proof of production behavior.
Mixing your code time with remote wait time.
Blaming the external API before checking CPU, locks, queue delay, and ThreadPool health.
Using one profiler sample as final proof.
Changing the code and then testing with a different workload.
Ignoring correctness after the change.
Interview tip
Tell the story in this order: symptom, boundary, evidence, conclusion, change, and retest. Keep saying what you measured and what you ruled out. That shows discipline and makes your answer sound real.
Interviewer may ask next
What if the endpoint is still slow but the outbound call is not the main delay?
Then the external API is probably not the bottleneck for that request. I would look at my own code path next, including CPU work, serialization, locks, queue delay, or ThreadPool starvation. The exact workload is the same endpoint and the same load, and the boundary stays around the full request plus the outbound span. That matters because the fix should match the real delay, not the most visible call.
How would you confirm this in production without adding too much overhead?
I would start with low overhead counters and distributed traces, then use a continuous profiler or a short dotnet trace window only if I need deeper proof. The workload is the real request traffic, and the boundary is still the outbound call versus the full request. That matters because full tracing everywhere can add overhead, so I would validate with the lightest tools first and then confirm with a controlled deeper run.
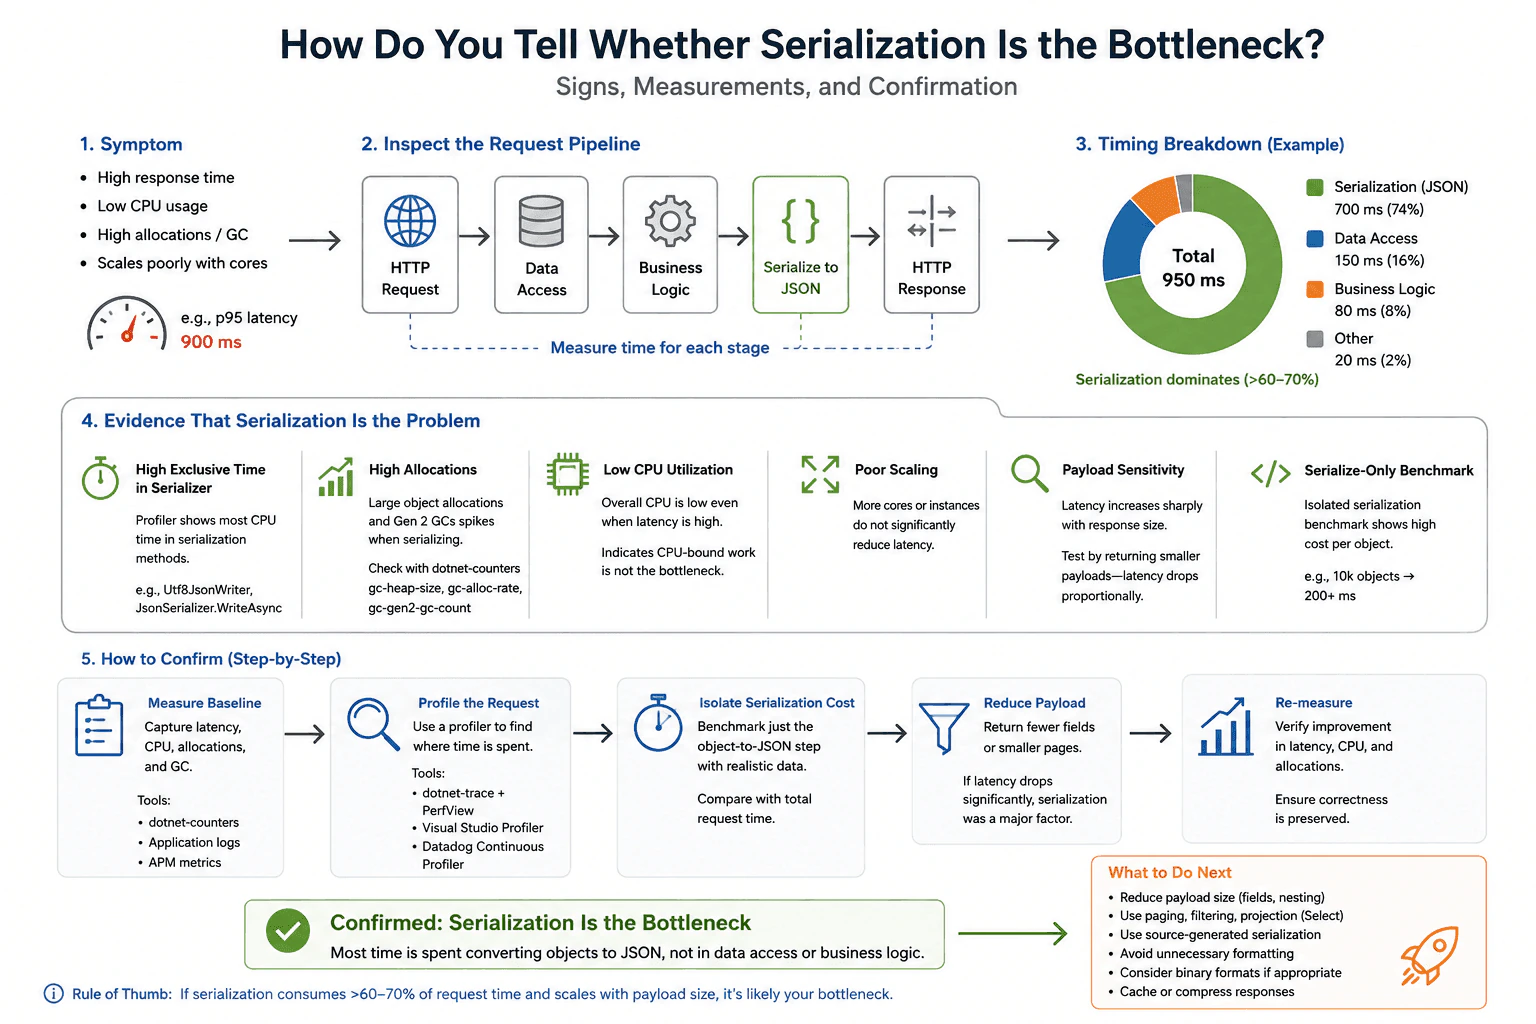
125. How do you tell whether serialization is the bottleneck?Performance And ScalingHard
i Question Details
Describe the signs of a payload-shaping problem and how you would confirm that object-to-JSON conversion is dominating the request time.
Short Interview Answer (30-60 seconds)
I would first measure the full request and split it into database time, business logic, and object to JSON work. If the request is still slow while the database and network are small, and the serializer uses most of the CPU and allocations, I would treat serialization as the bottleneck. I would confirm that by reducing the payload, retesting with the same load, and checking that latency drops without breaking correctness.
Detailed Explanation
Serialization is the step where your app turns its data into JSON before sending it back. To tell if it is the slow part, I would first look at the total request time. Then I would check how much time is spent before the response is written. If the response is large, has many nested parts, or includes fields the client does not need, that can point to a payload shaping problem. If making the payload smaller makes the request much faster, serialization is likely the bottleneck.
Useful Questions to Ask the Interviewer
How large is the response and does its shape change often?
Is the slowness on the server, the network, or after the response is written?
Am I allowed to change the API shape, use DTOs, or remove unused fields?
How to Explain It in an Interview
I would start with the full request and a clear baseline. I would look at p95 latency, CPU, allocations, and garbage collection. Then I would split the request into database time, business logic, and object to JSON time. If database and network time are small, but serialization uses most of the CPU and the request gets slower as payload size grows, that is a strong sign.
Next I would confirm it with evidence. dotnet counters gives first level health metrics. dotnet trace or EventPipe, then PerfView or Visual Studio Profiler, gives call stacks and runtime traces. A continuous profiler such as Datadog Continuous Profiler can also show hot paths in production. I would also check distributed traces so I do not blame serialization for database or network delay.
Then I would change the payload shape. I would return fewer fields, use DTOs, select only what the client needs, page large lists, or remove deep object graphs. I would retest the same workload and compare the same metrics. If latency and CPU drop and correctness still holds, serialization was the bottleneck. I would also watch that the bottleneck did not move to mapping or another dependency. A small microbenchmark can support the finding, but it is not proof of production behavior.
Technical Approach
Define the symptom with latency, CPU, allocations, or garbage collection.
Capture a baseline on the full request.
Reproduce the issue with representative payloads and load.
Split request time into database, business logic, and object to JSON work.
Use dotnet counters first, then dotnet trace, EventPipe, PerfView, Visual Studio Profiler, or a continuous profiler for call stacks.
Check whether serializer CPU, allocations, and garbage collection dominate and whether latency grows with payload size.
Confirm with a smaller payload or a simpler shape such as DTOs or projections.
Retest with the same workload and verify correctness.
Check whether the bottleneck moved to mapping, database work, or network time.
Monitor after deployment.
Practical Insights
The main cost is CPU time and memory use while writing JSON. Bigger objects mean more fields, more nesting, more allocations, and more garbage collection. Profiling also adds some overhead, so the test should be small enough to run safely but close enough to real traffic to matter. If you change the payload shape, you may also add mapping work or API change cost.
Why Interviewers Ask This
This question checks whether the candidate measures the real request first, separates serialization from database and network time, chooses the right profiler or trace, and confirms the fix under representative load instead of guessing from code reading or a tiny local test.
Common interview mistakes
Optimizing before measuring the full request. Using only average latency instead of percentiles. Profiling tiny fake payloads and calling it proof. Blaming serialization when database or network time is actually the problem. Trusting one profiler sample or one microbenchmark as final proof. Changing the payload shape without checking correctness. Ignoring allocations and garbage collection. Comparing before and after with different workloads.
Interview tip
Say the investigation order out loud. Start with the symptom, then the baseline, then the request breakdown, then the profiler evidence, then the payload change, and finally the same load retest. That shows you measure first and only change the code after you know what is slow.
Interviewer may ask next
How would you know it is not the database or network instead of serialization?
I would measure the same request boundary with traces and stage timing. If database time, network time, and queue delay stay low, but the object to JSON step uses most of the CPU and allocations, then serialization is the likely bottleneck. That matters because the fix should target the real hot path, not the visible one.
What is the main tradeoff when you reduce the payload or switch to DTOs?
The tradeoff is extra mapping work and possibly an API shape change, but the same request usually becomes faster because less data is serialized. I would verify the same workload, confirm the output is still correct, and check that the bottleneck did not move to mapping or another dependency.
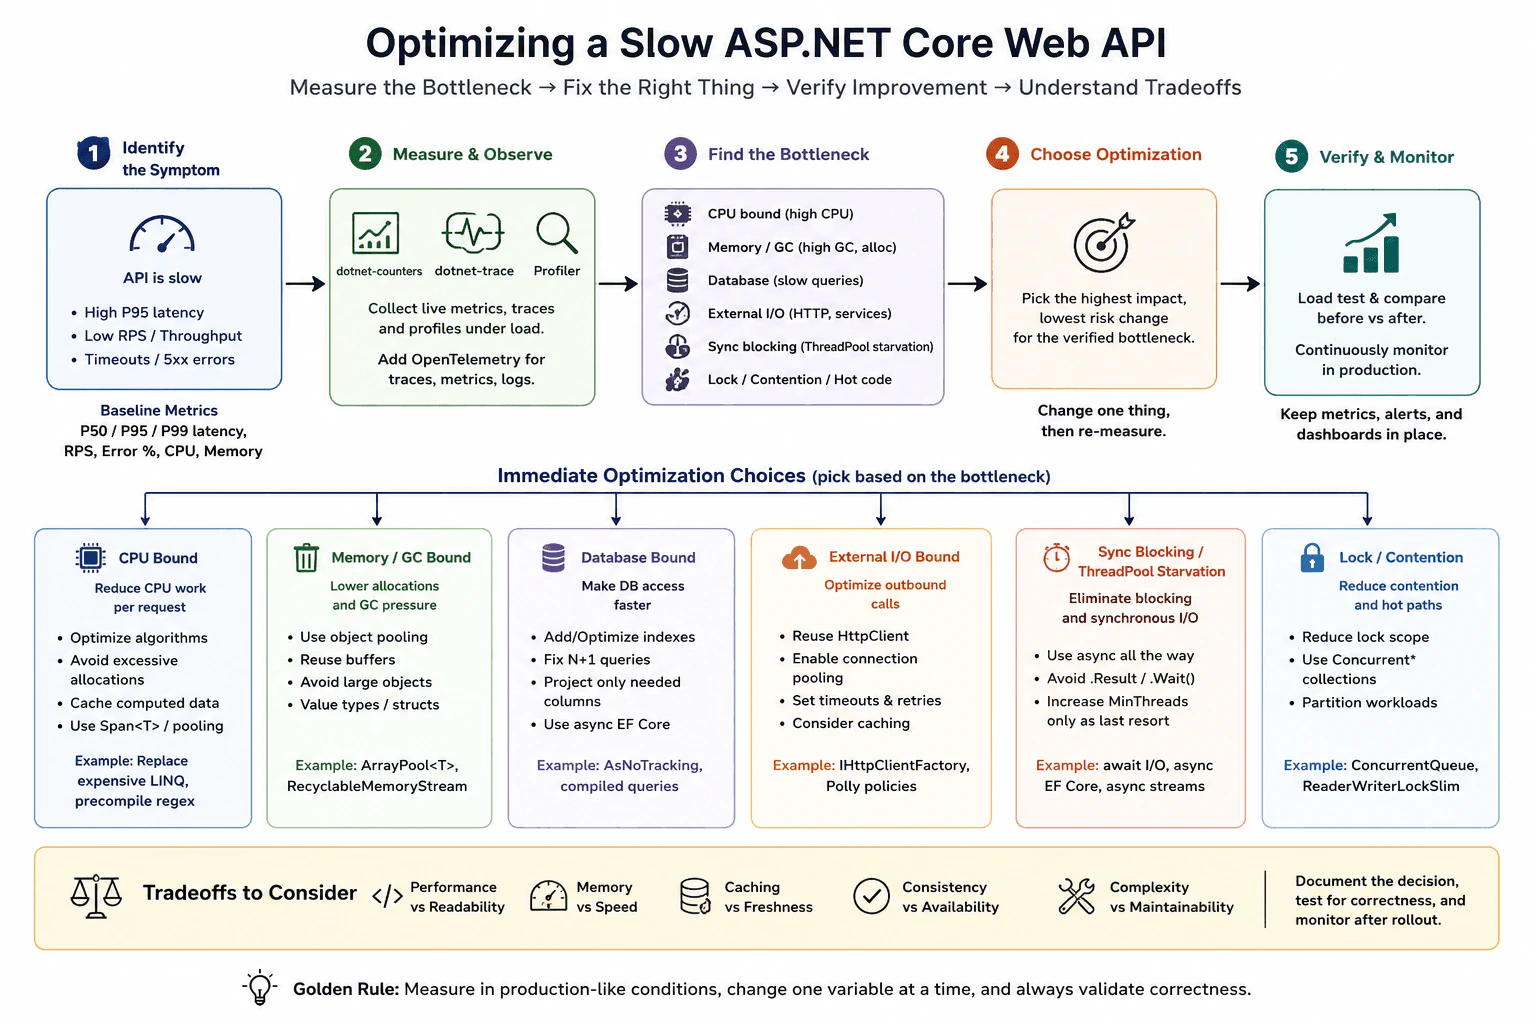
126. How would you optimize the performance of a slow ASP.NET Core web API?Performance And ScalingEasy
i Question Details
Explain how you would measure the bottleneck, the most likely cause, the immediate optimization choices, and the tradeoffs.
Short Interview Answer (30-60 seconds)
I would first define what slow means and capture a baseline for P50, P95, and P99 latency, requests per second, error rate, CPU, memory, garbage collection, and dependency timing under representative load. Then I would use dotnet counters, dotnet trace, a profiler, and OpenTelemetry evidence to find the bottleneck. I would change only the verified cause, such as slow database access, excessive allocations, blocking input and output, too many external calls, expensive CPU work, or lock contention. Then I would repeat the same load test, verify correctness, check whether the bottleneck moved, and monitor the same signals after rollout.
Detailed Explanation
A slow API can have many causes, so I would measure before changing code. I would first define the visible problem, such as high P95 latency, low throughput, or timeouts. Then I would reproduce it with realistic traffic and collect evidence about CPU, memory, database calls, external calls, blocking, and contention. I would choose the highest impact and lowest risk change that targets the measured bottleneck. Finally, I would repeat the same test, confirm correct results, and monitor the system after release.
Useful Questions to Ask the Interviewer
Is the main symptom high P95 latency, low throughput, timeouts, or high resource use?
Does the slowdown happen under normal traffic or only at higher concurrency?
Do we already have OpenTelemetry traces, application metrics, database timings, or profiler data?
Are database calls or external services known to contribute significant request time?
Are there limits on memory, connections, caching, or deployment changes?
How to Explain It in an Interview
I would begin by identifying the symptom and defining a baseline. For this ASP.NET Core API, I would record P50, P95, and P99 latency, requests per second, error rate, CPU, memory, and garbage collection. I would also capture dependency timing so I can distinguish application execution from time spent waiting on a database or external service.
Next, I would reproduce the slowdown under representative load. The traffic mix, payload size, concurrency, data volume, warmup, and dependency behavior should be close to the real workload. A single local request is not enough evidence.
I would then measure and observe. dotnet counters is useful for first level runtime health such as CPU, garbage collection, ThreadPool activity, and request related signals. dotnet trace or EventPipe can collect deeper runtime events and sampled execution data. I can inspect that data with PerfView, Visual Studio Profiler, or another compatible profiler. OpenTelemetry provides traces, metrics, and logs that help show request and dependency timing. These tools answer different questions, so I would combine their evidence rather than treating one tool as complete proof.
From that evidence, I would classify the bottleneck. High CPU with expensive hot paths suggests CPU bound work. High allocation and garbage collection activity suggests memory and garbage collection pressure. Long database timings suggest a database bound request. Long HTTP or service spans suggest external input and output delay. Synchronous calls such as Result or Wait inside an asynchronous request path can contribute to ThreadPool starvation. Lock evidence can reveal contention between requests.
For a typical web API, database access and external input and output are common causes of latency, but I would not assume either one without measurement.
If the API is CPU bound, I would reduce unnecessary computation and allocation. That may include improving an algorithm, replacing expensive repeated LINQ work, precompiling repeated regular expressions, using Span<T> where it is appropriate, or using pooling when measurements show that allocation is significant.
If memory and garbage collection are the bottleneck, I would reduce temporary allocations and reuse buffers where safe. ArrayPool<T> or RecyclableMemoryStream can help in suitable workloads. I would avoid large temporary objects and use value types only when they actually reduce measured cost without creating copying or design problems.
If the database is the bottleneck, I would inspect query count, duration, result size, and execution plans. Possible fixes include removing N plus 1 queries, projecting only required columns, using AsNoTracking for read only Entity Framework Core queries, using compiled queries when repeated query compilation is measurable, and adding or changing indexes only when the query and execution plan justify it. I would continue using asynchronous Entity Framework Core operations for database input and output.
If external input and output is the bottleneck, I would reduce unnecessary outbound calls, use IHttpClientFactory or another correct HttpClient lifetime strategy, reuse connections, configure suitable timeouts, and apply retries only for failures where retrying is safe and useful. Polly policies can help implement resilience rules when appropriate. Caching can reduce repeated dependency work, but cache freshness and invalidation become new correctness concerns.
If synchronous blocking or ThreadPool starvation is the problem, I would remove Result and Wait from the asynchronous request path and use asynchronous APIs all the way through for input and output. I would not use Task.Run to disguise naturally asynchronous input and output. Increasing ThreadPool minimum threads would be a last resort after the blocking cause and downstream limits have been understood.
If lock contention is the bottleneck, I would reduce the amount of shared mutable state and shorten critical sections. Depending on the exact access pattern, a suitable concurrent collection such as ConcurrentQueue or a carefully used ReaderWriterLockSlim can help, but I would choose it from measured contention rather than replacing synchronization blindly.
After selecting the optimization, I would change one important variable at a time and rerun the same representative load test. I would compare the same P50, P95, and P99 latency, throughput, error rate, CPU, memory, garbage collection, and dependency timings. I would also run functional and contract tests so the faster version still behaves correctly.
Finally, I would monitor the result after rollout. I would keep metrics, traces, dashboards, and alerts for the same signals. I would check whether the bottleneck moved to the database, connection pool, memory system, or another dependency.
The tradeoffs matter. Better CPU performance can reduce readability. Lower allocations can make memory management more complex. Caching improves speed but can return stale data. A consistency choice can affect availability. More aggressive optimization can also make the system harder to maintain. The goal is not the fastest possible code in isolation. The goal is a measurable improvement that keeps the API correct, reliable, and maintainable.
Technical Approach
Identify the symptom. Define whether the problem is high P95 latency, low requests per second, timeouts, errors, CPU, or memory.
Capture baseline metrics. Record P50, P95, and P99 latency, throughput, error rate, CPU, memory, garbage collection, and relevant dependency timing.
Reproduce the issue with representative traffic, payloads, concurrency, data volume, warmup, and dependency behavior.
Measure and observe. Use dotnet counters for first level runtime health, dotnet trace or EventPipe for deeper runtime evidence, a compatible profiler for hot paths and allocations, and OpenTelemetry for traces, metrics, and logs.
Find the bottleneck. Classify the measured problem as CPU bound, memory and garbage collection bound, database bound, external input and output bound, synchronous blocking with ThreadPool starvation, or lock contention.
Choose the highest impact and lowest risk optimization that directly targets the verified bottleneck.
For CPU pressure, reduce expensive work and unnecessary allocation. For memory pressure, lower allocation and reuse buffers where safe. For database delay, improve measured queries and result handling. For external calls, reduce calls and manage connections, timeouts, and retries correctly. For blocking, use asynchronous input and output throughout. For contention, reduce shared critical sections and choose an appropriate concurrent design.
Change one important variable at a time and repeat the same load test.
Compare the same latency, throughput, error, CPU, memory, garbage collection, and dependency signals before and after.
Run correctness checks and verify that the bottleneck did not move to another resource.
Monitor the same metrics, traces, dashboards, and alerts after rollout.
Practical Insights
Performance work also has a cost. dotnet counters usually has relatively low overhead, while deeper tracing and profiling can consume more CPU, memory, storage, and analysis time. Load testing consumes infrastructure and can pressure real dependencies. Each optimization has its own tradeoff. Pooling can lower allocations but requires careful lifetime handling. Caching uses memory and creates freshness rules. Database indexes can make reads faster but increase storage and write work. More concurrency can increase connection use and downstream pressure. Removing locks can make state management harder. The best change is the one that improves the measured bottleneck without creating a larger correctness, reliability, or maintenance problem.
Why Interviewers Ask This
Interviewers ask this to see whether I diagnose performance with evidence instead of guessing. They want to know whether I can measure latency and throughput, separate CPU work from waiting, identify database, memory, external service, ThreadPool, and lock problems, choose the right diagnostic tools, make a targeted change, and explain the production tradeoffs.
Common interview mistakes
Common mistakes include optimizing before measuring, looking only at average latency, testing with unrealistic traffic, and treating one fast local request as proof of production performance. Another mistake is confusing CPU execution with time spent waiting on a database or external service. Blocking an asynchronous request path with Result or Wait can contribute to ThreadPool starvation. Increasing ThreadPool minimum threads before removing the blocking cause can hide the real problem. Adding more Tasks, workers, or replicas without measuring CPU, memory, connections, queueing, and downstream capacity can make performance worse. Other mistakes include adding an index without query plan evidence, using caching without a freshness strategy, treating one profiler as complete proof, comparing different workloads before and after a change, and forgetting to verify correctness or check whether the bottleneck moved.
Interview tip
Explain this as an evidence loop. Start with the symptom and baseline. Show how you measure the request under realistic load. Classify the bottleneck from evidence. Choose one targeted change. Repeat the same test and verify correctness. Finish with the tradeoff and how you will monitor the result in production.
Interviewer may ask next
What would you investigate if CPU is low but P95 latency is still very high?
I would not call the ASP.NET Core API CPU bound. I would inspect where the request is waiting. OpenTelemetry traces can show database and external service timing, while runtime metrics can reveal ThreadPool pressure. I would also look for connection waits, Result, Wait, synchronous input and output, and lock contention. If one of those waits dominates the request, I would optimize that measured delay rather than CPU code. The tradeoff is that adding caching, connections, or concurrency can move pressure to memory or downstream services, so I would repeat the same load test afterward.
What tradeoffs would you consider before adding caching to this API?
I would add caching only if repeated database or external service work is a measured bottleneck and the data can tolerate a defined freshness policy. I would compare the same ASP.NET Core API workload before and after the change using latency, throughput, errors, CPU, memory, and dependency timing. I would also test whether cached results remain correct and monitor miss load and memory use after rollout. The main tradeoff is faster repeated access in exchange for extra memory, invalidation complexity, and the possibility of stale data.
127. What is ASP.NET Core?API DesignEasy
i Question Details
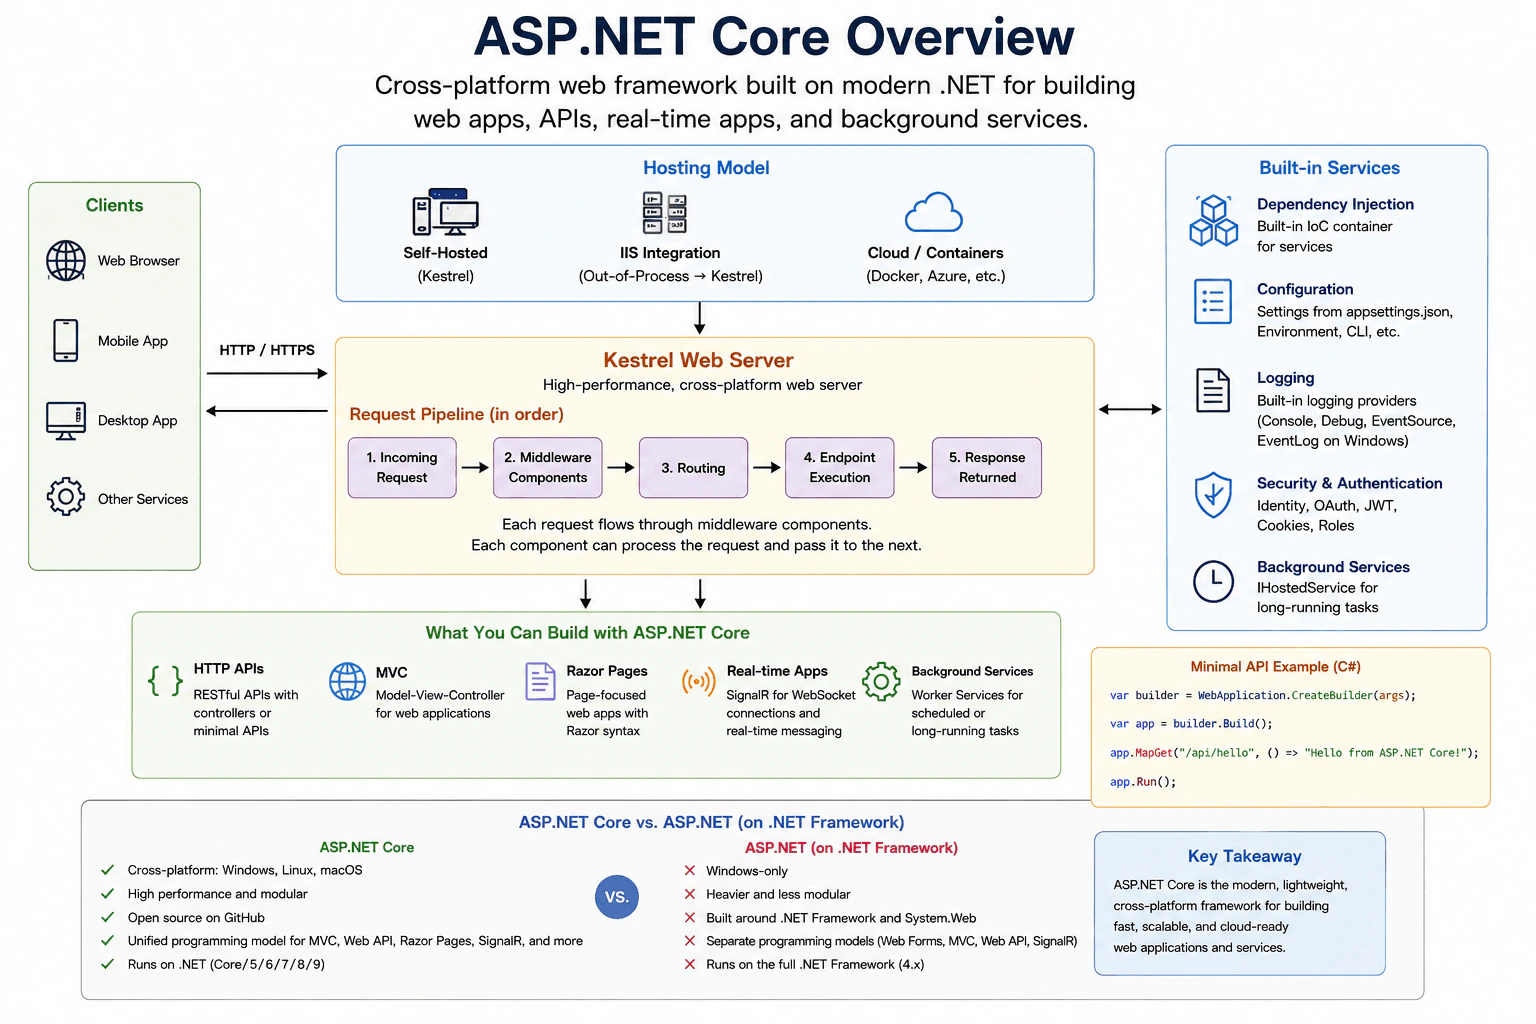
Define ASP.NET Core as the cross-platform web framework built on modern .NET. Explain its hosting model, Kestrel web server, request pipeline, middleware, built-in dependency injection, configuration, logging, and support for HTTP APIs, MVC, Razor Pages, real-time applications, and background services. Distinguish ASP.NET Core from the older ASP.NET on .NET Framework.
Short Interview Answer (30-60 seconds)
At a high level, ASP.NET Core is the modern, cross-platform web framework built on .NET. A client sends an HTTP or HTTPS request to Kestrel. The request then moves through middleware, routing, endpoint execution, and back as a response. The framework also provides dependency injection, configuration, logging, security and authentication features, and background services. It supports HTTP APIs, MVC, Razor Pages, SignalR, and Worker Services. For security, I keep authentication as a shared framework concern. The main trade-off is that a flexible middleware pipeline requires correct ordering and configuration.
Detailed Explanation
This question asks what ASP.NET Core is and how a web request moves through it. The goal is to explain how a client reaches an application, how the application handles the request, and what kinds of applications the framework can build. We also need to explain the common services that come with the framework. The main challenge is connecting these ideas into one simple story. I would follow the diagram from clients, through hosting and Kestrel, through the request pipeline, and finally compare ASP.NET Core with older ASP.NET on .NET Framework.
Useful Questions to Ask the Interviewer
Do you want only the high-level framework overview, or also the C# example?
Should I spend extra time comparing ASP.NET Core with older ASP.NET?
How to Explain It in an Interview
1. Start with the hosting model
I would start by saying ASP.NET Core can run in several environments. The diagram shows self-hosting with Kestrel, IIS integration using an out-of-process path to Kestrel, and cloud or container hosting. This matters because ASP.NET Core is cross-platform. It can run on Windows, Linux, and macOS. These hosting choices all lead into the ASP.NET Core application and its web server.
2. Explain Kestrel and the client flow
Kestrel is ASP.NET Core's high-performance, cross-platform web server. A web browser, mobile app, desktop app, or another service can send HTTP or HTTPS traffic toward it. Kestrel receives the incoming request. The response later travels back toward the client. I would keep Kestrel separate from the application services because it owns the web-server role.
3. Walk through the request pipeline
The request next enters the ASP.NET Core pipeline. It first reaches middleware components. Middleware means small components that inspect or process a request. The request then reaches routing. Routing chooses the endpoint that should handle it. The selected endpoint executes the application logic. After that, the response is returned. The important idea is that middleware is modular. Each component can do its work and pass processing to the next part of the pipeline.
4. Explain the built-in services
ASP.NET Core provides common services around this flow. Dependency injection supplies application services through a built-in container. Configuration can read values from appsettings.json, environment settings, and command-line input. Logging supports providers such as Console, Debug, EventSource, and EventLog on Windows. The diagram also shows security and authentication options including Identity, OAuth, JWT, cookies, and roles. Background work can use IHostedService for long-running tasks.
5. Show what ASP.NET Core can build
The same framework supports several application styles. HTTP APIs can use controllers or Minimal APIs. MVC supports Model-View-Controller web applications. Razor Pages provides page-focused web applications using Razor syntax. SignalR supports real-time communication. Worker Services support scheduled or long-running background work. The diagram's Minimal API example maps GET /api/hello and returns "Hello from ASP.NET Core!" before app.Run() starts the application.
6. Finish with the older ASP.NET comparison
I would finish by explaining the main difference from older ASP.NET on .NET Framework. ASP.NET Core is cross-platform, open source, high performance, and modular. It runs on modern .NET. Older ASP.NET is Windows-only, runs on the full .NET Framework 4.x, and is built around .NET Framework and System.Web. The diagram also contrasts ASP.NET Core's unified framework with older separate models such as Web Forms, MVC, Web API, and SignalR. The main takeaway is that ASP.NET Core is the modern choice for cross-platform web applications and services.
Practical Complexity & Trade-offs
The main design choice is the modular request pipeline. The benefit is that each middleware component can handle one concern before routing and endpoint execution. This keeps responsibilities easier to separate. The downside is that middleware order and configuration matter. Kestrel gives the application a fast, cross-platform web server, while IIS can forward requests to Kestrel in the out-of-process hosting model shown. Built-in dependency injection, configuration, logging, and security features reduce repeated infrastructure work. ASP.NET Core also supports several application styles inside the same framework. That gives teams flexibility, but they still need to choose the right style for each job. Minimal APIs are simple for small HTTP APIs, while MVC, Razor Pages, SignalR, and Worker Services serve different needs.
Why Interviewers Ask This
Interviewers ask this question to check whether you understand ASP.NET Core as a working web framework, not only as a name. They want to see whether you can explain hosting, Kestrel, middleware, routing, endpoint execution, and the returning response in the correct order. They also check your understanding of dependency injection, configuration, logging, security features, and supported application types. A strong answer clearly separates modern ASP.NET Core from older ASP.NET on .NET Framework.
Interviewer may ask next
What changes if the application needs more request-processing steps?
I would extend the existing middleware pipeline instead of changing the overall architecture. The affected flow remains client to Kestrel, then middleware, routing, endpoint execution, and the response back to the client. I would add only the middleware needed for the new concern and place it in the correct order. For example, if the concern is authentication, the application's security and authentication features should run before protected endpoint logic needs the caller's identity. Routing and the endpoint still keep their existing jobs. Dependency injection can supply services used by the new middleware. Configuration can provide settings, and logging can record useful application events. Correctness depends on keeping each component's responsibility clear and preserving the request order. Security depends on not bypassing the required security step. The main downside is added pipeline complexity. As more middleware is added, developers must understand ordering and interactions more carefully.
How would you choose between Minimal APIs, MVC, Razor Pages, SignalR, and Worker Services?
I would choose the application style based on what the application needs to do, while keeping the same ASP.NET Core foundation. For a small HTTP API like the diagram's GET /api/hello example, a Minimal API can keep the code simple. For a web application that benefits from controllers and views, I would choose MVC. For page-focused web work, Razor Pages is a natural fit. For real-time communication, I would use SignalR. For scheduled or long-running background work, I would use Worker Services. The affected endpoint or flow changes with the application style, but Kestrel, middleware, routing, dependency injection, configuration, logging, and security features remain available where they apply. Correctness comes from matching the programming model to the job instead of forcing one model everywhere. Security still belongs in the application's normal security and authentication setup. The downside is that a team may need to understand several ASP.NET Core programming models when one product uses more than one style.
Disclaimer: This interview guide is for educational and informational purposes only. It is designed to help readers prepare, but it does not guarantee any interview result, hiring decision, offer, or outcome. Interview questions, hiring criteria, and preferred answers can vary by employer, interviewer, industry, location, and time. All answers, examples, and explanations in this guide are suggested examples for interview preparation, not definitive answers or instructions for professional practice. They are based on research and judgment, are provided without warranties of any kind, and should be adapted to the question, role, and applicable laws and professional requirements. Diagrams are simplified illustrations intended to highlight the main concepts and their relationships; actual situations, systems, and practices may be more complex. Alternative approaches may be equally valid or better suited to a particular question, context, or interviewer. To the fullest extent permitted by applicable law, the contributors and publisher are not liable for decisions made, actions taken, or losses incurred based on this guide.
State Laws and Professional Responsibilities: Laws and requirements governing an occupation vary by state and jurisdiction. You are responsible for checking the current laws, licensing requirements, and scope-of-practice rules that apply to your location and role, and for ensuring that your answers and actions comply with them. Adapt examples in this guide to those requirements. This guide is not legal advice.
Content Accuracy and Verification: To the fullest extent permitted by applicable law, we do not represent or warrant that interview guides, questions, answers, examples, or diagrams are accurate, complete, current, error-free, or suitable for any particular purpose. You are responsible for independently reviewing and verifying the information before relying on it.