This interview guide is for educational and informational purposes only. It is designed to help readers prepare, but it does not guarantee any interview result, hiring decision, offer, or outcome. Interview questions, hiring criteria, and preferred answers can vary by employer, interviewer, industry, location, and time. All answers, examples, and explanations in this guide are suggested examples for interview preparation, not definitive answers or instructions for professional practice. They are based on research and judgment, are provided without warranties of any kind, and should be adapted to the question, role, and applicable laws and professional requirements. Diagrams are simplified illustrations intended to highlight the main concepts and their relationships; actual situations, systems, and practices may be more complex. Alternative approaches may be equally valid or better suited to a particular question, context, or interviewer. To the fullest extent permitted by applicable law, the contributors and publisher are not liable for decisions made, actions taken, or losses incurred based on this guide.
State Laws and Professional Responsibilities
Laws and requirements governing an occupation vary by state and jurisdiction. You are responsible for checking the current laws, licensing requirements, and scope-of-practice rules that apply to your location and role, and for ensuring that your answers and actions comply with them. Adapt examples in this guide to those requirements. This guide is not legal advice.
Identity, Image, and Privacy Notice
To respect individual privacy, some names, profile photographs, avatars, biographical details, and other identifying information displayed in this guide may be replaced with pseudonyms, licensed stock images, illustrative avatars, composite images, or representative descriptions. Unless a person is expressly identified as an actual contributor, a displayed name, image, or profile should not be understood as depicting or identifying a specific candidate, interviewer, employee, or other real individual. These representations are provided for editorial and illustrative purposes only and do not imply endorsement, employment, participation, or affiliation with this guide or any company mentioned in it. Any resemblance to an actual person is coincidental.
Company Notice
This guide is an independent educational resource and is not affiliated with, endorsed by, sponsored by, or approved by the company named in this guide. Company names identify reported interview experiences or the employer context of clearly labeled original practice exercises. Interview practices can change without notice, and inclusion of company-specific content does not mean these questions are official, complete, or guaranteed to be asked. To the fullest extent permitted by law, the author, contributors, and publisher are not responsible for outcomes related to use of this material.
Content Accuracy and Verification
To the fullest extent permitted by applicable law, we do not represent or warrant that interview guides, questions, answers, examples, or diagrams are accurate, complete, current, error-free, or suitable for any particular purpose. You are responsible for independently reviewing and verifying the information before relying on it.
Questions or comments?
Contact us for general questions, or share feedback, technical corrections, and comments with the community.
91. What is the catch with ExecuteUpdate and ExecuteDelete?Database And Ef CoreHard
i Question Details
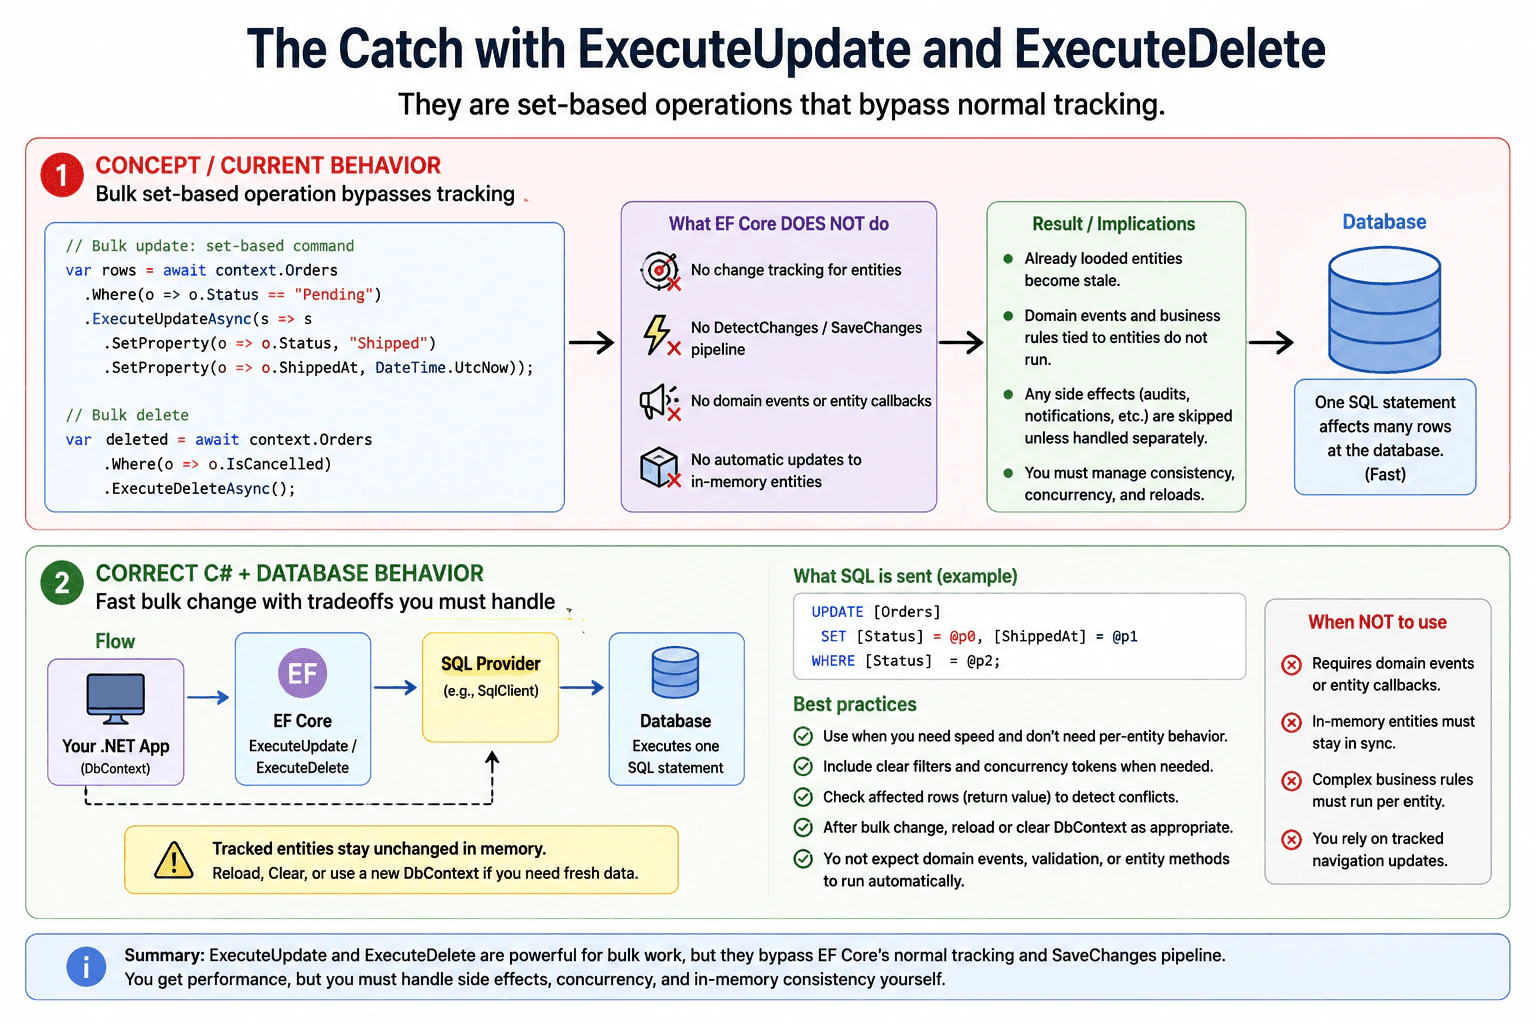
Cover the fact that these are set-based operations that bypass normal tracking, and explain the implications for domain events and in-memory entities.
Short Interview Answer (30-60 seconds)
ExecuteUpdate and ExecuteDelete are fast bulk operations, but they bypass the normal EF Core change tracker and SaveChanges pipeline. That means tracked entities stay stale, domain events tied to entities do not fire automatically, and you must handle side effects, concurrency, and reloads yourself.
Detailed Explanation
This question is asking about a common EF Core surprise: these methods are not the same as editing loaded entities and calling SaveChanges. They send a set-based command straight to the database, so EF Core does not walk each entity one by one. That matters because anything tied to tracked objects, such as domain events, in-memory state, and some application rules, will not run automatically.
Useful Questions to Ask the Interviewer
Should this operation also trigger domain events or business workflows?
Do we need the currently loaded entities to stay in sync after the update or delete?
How to Explain It in an Interview
The main catch is that ExecuteUpdate and ExecuteDelete are bulk, set-based operations. They are great for performance because they avoid loading rows into memory and avoid per-entity tracking overhead. But they also bypass EF Core’s normal change tracking and SaveChanges flow.
So if you already loaded entities into the DbContext, those objects do not get updated automatically. They become stale unless you reload them, clear the context, or dispose it. Also, any domain events, entity methods, or business logic that normally happens when you change tracked entities will not happen automatically, because EF Core is not applying changes to each entity instance.
The practical tradeoff is speed versus behavior. Use them when you want efficient bulk changes and you do not need entity-level side effects. Do not use them when your domain rules depend on tracked entities, in-memory consistency, or logic that must run per entity.
One more important point is concurrency. Because these methods run directly against the database, you should think carefully about whether the rows may have changed since you read them. If concurrency matters, include the right predicates and check the rows affected.
Practical Insights
These commands are usually cheaper than loading many entities because they use one database statement instead of many tracked changes. The main cost is not CPU or memory in the app, but the risk of stale in-memory data and missed business side effects. Maintenance cost can be higher because you must manage consistency yourself.
Why Interviewers Ask This
This checks whether you understand the difference between tracked entity updates and set-based bulk operations, including what EF Core does not do for you and how that affects business rules, in-memory state, and data consistency.
Common interview mistakes
A common mistake is assuming ExecuteUpdate and ExecuteDelete behave like SaveChanges on tracked entities. Another mistake is forgetting that already loaded objects are stale after the bulk command runs. People also forget about missing domain events, skipped entity methods, and concurrency checks.
Interview tip
Say that they are excellent for bulk performance, but they move responsibility for consistency and side effects from EF Core to your code.
Interviewer may ask next
What happens to tracked entities after ExecuteUpdate?
They are not refreshed automatically. The database changes, but the objects already tracked by the DbContext keep their old values until you reload them, clear the context, or create a new DbContext.
When would you avoid ExecuteDelete?
Avoid it when deletes must run entity logic, emit domain events, honor complex application rules, or cascade through behavior that depends on loaded objects rather than pure database constraints.
92. You include three collections and the row count explodes. What is going on?Database And Ef CoreEasy
i Question Details
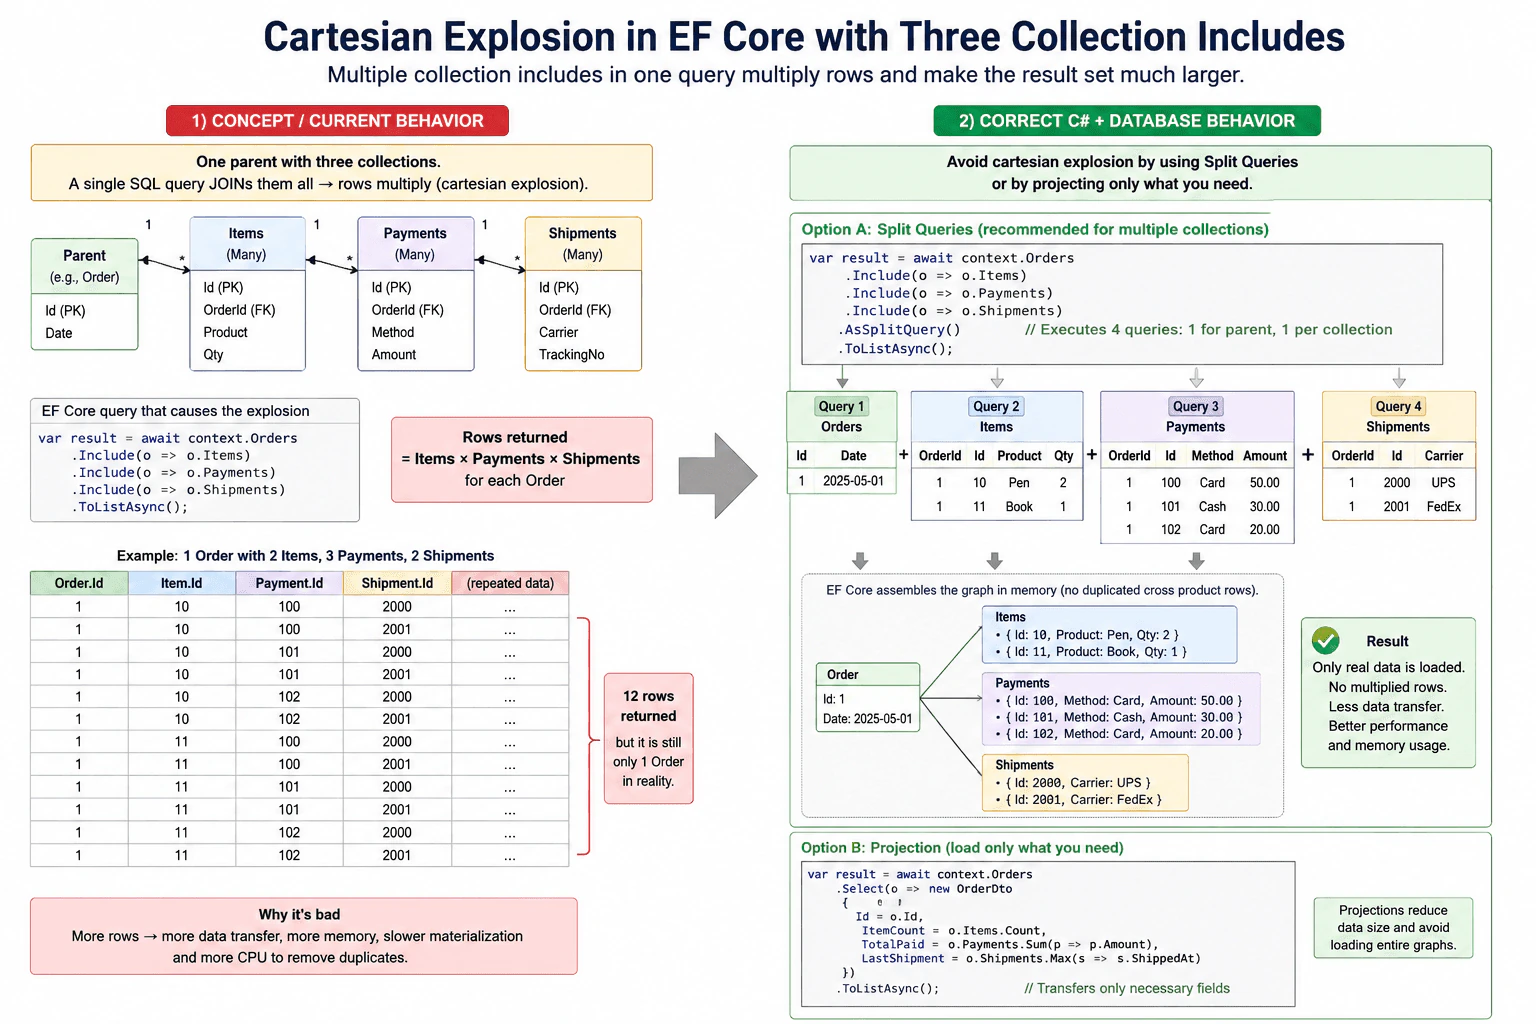
Explain the cartesian explosion effect, how multiple collection includes multiply rows, and why the result set can become much larger than expected.
Short Interview Answer (30-60 seconds)
This is cartesian explosion. When EF Core joins multiple collections in one query, the rows multiply across each collection, so the same parent data is repeated many times. The result set gets much larger than the actual entity graph, which hurts performance and memory.
Detailed Explanation
When you ask this, you are describing a result that gets much bigger than the real data. One main item is connected to three different lists, and the application brings back many repeated copies of the same main item. The problem is not bad data. It is the way the request is built. Each extra list can multiply the returned items, so a small set of records can turn into a very large answer. This hurts speed, memory use, and data transfer.
Useful Questions to Ask the Interviewer
Are these three lists expected to be small or large?
Do you want one query or smaller queries if that is faster?
Is the main goal fewer database trips or less repeated data?
How to Explain It in an Interview
Cartesion explosion happens when one parent row is joined with several collection tables in the same query. Each collection multiplies the rows, so the same parent columns repeat many times. In EF Core, this often happens with multiple Include calls on collections. The fix is to use AsSplitQuery(), project only needed fields, or load data in separate queries when that gives better performance. I would mention that the tradeoff is fewer joins versus more round trips. The right choice depends on data size and access pattern.
Technical Approach
Notice that the query includes multiple collections.
Expect row multiplication from joins.
Check whether the result set is much larger than the entity count.
Reduce duplication with split queries or projection.
Measure performance before choosing the final shape.
Practical Insights
The main cost is bigger SQL results, more network traffic, more memory, and slower materialization in .NET. Using split queries can reduce duplication, but it may add extra database round trips. The tradeoff is usually clearer and more stable performance.
Why Interviewers Ask This
They want to see whether you understand how EF Core translates multiple collection includes, why a single query can multiply rows, and when to choose split queries or projection to reduce duplicated data and memory use.
Common interview mistakes
A common mistake is thinking the database has duplicated rows. Usually the rows are duplicated by the join shape, not by bad data. Another mistake is using many Include calls without checking result size. A third mistake is ignoring the tradeoff between one big query and several smaller queries.
Interview tip
Say the problem name first, then explain the row multiplication in simple words, and finish with the practical fix: split query, projection, or loading less data.
Interviewer may ask next
How do you reduce cartesian explosion in EF Core?
Use AsSplitQuery() for multiple collection includes, or project only the fields you need. If the graph is still large, load some collections in separate queries. The best choice depends on whether you want fewer round trips or less duplicated data.
Why not always use split queries?
Split queries reduce duplication, but they can add more database round trips and sometimes more coordination in the application. For small graphs, a single query may be faster. For large graphs with several collections, split queries often work better.
93. Your EF Core query works with 100 records but times out with 100,000. How do you fix it?Database And Ef CoreMedium
i Question Details
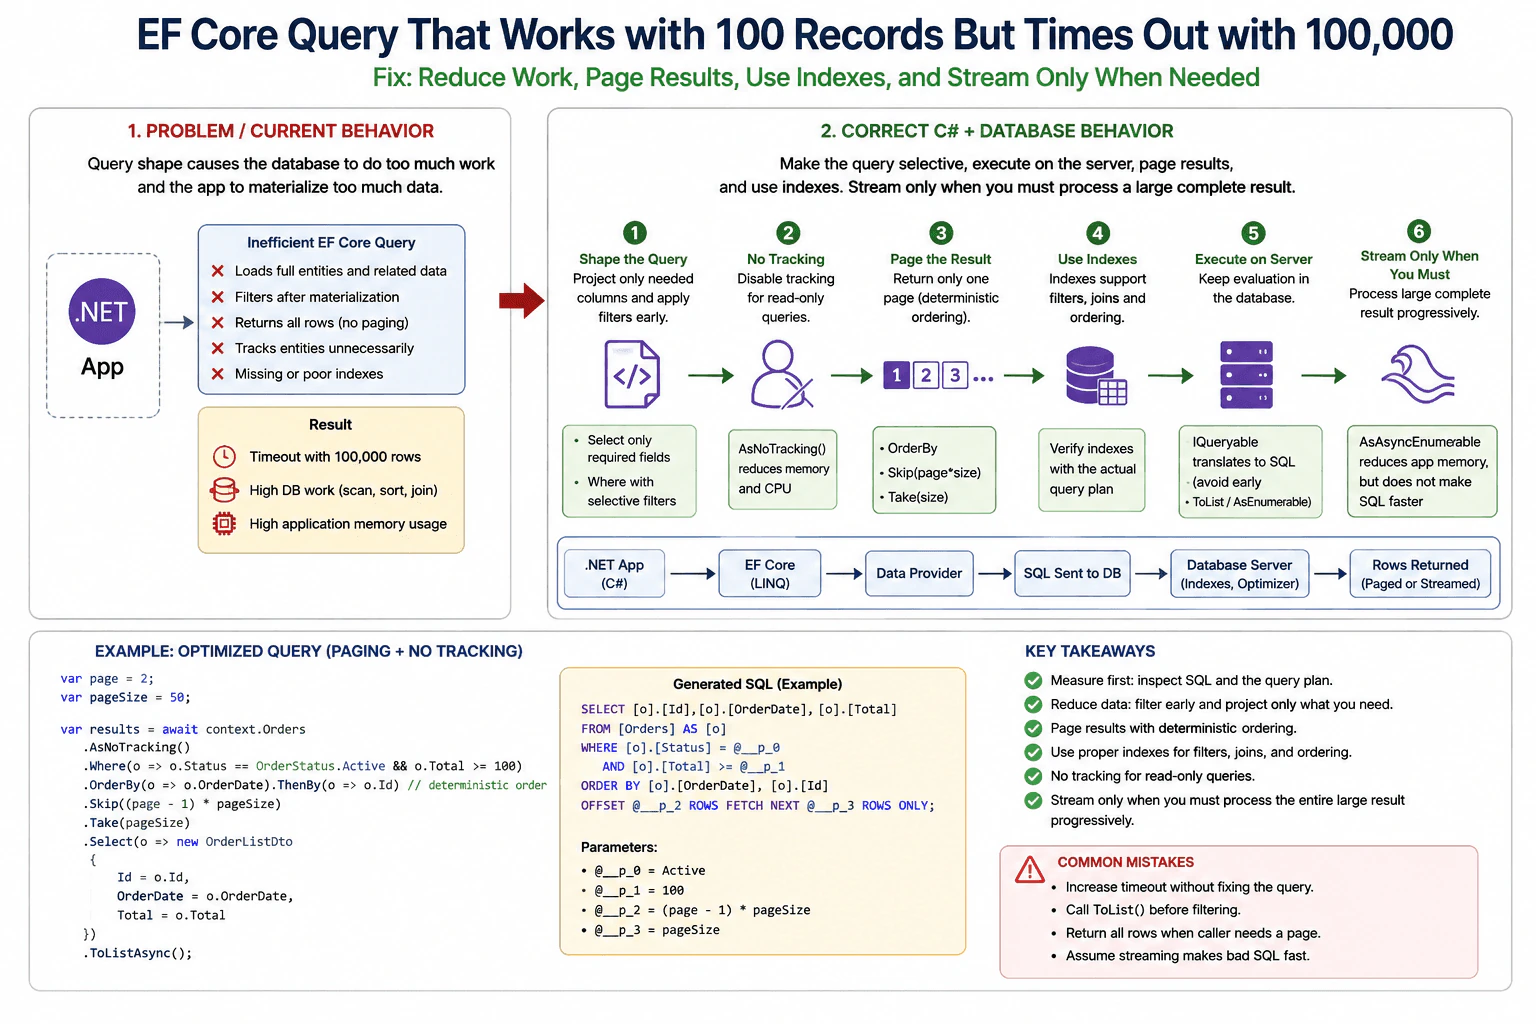
Cover query shape, filtering, paging, indexes, server-side evaluation, and the difference between materializing too much data versus streaming it.
Short Interview Answer (30-60 seconds)
I would not increase the timeout first. I would inspect the generated SQL and query plan, filter and project before materializing, page large results, verify indexes, keep data-reducing work on the server, use no-tracking for read-only queries, and stream only when progressive processing is actually needed.
Detailed Explanation
When a request works with a small amount of information but fails with a much larger amount, I first look for unnecessary work. The program may be asking for far more information than it needs, searching through everything instead of narrowing the result early, or keeping a very large result in memory at once. I would make the request smaller, return only what is needed, process large results in manageable portions, and check whether the stored information is organized so that important searches can be found quickly. I would measure before and after each change rather than guessing.
Useful Questions to Ask the Interviewer
Does the caller need all matching records, or only one page or a limited subset?
Which filters and sort orders are required by the query?
Is the query read-only, or will the returned entities be modified and saved?
Can I inspect the SQL generated by EF Core and the database query plan?
Does the caller need the complete result in memory, or can it process rows progressively?
How to Explain It in an Interview
I would treat the timeout as a scalability problem, not immediately as a timeout-setting problem. The same query can appear fast with 100 rows because inefficient work is cheap at that size, while the same work becomes expensive with 100,000 rows.
First, I would inspect the query shape and measure what the database is doing. I would examine the SQL generated by EF Core and the database query plan. I would check whether the query reads unnecessary entities, columns, related collections, duplicate rows, or a much larger result than the caller actually needs.
If only a few values are required, I would project those values with Select instead of materializing complete entities. Projection reduces the amount of data transferred and the number of objects EF Core must create. For a read-only entity query, I would normally use AsNoTracking because EF Core does not need to keep change-tracking state for entities that will not be updated through that DbContext.
Next, I would make sure important filtering happens before materialization. An EF Core LINQ query normally remains an IQueryable until execution. Translatable Where, OrderBy, Select, Skip, Take, and similar operations can therefore become part of the SQL sent to the database. I would avoid calling ToList, ToArray, AsEnumerable, or another operation that moves subsequent data-reducing work into application memory before the query has been narrowed sufficiently.
Modern EF Core does not silently perform arbitrary client-side evaluation when an expression in the middle of a query cannot be translated. Such a query normally fails rather than automatically downloading the entire table. Limited client evaluation can still occur in the final projection. The practical rule is to keep filters, joins, ordering, grouping, and other operations that determine how much data is returned translatable and server-side whenever possible.
If the application displays or processes only part of the result, I would page it instead of loading every matching row. Offset pagination with Skip and Take is simple and useful when arbitrary page-number navigation is required. However, large offsets can become increasingly expensive because the database may still need to locate and pass over earlier rows. Paging also needs deterministic ordering; otherwise rows can move between pages or appear inconsistently.
For large sequential result sets, keyset or seek pagination can be more efficient. Instead of asking the database to skip all earlier rows, the next request uses the last ordering value from the previous page, such as an ID or a combination of ordered columns. If the primary sort value is not unique, I would add a unique tie-breaker to the ordering and continuation condition so page boundaries are deterministic.
I would then inspect indexes together with the query plan. Columns used frequently for selective filters, joins, and ordering may need suitable indexes. A composite index may be appropriate when several columns participate in the same access pattern, but column order matters and should match the real query pattern. I would not add indexes blindly. Indexes consume storage and add maintenance work to inserts, updates, and deletes, so I would verify that the database actually uses the index and that it improves the target query.
I would also check relationship loading. Eager-loading a large collection with Include can create a much larger joined result than expected because parent values may be repeated for many child rows. Depending on the shape, a split query can avoid some join-related row multiplication, but it performs multiple SQL queries and therefore has different round-trip and consistency tradeoffs. Lazy loading can create an N+1 problem when related data is fetched separately for many rows. I would load only the relationships required by the operation and inspect the actual SQL generated.
Finally, I would distinguish materialization from streaming. ToListAsync reads and materializes the complete query result into a list before the caller receives that list, so application memory grows with the number and size of returned objects. Iterating an EF Core query with await foreach through AsAsyncEnumerable can allow rows to be consumed progressively and can reduce peak application memory because the application does not need one complete List containing every result.
Streaming is not a replacement for query optimization. The database still has to execute the SQL, perform its filtering, joins, sorting, and other work, and return the requested rows. Streaming also normally keeps the database reader and its connection occupied while enumeration is in progress. Therefore, if the caller needs only 50 records, returning one well-indexed page of 50 records is usually better than streaming all 100,000 records.
There are also cases where EF Core or the database provider may buffer internally, for example because of a particular execution strategy or query shape, so I would not promise that streaming always means only one row exists in memory throughout the complete stack. The reliable claim is that progressive enumeration can avoid intentionally materializing the entire application result into one collection.
My sequence is therefore: reproduce and measure the slow query, inspect the generated SQL and query plan, reduce the query shape, apply selective server-side filters, project only required data, page when possible, verify indexes, avoid unnecessary tracking and relationship loading, and use streaming only when the complete large result genuinely must be processed progressively. I would increase the command timeout only after confirming that an optimized operation is legitimately long-running and that the business operation really requires that duration.
Technical Approach
Reproduce and measure the slow query with realistic data volume.
Inspect EF Core's generated SQL and the database query plan.
Remove unnecessary related data and project only required columns.
Apply selective Where predicates before materialization and keep data-reducing operations server-side.
Use AsNoTracking for genuinely read-only entity queries.
Add deterministic ordering and page the result instead of loading all matching rows when possible.
Prefer keyset pagination for large sequential result navigation when its access pattern fits the requirements.
Verify indexes that support the actual filters, joins, and ordering by checking the query plan.
Check for excessive row multiplication, N+1 queries, or other inefficient relationship-loading behavior.
Use streaming only when a genuinely large complete result must be processed progressively.
Measure again and change the timeout only if the optimized operation is intentionally long-running.
Practical Insights
The biggest cost is usually how much data the database must examine, join, sort, and send. Filtering early and using suitable indexes can greatly reduce that work. Projection reduces transferred data and object creation. Paging keeps each request smaller and limits application memory. Tracking adds memory and CPU because EF Core stores information about entities it may later update, so no-tracking removes that work for read-only queries. Streaming can lower peak application memory compared with building one huge list, but it can keep a database connection busy for longer. Indexes improve many reads but consume storage and make writes more expensive. More advanced pagination and indexing strategies also add implementation and maintenance complexity.
Why Interviewers Ask This
This question tests whether the candidate understands that a query that appears acceptable with a small data set may have an inefficient execution shape at production scale. The interviewer is looking for judgment about filtering, projection, paging, indexes, generated SQL, server-side execution, EF Core change tracking, materialization, streaming, query plans, relationship loading, and the difference between reducing database work and merely reducing application memory usage.
Common interview mistakes
Common mistakes are increasing the command timeout without finding the cause, calling ToList before important filters, loading complete entities when only a few fields are needed, returning every matching row when the caller needs one page, assuming streaming makes inefficient SQL faster, claiming EF Core automatically performs arbitrary untranslatable filters on the client, adding indexes without examining the real predicates and query plan, using Skip with very large offsets without considering keyset pagination, paging without deterministic ordering, tracking large read-only result sets unnecessarily, eager-loading large relationship graphs without checking row multiplication, and introducing lazy-loading N+1 queries.
Interview tip
Present the fix as a measurement-driven sequence. Start with generated SQL and the query plan, then reduce database work with filtering, projection, paging, and appropriate indexes. Clearly state that materialization affects application memory, streaming mainly changes how results are consumed, and neither streaming nor a larger timeout repairs an inefficient query.
Interviewer may ask next
What is the difference between ToListAsync and AsAsyncEnumerable for a large EF Core result?
ToListAsync executes the query and materializes the complete result into a List before returning it, so application memory usage grows with the number and size of returned objects. AsAsyncEnumerable supports asynchronous progressive enumeration, which can avoid intentionally building one complete result list and therefore can reduce peak application memory. It does not make inefficient SQL faster, and the database reader and connection normally remain in use while enumeration continues. Internal buffering can still occur for some EF Core execution strategies or query shapes, so streaming should not be described as a guarantee that the entire stack buffers only one row.
When would you prefer keyset pagination over Skip and Take?
I would prefer keyset pagination when users or background processing move sequentially through a large, consistently ordered result and large offsets would make Skip increasingly expensive. Instead of asking the database to skip all earlier rows, the next query filters from the last seen ordering value or values. The ordering should be deterministic, normally with a unique tie-breaker, and suitable indexes should support that access pattern. Skip and Take can still be appropriate when arbitrary page-number navigation is required.
94. How do you troubleshoot an N+1 query that only appears in production?Database And Ef CoreHard
i Question Details
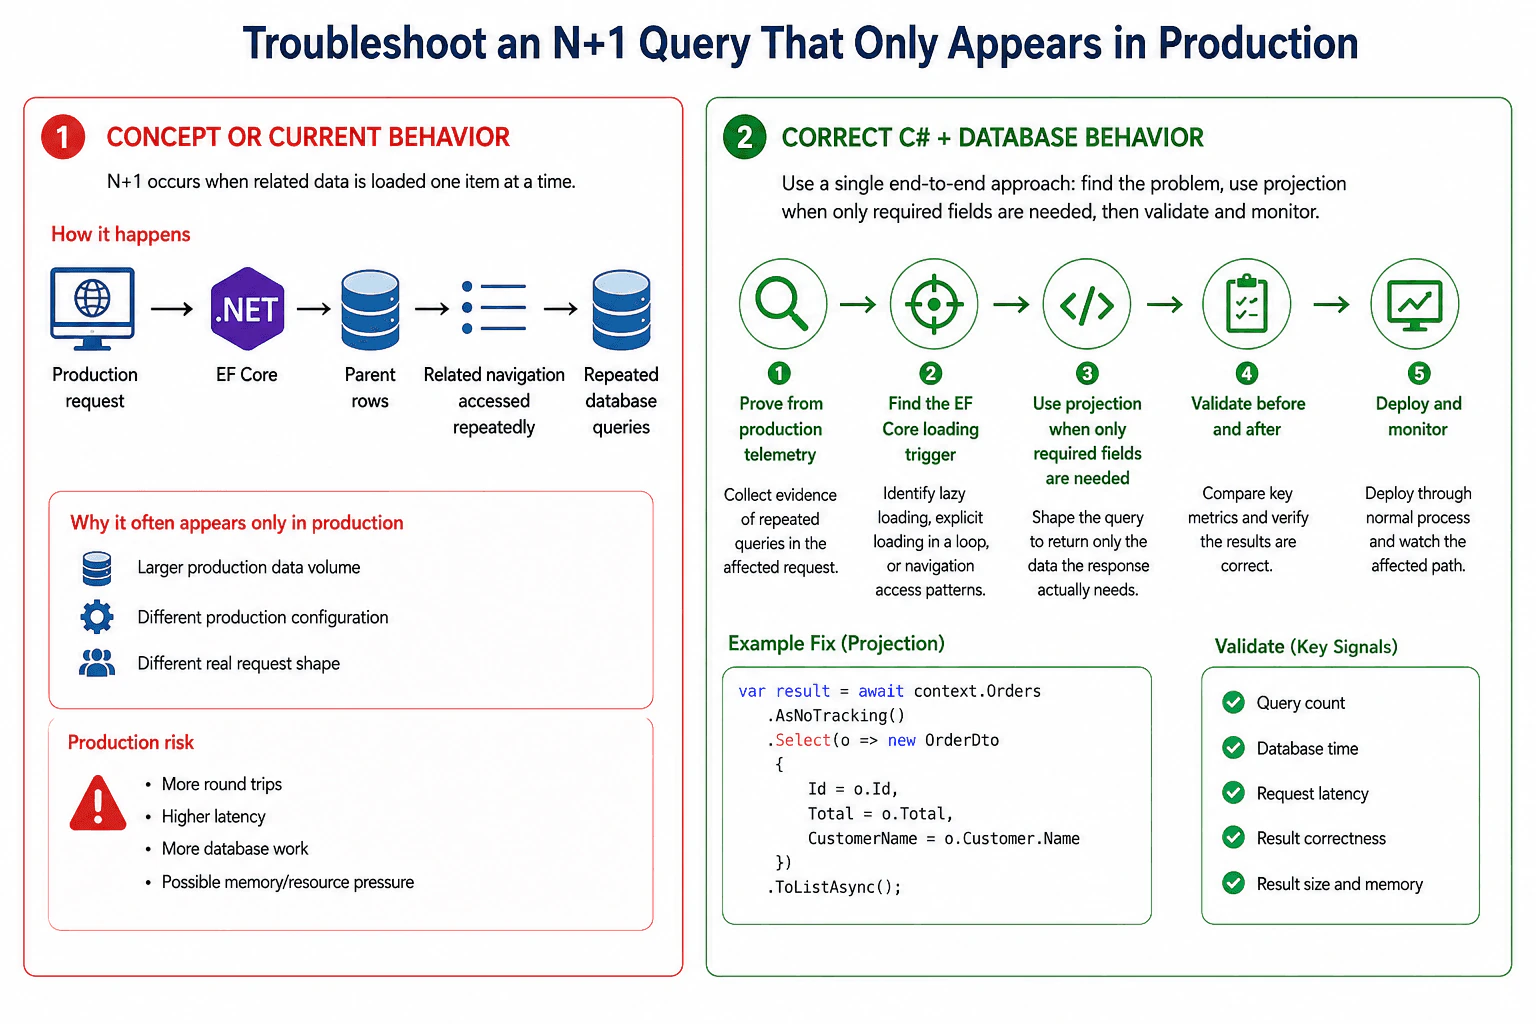
Explain the root cause analysis, the production risk, the mitigation options, and how you would validate the fix.
Short Interview Answer (30-60 seconds)
I would prove the N+1 pattern from production telemetry, find the code path causing repeated loading, and compare production data and configuration with lower environments. In EF Core, I would review lazy or explicit loading and query shaping, apply the smallest safe fix, then validate query count, latency, database time, correctness, and memory use.
Detailed Explanation
This question asks how you would find and fix a problem where one request causes many repeated trips to the data store, but you cannot reproduce it on your own machine. The interviewer wants to see whether you can compare testing with production, find the part of the application causing the extra work, judge the effect on speed and capacity, choose a safe fix, and prove the fix worked. You should investigate with evidence instead of guessing and avoid treating more hardware as the only solution.
Useful Questions to Ask the Interviewer
What production evidence shows that repeated database commands belong to one affected request?
Does the problem depend on production data volume, request shape, configuration, or EF Core loading behavior?
Is the affected EF Core path using lazy loading, explicit loading, eager loading, or projection?
How to Explain It in an Interview
I would start with evidence, not a code change. An N+1 query pattern means one logical operation first loads a set of parent rows and then causes an additional query for each parent or group of parents. For example, loading 100 orders and then separately loading related customer information for each order can produce 101 database commands when the relationships are loaded one at a time.
1. Prove the production pattern
I would inspect production request traces and database telemetry for one affected operation. I want to know the database command count, repeated SQL shape, duration, and relationship to the same application request. I would correlate the database activity with the request so that several independent requests are not incorrectly classified as one N+1 problem.
Because the problem occurs only in production, I would compare production and lower environments for data volume, request shape, feature flags, EF Core configuration, and loading behavior. Small or unrealistic test data can hide the cost of repeated queries.
2. Find the application trigger
With EF Core, I would inspect navigation-property access and loading configuration. Possible causes include lazy loading, explicit loading inside a loop, or code that loads a parent collection and then accesses a related navigation property separately for each item.
I would trace the code path from the request to the database command and identify the exact statement or behavior that triggers the repeated queries. The goal is to explain why the additional database work happens, not merely observe that many queries exist.
3. Choose the mitigation
The correct fix depends on the data the operation actually needs.
If the response needs related data for the whole result set, I might use eager loading with Include or, when only selected fields are required, a projection into the response shape. Projection can avoid loading complete entity graphs and can make the required data explicit.
If related data is genuinely optional, controlled explicit loading may be appropriate, but it should not be repeated unintentionally inside a loop. Lazy loading is convenient, but it makes database access implicit and can cause N+1 behavior when navigation properties are accessed repeatedly. I would review whether it is appropriate for the affected request path.
I would not assume that Include is always the best solution. Depending on the EF Core query and configuration, related data may be loaded as part of a single SQL statement or through split-query behavior. A large joined query can also return duplicated row data, while splitting queries can add round trips. The choice should be based on the required result shape and measured behavior.
4. Validate the fix
I would test with a realistic production-shaped data volume and request pattern. Before and after the change, I would compare database command count, total database time, request latency, result correctness, result size, and application memory behavior.
A reduction in query count alone is not enough. A single query can still be inefficient if it returns substantially more data than needed or creates a large intermediate result. Conversely, multiple queries are not automatically wrong when they are deliberate and efficient. The objective is to remove unnecessary repeated work while keeping the query shape appropriate.
5. Deploy and monitor safely
Because the issue is production-specific, I would use existing observability and controlled diagnostics rather than adding expensive logging to every request. After deployment, I would monitor the affected request path and compare the relevant production metrics with the baseline.
I would also verify that the fix did not create a different bottleneck, such as a much larger result set or higher memory use. If production and lower environments differ materially, I would capture the relevant configuration and data-shape differences so the problem is less likely to reappear.
Key reasoning
The strongest approach is to prove the repeated database work, locate the exact EF Core loading behavior that causes it, shape the data access around what the operation actually needs, and verify the operational result after the change. The fix should be based on measured evidence and preserve correctness.
Assumptions and tradeoffs
I am assuming EF Core is the relevant data-access technology because the topic is Database And Ef Core. The same diagnostic sequence also applies to other data-access approaches, but the specific loading mechanisms differ.
The main production risk is unnecessary database work that grows as the number of related records grows. The main mitigation tradeoff is that reducing round trips can increase the amount of data returned or processed in each database operation. Eager loading, projection, explicit loading, and split-query behavior each have different query-shape and memory tradeoffs, so I would measure the actual workload rather than choosing solely by query count.
Technical Approach
Select one affected production request and correlate its application and database telemetry.
Confirm that the repeated database commands belong to the same logical operation and form an N+1 pattern.
Compare production data volume, request shape, configuration, and EF Core loading behavior with lower environments.
Locate the exact navigation access, loop, or loading behavior that triggers the repeated commands.
Choose the smallest appropriate fix, such as projection, eager loading, controlled explicit loading, or an appropriate query-shape change.
Validate command count, database time, request latency, result correctness, result size, and memory behavior.
Deploy through the normal production process and monitor the affected path after the change.
Practical Insights
N+1 work can turn one logical request into many database round trips, and the number of commands can grow with the number of parent rows being processed. Removing unnecessary repeated queries can reduce round-trip overhead and database work, but a replacement query can use more CPU, memory, network bandwidth, or result-row processing if it returns too much data. Split queries can intentionally use multiple database commands and may avoid some large joined-result problems, so query count by itself is not a complete performance measure.
Why Interviewers Ask This
This evaluates whether the candidate can diagnose a production-only database performance problem systematically, distinguish application behavior from database behavior, understand how EF Core loading patterns can create N+1 queries, evaluate production risk, choose an appropriate mitigation, and verify that the change improves performance without changing the required result.
Common interview mistakes
Common mistakes include assuming the database is slow without proving an N+1 pattern, changing code before inspecting production evidence, ignoring differences in data volume or configuration, assuming Include is always the correct fix, treating lazy loading as harmless because the code looks simple, measuring only query count while ignoring result size and memory use, overlooking intentional split-query behavior, and declaring success without comparing before-and-after production behavior.
Interview tip
Lead with evidence. Explain how you would prove the repeated commands belong to one production request, identify the EF Core loading trigger, choose the query shape based on the data actually required, and validate both performance and correctness after deployment.
Interviewer may ask next
When would you prefer projection over Include for fixing an N+1 problem?
I would prefer projection when the operation needs only selected fields from the parent and related data. It makes the required result shape explicit and can avoid loading full entity graphs. Include is useful when the application genuinely needs related entities, but it can retrieve more data than the response requires.
Could fixing N+1 with one query make performance worse?
Yes. A single query can be worse if it returns substantially more data than needed, creates a large joined result, increases memory use, or causes expensive database work. Also, EF Core split-query behavior can intentionally use multiple queries. I would evaluate the complete workload rather than optimizing for query count alone.
95. When would you use more than one DbContext in a single application?Database And Ef CoreHard
i Question Details
Discuss bounded contexts, separate read and write models, separate databases, and what keeping contexts smaller does for maintainability.
Short Interview Answer (30-60 seconds)
Use more than one DbContext when the app has clear bounded contexts, separate read and write models, or separate databases. Smaller contexts improve maintainability, reduce accidental coupling, and make changes safer. I would keep one DbContext for a simple shared model.
Detailed Explanation
This question is asking when one app should use two or more separate ways to work with its stored data. The interviewer wants to know whether you can divide the app into clear parts, keep different kinds of work apart when needed, and avoid making one huge setup that is harder to understand and change. They also want to hear how you choose between one shared setup and several smaller ones as the app grows and the rules become different.
Useful Questions to Ask the Interviewer
Are different parts of the product owned by separate business areas or teams?
Do any parts need read-only access, separate write rules, or different databases?
How to Explain It in an Interview
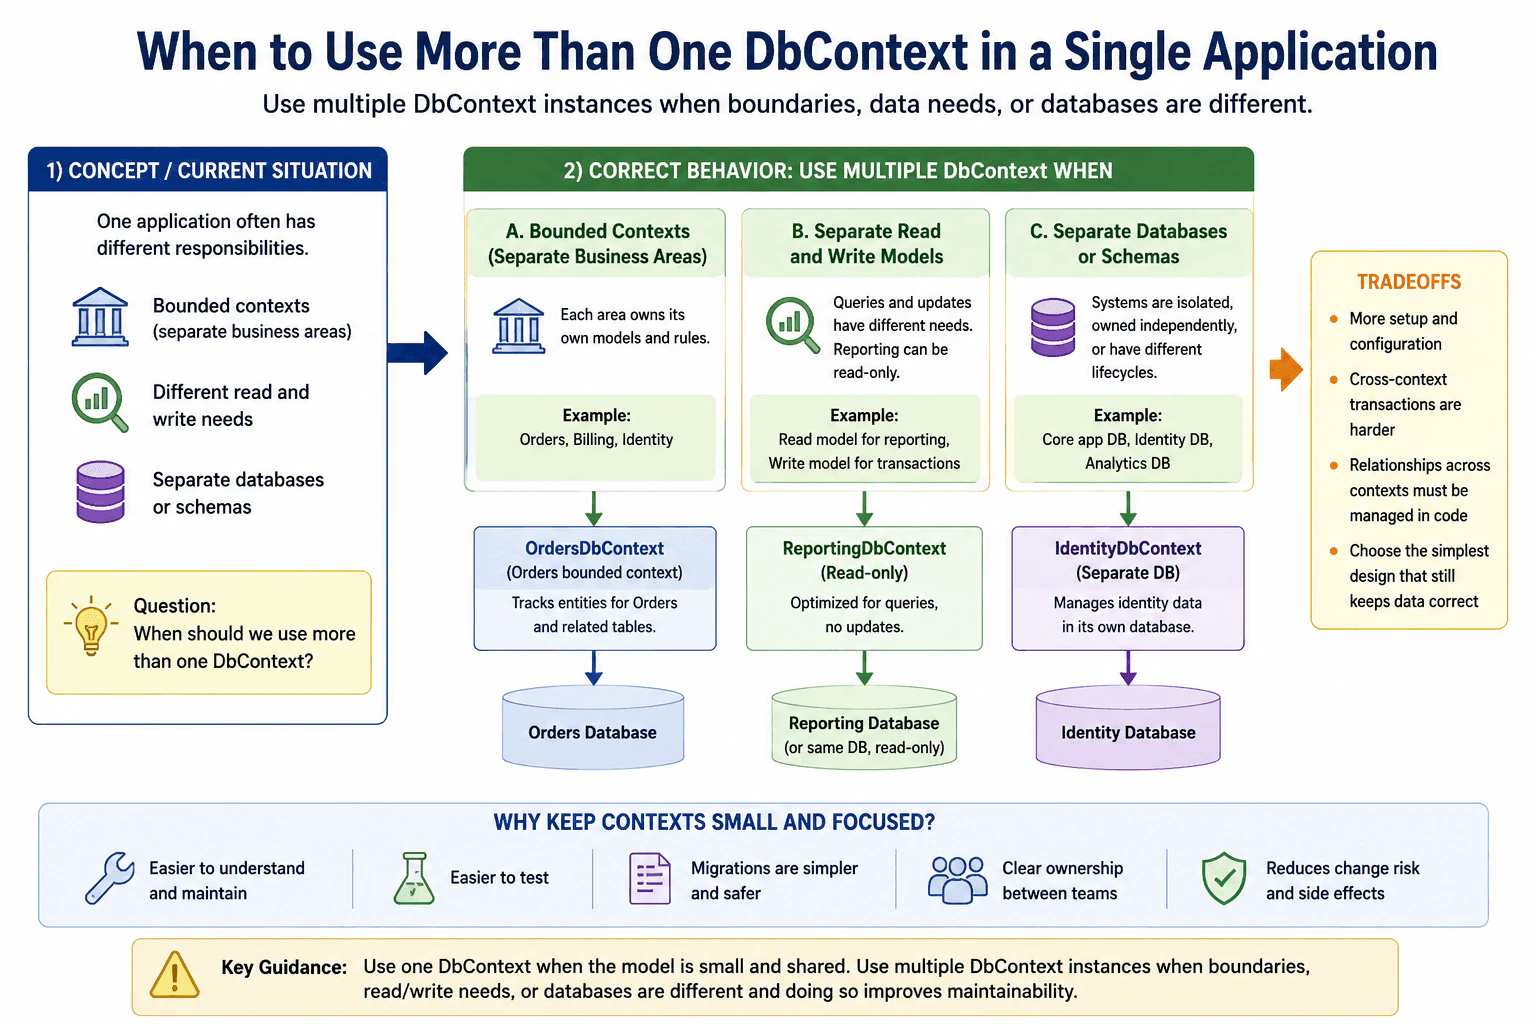
I would use more than one DbContext when the application has clear bounded contexts, meaning separate business areas with their own rules and tables, such as Orders, Billing, and Identity. I would also split read and write models when queries and updates have different needs, such as a reporting context that is read-only and a transactional context that changes data.
I would use separate DbContext instances for separate databases or schemas when the systems are intentionally isolated, owned independently, or use different lifecycles. Keeping each context smaller usually makes the code easier to understand, test, migrate, and review. It also reduces change risk because one feature is less likely to affect unrelated tables. The tradeoff is more setup and more care with transactions, relationships, and shared data. If one business action must update several contexts together, I would be careful, because cross-context consistency is harder to maintain. In that case, I would prefer the simplest design that still keeps the data correct.
Technical Approach
Identify the business areas in the app and decide whether each area has its own rules, tables, or ownership.,Keep one DbContext when the model is small, shared, and easy to understand.,Split into multiple DbContexts when bounded contexts are clear, when read and write models differ, or when databases are separate.,Keep each DbContext small and focused so migrations, testing, and code reviews stay simpler.,Review transaction and consistency needs carefully when one operation touches more than one context.
Practical Insights
More DbContexts usually mean a little more setup, more files, and more care with transactions and coordination. In return, each context is smaller, easier to read, and easier to change. If you split too much, cross-context work becomes harder.
Why Interviewers Ask This
They want to see whether you can split EF Core work by business boundaries, keep read and write concerns separate when needed, and choose multiple contexts only when they improve maintainability, ownership, or database isolation.
Common interview mistakes
Splitting DbContexts without a real boundary; mapping the same entities in several contexts without ownership rules; assuming one transaction can automatically cover separate databases; using multiple contexts just for style instead of a clear need.
Interview tip
Answer with a practical rule: one context for one clear model, more than one when boundaries, ownership, or database needs are different.
Interviewer may ask next
Can two DbContexts share the same database?
Yes. Two DbContexts can use the same database if they model different parts of the system. That is useful when you want separate ownership or simpler code, but still keep one physical database. I would avoid mapping the same tables in two contexts unless the design is very deliberate.
When should you avoid multiple DbContexts?
I would avoid multiple DbContexts when the app is small, the data model is mostly shared, and there is no real boundary between features. In that case, one DbContext is simpler, easier to maintain, and less risky than adding extra structure too early.
96. What is the lifetime of a DbContext, and why does it matter?Database And Ef CoreEasy
i Question Details
Explain the usual request-scoped lifetime, what happens if the context lives too long, and why that changes tracking and concurrency behavior.
Short Interview Answer (30-60 seconds)
A DbContext should usually be short-lived, typically one per web request or unit of work. Keeping it alive too long causes stale tracked data, higher memory use, and unsafe concurrency behavior because DbContext is not thread-safe.
Detailed Explanation
This question asks how long you should keep the same database helper open and why that choice matters. In simple terms, you should usually use a fresh one for each job or request, then close it when the work is done. If you keep it around too long, it can remember old information, use more memory, and make later updates behave in surprising ways. It can also cause conflicts when more than one person changes the same data at about the same time.
Useful Questions to Ask the Interviewer
Do you want the answer for a web request, a background job, or a long-running service?
Are you using AddDbContext, AddDbContextPool, or DbContextFactory?
How to Explain It in an Interview
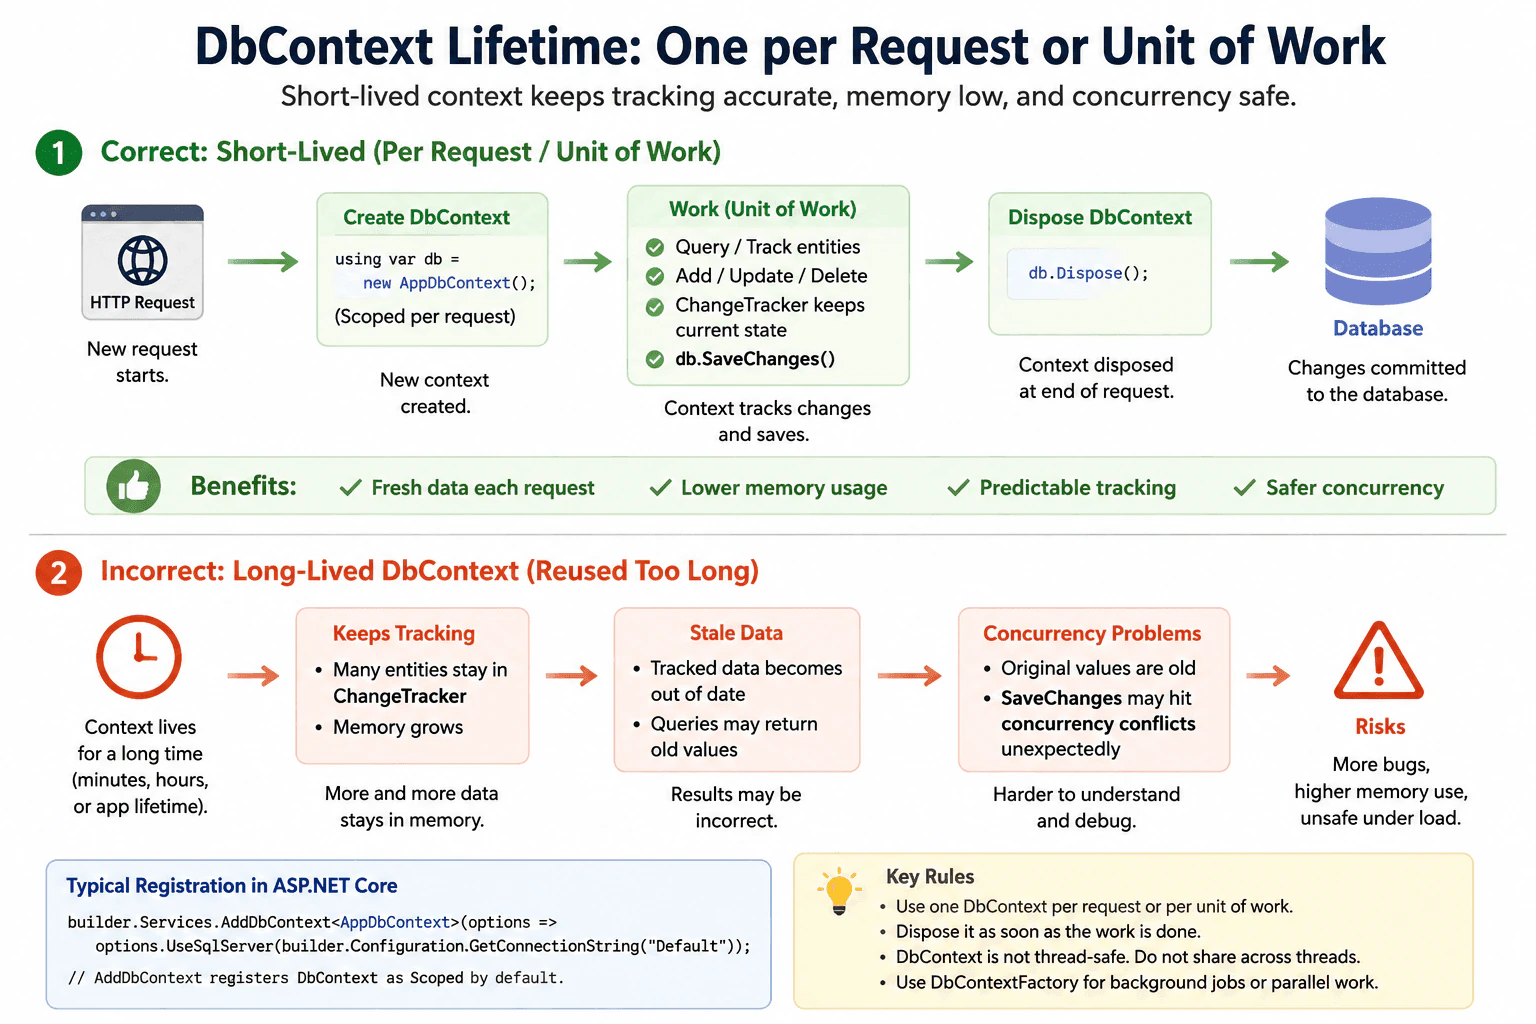
The usual answer is: one DbContext per request, or more generally, one DbContext per unit of work. In ASP.NET Core, AddDbContext registers DbContext as scoped by default, which means one instance is created for a request and disposed when that request ends. That is the normal and safest pattern.
Why it matters: DbContext tracks entities in memory through the change tracker. If the context lives too long, it can keep stale entities, grow in memory, and return old values instead of fresh ones. It is also not thread-safe, so sharing one instance across parallel work can break behavior. Long-lived contexts can make optimistic concurrency conflicts harder to reason about because the tracked state may be older than the database state.
Good practice is to keep the context short-lived, use a new one for each independent operation, and use a DbContextFactory or scoped lifetime for background work when needed. That keeps tracking accurate, keeps memory lower, and makes SaveChanges predictable.
Technical Approach
Register DbContext with the normal scoped lifetime for a web app.,Create one context for one request or one unit of work.,Dispose the context as soon as the work is finished.,Use a DbContextFactory or a new context instance for background or independent jobs.,Never share one DbContext across threads or parallel tasks.
Practical Insights
A short-lived DbContext uses less memory and keeps tracking simple. A long-lived context uses more memory, becomes slower to manage, and can hold stale data. The main cost is not CPU time alone, but correctness, memory growth, and harder-to-debug update conflicts.
Why Interviewers Ask This
This checks whether the candidate knows the normal EF Core usage pattern, understands that DbContext is a short-lived unit-of-work object, and can explain the real risks of stale tracking, memory growth, and unsafe reuse in production.
Common interview mistakes
A common mistake is treating DbContext like a singleton and reusing it for the whole app. Another mistake is sharing one instance across threads. Candidates also forget that long-lived tracking can return stale data and make updates harder to predict.
Interview tip
Say the rule first: one DbContext per request or unit of work. Then add the two reasons interviewers care about most: it is not thread-safe, and long-lived tracking can lead to stale data and confusing concurrency behavior.
Interviewer may ask next
How is DbContext lifetime usually configured in ASP.NET Core?
It is usually registered as scoped with AddDbContext, so each HTTP request gets one DbContext instance. The framework disposes it after the request finishes.
When should I use DbContextFactory instead of a scoped DbContext?
Use DbContextFactory when you need to create DbContext instances on demand, such as in background services, parallel work, or code that is not naturally tied to one HTTP request.
97. What are the most common ASP.NET Core interview questions in 2026?Debugging And DiagnosticsEasy
i Question Details
Explain how you would isolate the failure, which runtime or observability clues matter, and how you would prevent the issue from recurring.
Short Interview Answer (30-60 seconds)
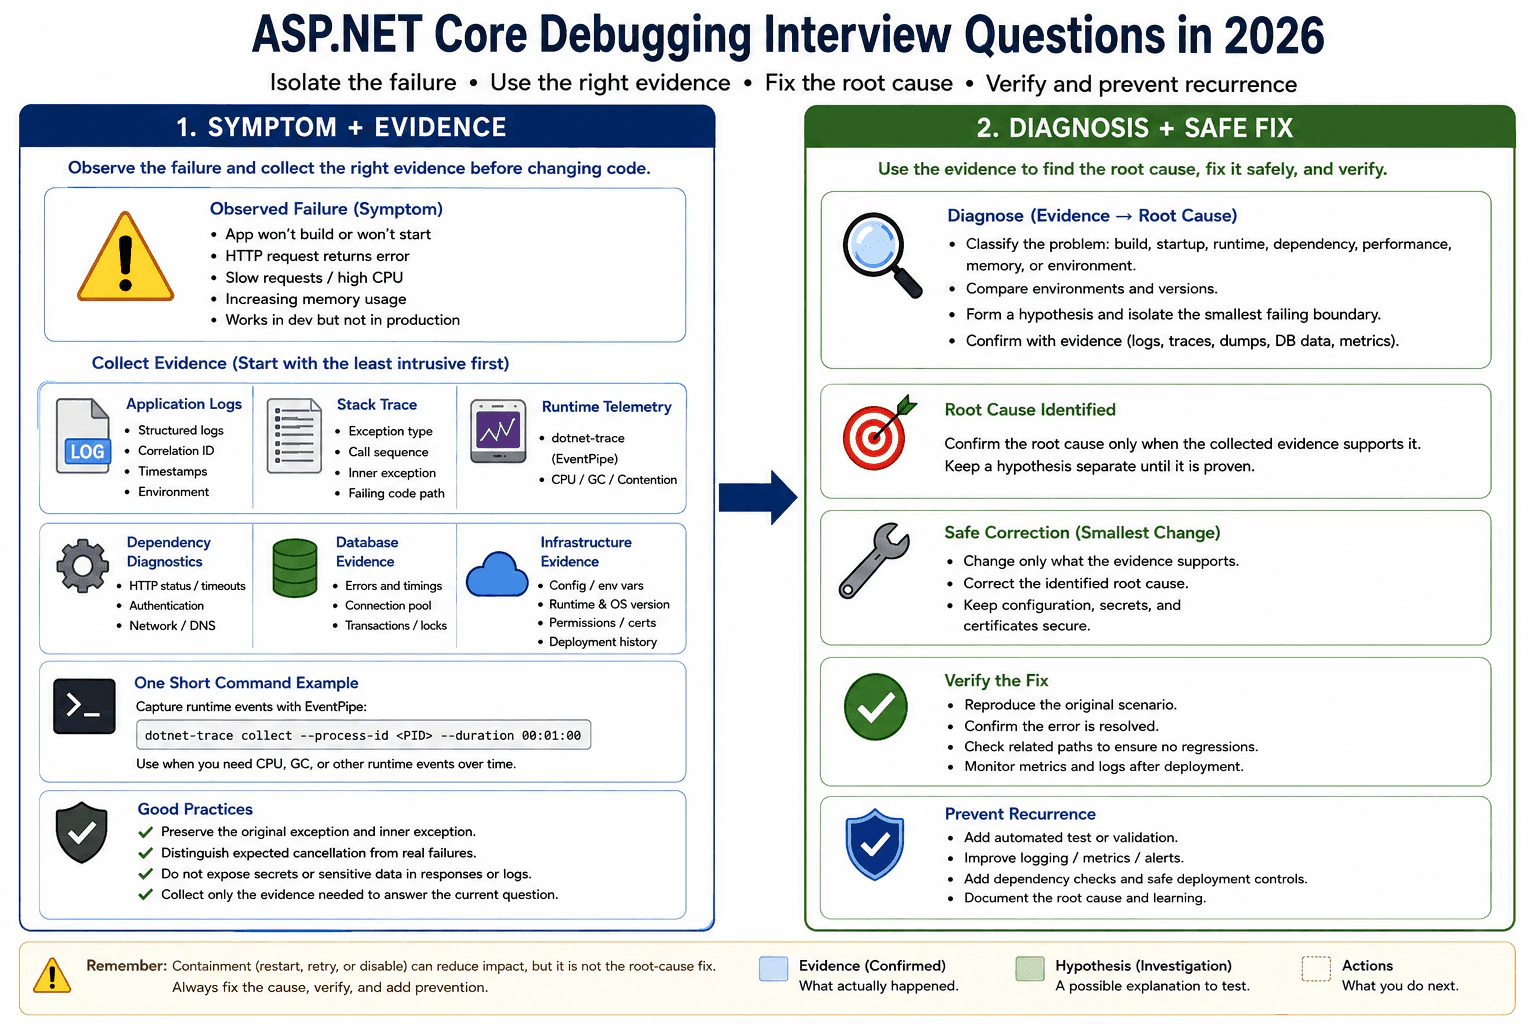
Common questions cover startup failures, request exceptions, failed builds, dependency problems, environment differences, slow requests, high CPU, memory growth, and assembly-loading errors. I answer them with one process: reproduce, scope, classify, collect evidence, isolate, fix the root cause, verify, and prevent regression.
Detailed Explanation
ASP.NET Core interviews commonly ask what you would do when an application will not start, a web request fails, the application becomes slow, memory keeps growing, a dependency stops responding, or a problem happens only after deployment. The interviewer is usually checking how you solve an unfamiliar problem, not whether you can guess the answer immediately. A good response shows that you first make the problem repeatable, learn how much of the system is affected, gather facts, narrow the failure to one area, correct the real cause, confirm the problem is gone, and add protection against the same failure returning.
Useful Questions to Ask the Interviewer
Is the failure happening during restore or build, application startup, request processing, background processing, or shutdown?
Does the issue affect every request and instance, or only certain inputs, machines, environments, or deployments?
What evidence is available, such as build diagnostics, logs, stack traces, traces, dumps, database information, or deployment history?
Did the problem begin after a code, package, configuration, runtime, infrastructure, or dependency change?
Should I explain both short-term containment and the permanent root-cause fix?
How to Explain It in an Interview
The most common ASP.NET Core debugging questions can be grouped into a few practical scenarios.
"How would you debug an ASP.NET Core application that does not build?" Start with the compiler, .NET SDK, NuGet restore, and MSBuild output. A compiler diagnostic points to invalid C# or a type-related compile-time problem. Restore failures usually involve package sources, package versions, authentication, or dependency resolution. MSBuild failures can come from project configuration, targets, references, or SDK selection. Fix the first meaningful error rather than reacting to every later error because many later messages can be consequences of the first failure.
"How would you debug an ASP.NET Core application that builds but does not start?" Reproduce the startup failure and inspect host startup logs and the original exception. Check configuration binding, dependency-injection construction, required files, certificates, permissions, ports, environment variables, runtime availability, and external dependencies when the evidence points to them. If the failure is a type-loading or missing-member error, compare the deployed assemblies and package versions because incompatible binaries can compile successfully in one build and fail when loaded at runtime.
"How would you debug an HTTP request that returns an error?" Identify the exact request and determine whether every request fails or only particular routes or inputs. Inspect structured logs and the exception stack trace. A stack trace shows the method-call path leading to the exception. Preserve the original exception and inner exception because replacing them with a generic exception can remove valuable evidence. Correlate the failure with database or external-service evidence when the request depends on those systems.
"How would you debug an issue that happens only in production?" Compare the failing environment with a working environment. Check deployed assemblies, package versions, configuration, environment variables, runtime versions, operating-system behavior, permissions, certificates, network access, database connectivity, and external services. Avoid assuming that code is different until the evidence proves it. Collect production diagnostics safely and never expose secrets, tokens, connection strings, personal information, or detailed internal errors to end users.
"How would you investigate slow requests or high CPU?" First confirm when the slowdown occurs and whether it affects one endpoint, one instance, or the whole application. Check request timing, dependency timing, database evidence, and runtime metrics. If normal logs are insufficient, dotnet-trace can collect EventPipe events from the .NET runtime and application. EventPipe is the runtime event-collection infrastructure used by several .NET diagnostic tools. A trace can help investigate CPU usage, garbage collection, contention, and other runtime activity without immediately taking a full memory dump.
"How would you investigate a hanging application?" Determine whether requests are waiting, deadlocked, blocked on a dependency, or simply slow. A managed stack dump can show what managed threads are executing or waiting on at a moment in time. Examine repeated or blocked stacks and correlate them with application logs and dependency behavior. Do not assume that every wait is a deadlock; asynchronous I/O often waits normally while work is in progress.
"How would you investigate increasing memory usage?" First determine whether memory growth is temporary, caused by normal load, or continues across comparable workloads. Check garbage-collection and process-memory evidence. If necessary, capture an appropriate heap dump and inspect which objects consume or retain memory. A heap dump is useful for object-retention analysis, but it can be large and contain sensitive application data, so collection and storage must be controlled carefully.
"How do you distinguish cancellation from a failure?" In asynchronous ASP.NET Core code, a request can be canceled because the client disconnected, a timeout occurred, or a supplied cancellation token was canceled. Preserve and propagate cancellation correctly rather than automatically treating every OperationCanceledException as an application defect. Determine which cancellation token was involved and whether cancellation was expected for that operation.
"When would you use logs, stack traces, dumps, or traces?" Use the smallest diagnostic source that can answer the current question. Logs provide chronological application evidence. Stack traces show the call path of an exception. A managed stack dump helps inspect thread execution and waiting states. A heap dump is appropriate for memory-retention investigation. dotnet-trace and EventPipe are useful when runtime events over a period of time are more informative than a single snapshot. More invasive or larger diagnostics should not be the automatic first step.
"How do you know that a debugging fix is complete?" Separate containment from root-cause correction. A restart, retry, feature disablement, or traffic reduction may temporarily reduce impact, but it does not prove the cause is fixed. After correcting the identified cause, repeat the original reproduction steps, verify normal behavior, check nearby scenarios for regressions, and add an appropriate automated test, validation rule, diagnostic signal, deployment check, or monitoring improvement.
A strong interview answer therefore follows one reusable sequence: reproduce, establish scope, classify the failure, collect evidence, form a hypothesis, isolate the smallest failing boundary, correct the root cause, verify the original scenario, and prevent recurrence. The important point is that the diagnostic tool follows the evidence. You should not start with a heap dump, trace, database investigation, or configuration change unless the observed failure gives you a reason to investigate that area.
Technical Approach
Reproduce the exact problem when possible and record the triggering conditions.
Define the scope across requests, instances, environments, users, versions, and recent changes.
Classify the problem as a compiler, SDK, NuGet restore, MSBuild, assembly-loading, ASP.NET Core hosting, runtime exception, fatal-process, performance, memory, database, operating-system, or external-service failure.
Collect the smallest useful evidence, usually beginning with build output, logs, and stack traces.
Escalate only when justified to EventPipe or dotnet-trace data, managed stack dumps, heap dumps, database evidence, or deeper environment comparison.
Preserve original exception causes and distinguish expected cancellation from actual failures.
Build a hypothesis from the evidence and isolate the smallest failing boundary.
Apply temporary containment separately if service stability requires it.
Correct the root cause.
Repeat the original reproduction scenario, verify related behavior, and add regression prevention.
Practical Insights
This debugging process does not have a useful Big-O time or memory complexity because it is an operational investigation rather than an algorithm. The important costs are diagnostic overhead, storage, analysis time, and production risk. Normal logs and targeted metrics are usually cheaper than broad traces or dumps. Runtime tracing can add processing and storage overhead depending on the enabled providers and event volume. Stack dumps and especially heap dumps can be costly to capture, transfer, secure, and analyze. Heap dumps may also contain sensitive application data. Good observability, automated tests, and narrow evidence collection reduce future investigation and maintenance cost.
Why Interviewers Ask This
Interviewers use this question to test practical ASP.NET Core troubleshooting judgment rather than memorized definitions. They want to know whether you can distinguish build, runtime, hosting, dependency, environment, performance, and memory failures; select appropriate evidence; avoid guessing; preserve useful exception information; separate temporary containment from the permanent fix; and verify that the problem will not return.
Common interview mistakes
Common mistakes are guessing before reproducing the problem, ignoring the first meaningful build error, treating every problem as an ASP.NET Core defect, changing several variables at once, reading only the final exception message instead of the stack trace and underlying cause, destroying useful exception context when rethrowing, treating expected cancellation as a normal application error, collecting a large dump before checking simpler evidence, assuming production and development are equivalent, overlooking package or assembly-version mismatches, ignoring database or external-service evidence, swallowing exceptions, exposing sensitive diagnostics to users, confusing a restart or workaround with a root-cause fix, making unsupported performance or memory conclusions from a single snapshot, and declaring success without repeating the original failing scenario.
Interview tip
Organize the answer around evidence rather than tool names. State the failure category, explain the first evidence you would collect, show how that evidence narrows the next step, distinguish containment from the root-cause fix, and finish with verification and regression prevention.
Interviewer may ask next
When should you use logs, a stack trace, dotnet-trace, a managed stack dump, or a heap dump?
Start with the least intrusive evidence that can answer the question. Use logs for chronological application events and contextual fields. Use an exception stack trace to see the call path that led to a managed exception. Use dotnet-trace and EventPipe when you need runtime or application events over time, such as CPU, garbage collection, or contention evidence. Use a managed stack dump when you need a snapshot of what managed threads are executing or waiting on. Use a heap dump when the investigation specifically requires object-retention or memory-usage analysis. Dumps can be large and can contain sensitive information, so they should be captured and protected deliberately.
What should you do when an ASP.NET Core failure occurs only in production?
First define exactly what fails and compare production with a working environment. Check deployed assemblies, package versions, runtime versions, configuration, environment variables, operating-system behavior, permissions, certificates, network access, database connectivity, and external dependencies according to the available evidence. Use safe production logs and targeted diagnostics without exposing secrets or personal data. Reproduce equivalent conditions in a controlled environment when possible. If temporary containment is required, identify it as a workaround rather than the fix. After correcting the root cause, verify the original production scenario and add an appropriate test, deployment check, metric, alert, or diagnostic improvement to reduce recurrence.
98. What is HttpContext and how long does it live in ASP.NET Core?Debugging And DiagnosticsEasy
i Question Details
Explain the request-bound lifetime, what data it carries, and why capturing it beyond the request can cause disposal errors.
Short Interview Answer (30-60 seconds)
HttpContext is the request-specific object in ASP.NET Core. It carries the request, response, user, items, headers, and connection data. It lives only for the current HTTP request and should not be stored or used after the request ends.
Detailed Explanation
Imagine a website handling one visit from one person. During that visit, the app keeps a short-lived note about what the person asked for and how to reply. This question asks what that note is, what information it contains, and how long the app keeps it. It also asks why trying to save that note for later can break the app after the visit is over. The safe idea is simple: use the note only while the visit is happening, then copy out anything you still need.
Useful Questions to Ask the Interviewer
Are you asking about reading HttpContext inside controllers, middleware, or background services?
Do you want the lifetime rules, the common failure modes, or both?
How to Explain It in an Interview
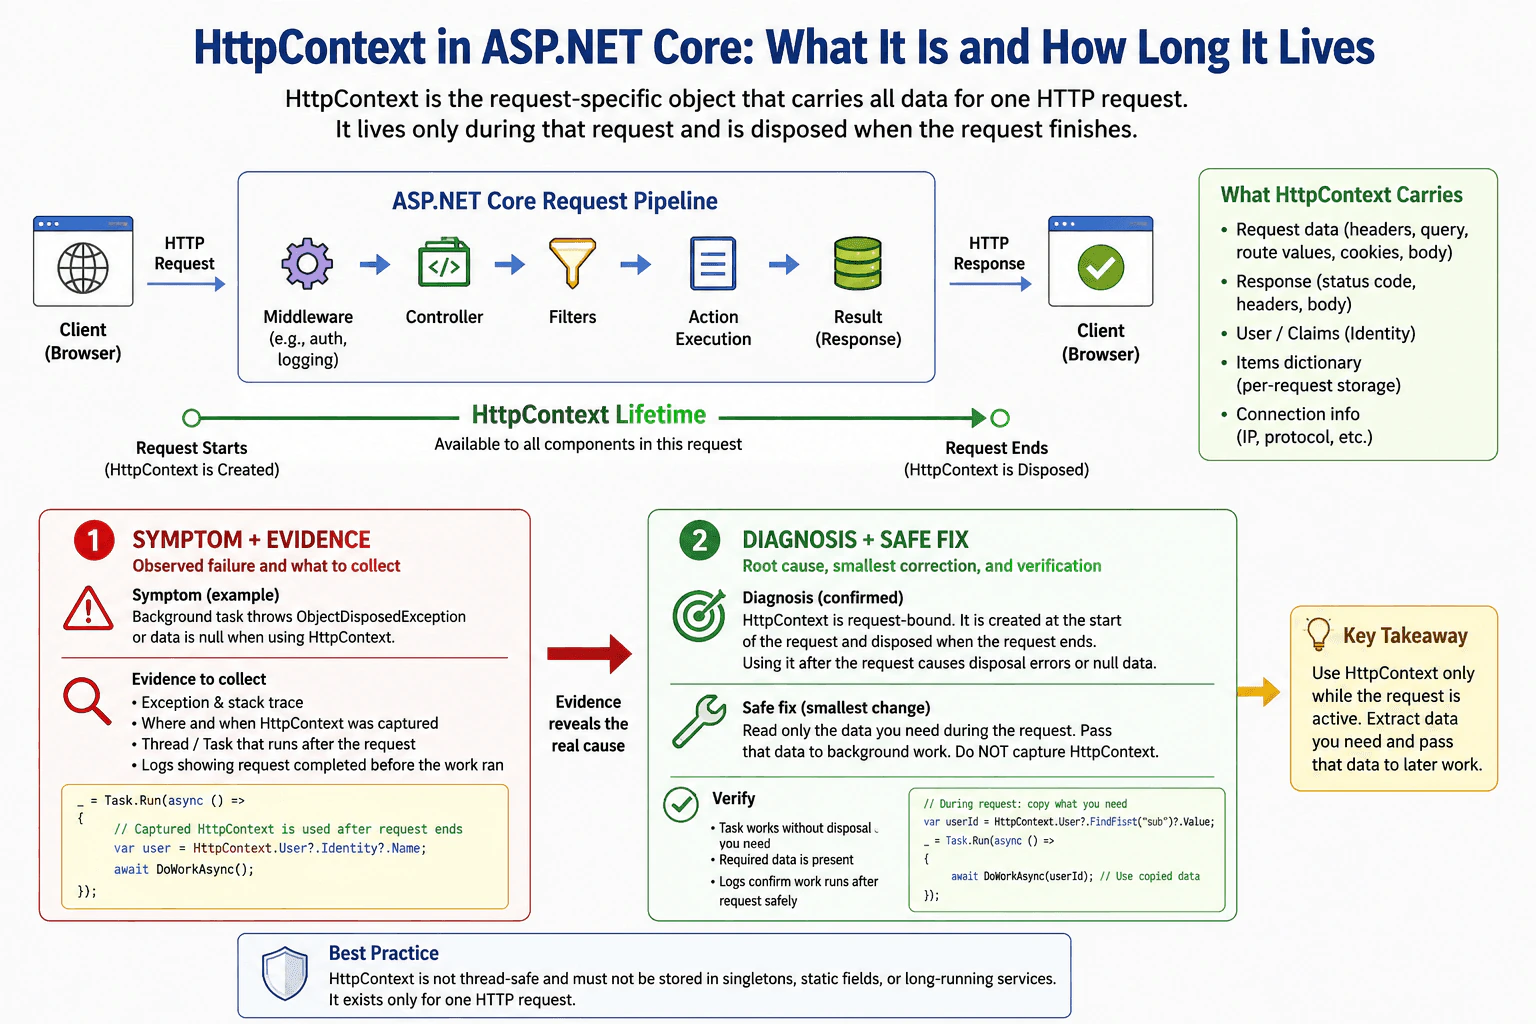
HttpContext is the ASP.NET Core object that represents one HTTP request and response. It carries request data such as headers, route values, query string, cookies, form data, the authenticated user, response data, and per-request storage through Items.
Its lifetime is only the current request. ASP.NET Core creates it at the start of the request and disposes it when the request ends. That means you should use it only during the request pipeline. If you capture it in a singleton, a background thread, or a task that runs later, you can get disposal errors or null data because the request has already finished.
The practical rule is: read what you need from HttpContext during the request, copy only the data you need, and pass that copied data to later work instead of passing HttpContext itself.
For example, in middleware or a controller action, using HttpContext is normal. In background services, hosted services, or fire-and-forget tasks, it is the wrong object to keep. If later work needs user identity, correlation id, or tenant id, extract those values first and store them in your own model.
That shows good debugging judgment because you separate request-bound state from long-lived application state.
Technical Approach
Identify where the code reads HttpContext.
Confirm whether the code runs inside the active request.
Check whether any reference is stored in a singleton, static field, or background task.
Copy only the needed values out of HttpContext.
Pass copied data to later work.
Verify the bug by reproducing the request and checking for disposal or null access.
Practical Insights
Time cost is low because the check is mostly about understanding scope. Memory cost is small if you copy only the needed values. Operational cost is lower because you avoid hard-to-debug disposal errors. Maintenance cost is also lower because request data stays local and safe.
Why Interviewers Ask This
This checks whether you understand ASP.NET Core request scoping, object lifetime, and safe state access. It also reveals whether you can avoid common bugs caused by caching request-bound data, using HttpContext outside the request, or triggering disposal-related exceptions.
Common interview mistakes
A common mistake is treating HttpContext like a global object and storing it for later use. Another mistake is using it inside singleton services or background tasks. People also confuse the context itself with copied values like user id or correlation id. The safe pattern is to extract only the data you need while the request is active.
Interview tip
Say the lifetime rule first, then list the data it carries, then explain the disposal risk. A clear answer is: request-scoped object, useful during the request only, and never store it for later.
Interviewer may ask next
How do you access request data safely outside the controller?
Copy the specific values you need from HttpContext during the request, such as user id, tenant id, or correlation id, and pass those values into your service or background job. Do not pass HttpContext itself.
Why can capturing HttpContext in async work cause errors?
Because the async work may run after the request has ended. At that point the HttpContext may already be disposed, so reading it can fail or return invalid data. The fix is to extract the needed values before starting the later work.
99. What is the difference between transient, scoped, and singleton in ASP.NET Core?Debugging And DiagnosticsEasy
i Question Details
Explain the lifetime differences in terms of one request versus many requests and the bugs that appear when a longer-lived service captures a shorter-lived one.
Short Interview Answer (30-60 seconds)
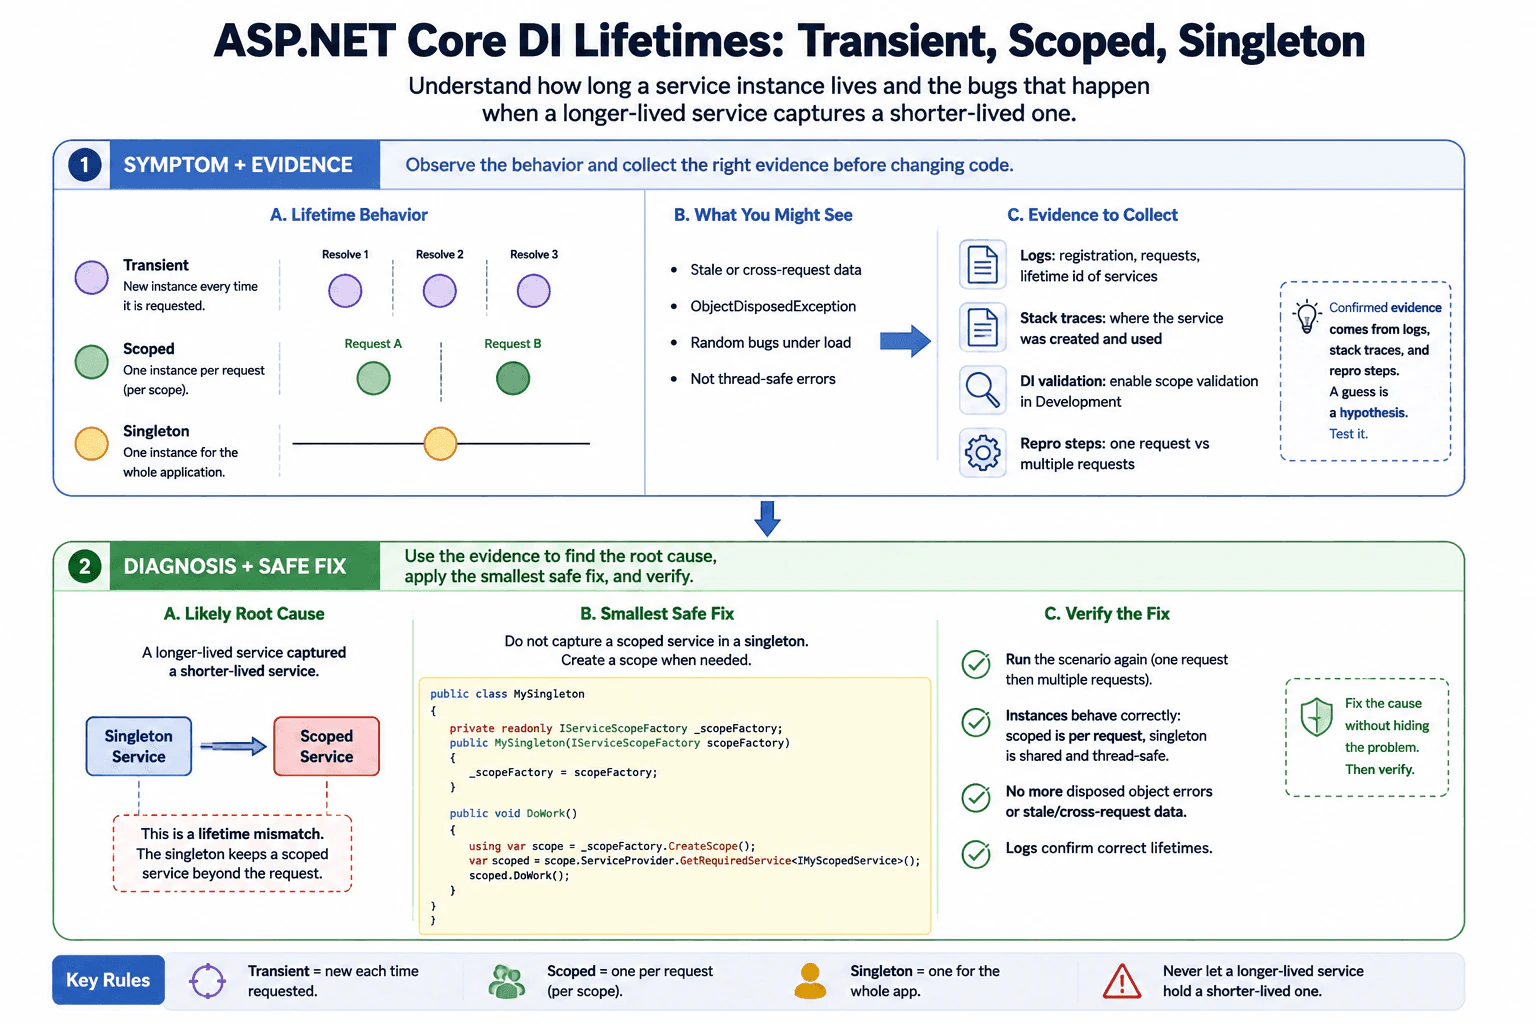
Transient is created each time it is requested. Scoped is created once per request or scope. Singleton is created once for the app. The main bug to avoid is letting a longer-lived service keep a shorter-lived dependency, which can cause stale data or disposed-object errors.
Detailed Explanation
This question is about how long the app keeps a helper object before making a new one. One kind is made fresh each time it is needed. Another stays the same during one web request, then can change for the next request. A third stays alive for the whole app. The interviewer also wants to know what goes wrong when a long-lived helper keeps a shorter-lived one, because that can cause stale data, disposed objects, or bugs that are hard to trace.
Useful Questions to Ask the Interviewer
Is this service used during a web request, a background job, or both?
Does the service hold user-specific or request-specific data?
How to Explain It in an Interview
I would start with the practical rule: choose the lifetime based on how long the service state should live.
Transient means a new instance is created every time the service is requested. Use it for small, stateless helpers.
Scoped means one instance is shared for one scope, and in ASP.NET Core web apps that is usually one HTTP request. Use it for request-specific work, such as a unit of work or DbContext.
Singleton means one instance is created for the whole application. Use it only for thread-safe, shared, mostly stateless services.
The important bug is lifetime mismatch. A longer-lived service should not keep a shorter-lived one. For example, a singleton that captures a scoped service can end up holding stale request data, using an object after it was disposed, or sharing unsafe state across requests. In Development, ASP.NET Core scope validation often catches this. In production, the bug may show up as random failures or wrong data.
My assumption is that the question is about ASP.NET Core's built-in dependency injection. The tradeoff is simple: singleton gives the least allocation cost, transient gives the most isolation, and scoped is the middle ground that fits request work well.
A good interview summary is: transient = new each time, scoped = once per request, singleton = once per app; never let a longer-lived service directly depend on a shorter-lived one.
Technical Approach
Reproduce the problem with a request or two.
Check the DI registrations for each service lifetime.
Trace the dependency chain from longer-lived to shorter-lived services.
Look for stale data, disposed-object errors, or thread-safety symptoms.
Fix the lifetime mismatch or create the scoped dependency inside a scope.
Re-run the scenario and verify the bug is gone.
Practical Insights
Transient creates more objects, so it uses more allocation and garbage collection. Scoped reuses one object per request, so it balances reuse and isolation. Singleton uses the fewest objects, but it has the highest shared-state risk because one bad instance affects the whole app.
Why Interviewers Ask This
They want to see whether you understand ASP.NET Core service lifetimes, when to use each one, and how lifetime mismatches cause bugs such as stale state, disposed dependencies, and unsafe shared access.
Common interview mistakes
A common mistake is thinking transient means one per request; it actually means one per resolve. Another mistake is thinking scoped means one per app; it usually means one per request. A third mistake is putting mutable state in a singleton. The worst bug is letting a singleton or other longer-lived service capture a scoped service, which can cause disposed objects and stale request data.
Interview tip
State the lifetime in one sentence, then give one safe example and one bug example. If you mention scope validation and thread safety, your answer sounds practical and mature.
Interviewer may ask next
What happens if a singleton depends on a scoped service?
That is a lifetime mismatch. In ASP.NET Core, scope validation often throws in Development so you notice it early. If it is not caught, the singleton can keep stale or disposed state, which leads to random bugs. The fix is to redesign the service, create a scope when needed, or move the scoped work into a scoped service.
When should I choose scoped instead of transient?
Choose scoped when the service should keep the same state for one request or one unit of work. Typical examples are DbContext, request-level business services, and services that must share the same cached data during one request. Choose transient when the service is tiny, stateless, and cheap to create.
100. What is a captive dependency in ASP.NET Core?Debugging And DiagnosticsEasy
i Question Details
Focus on the specific lifetime mismatch where a singleton holds a scoped service, and explain why this turns into stale state or thread-safety failures.
Short Interview Answer (30-60 seconds)
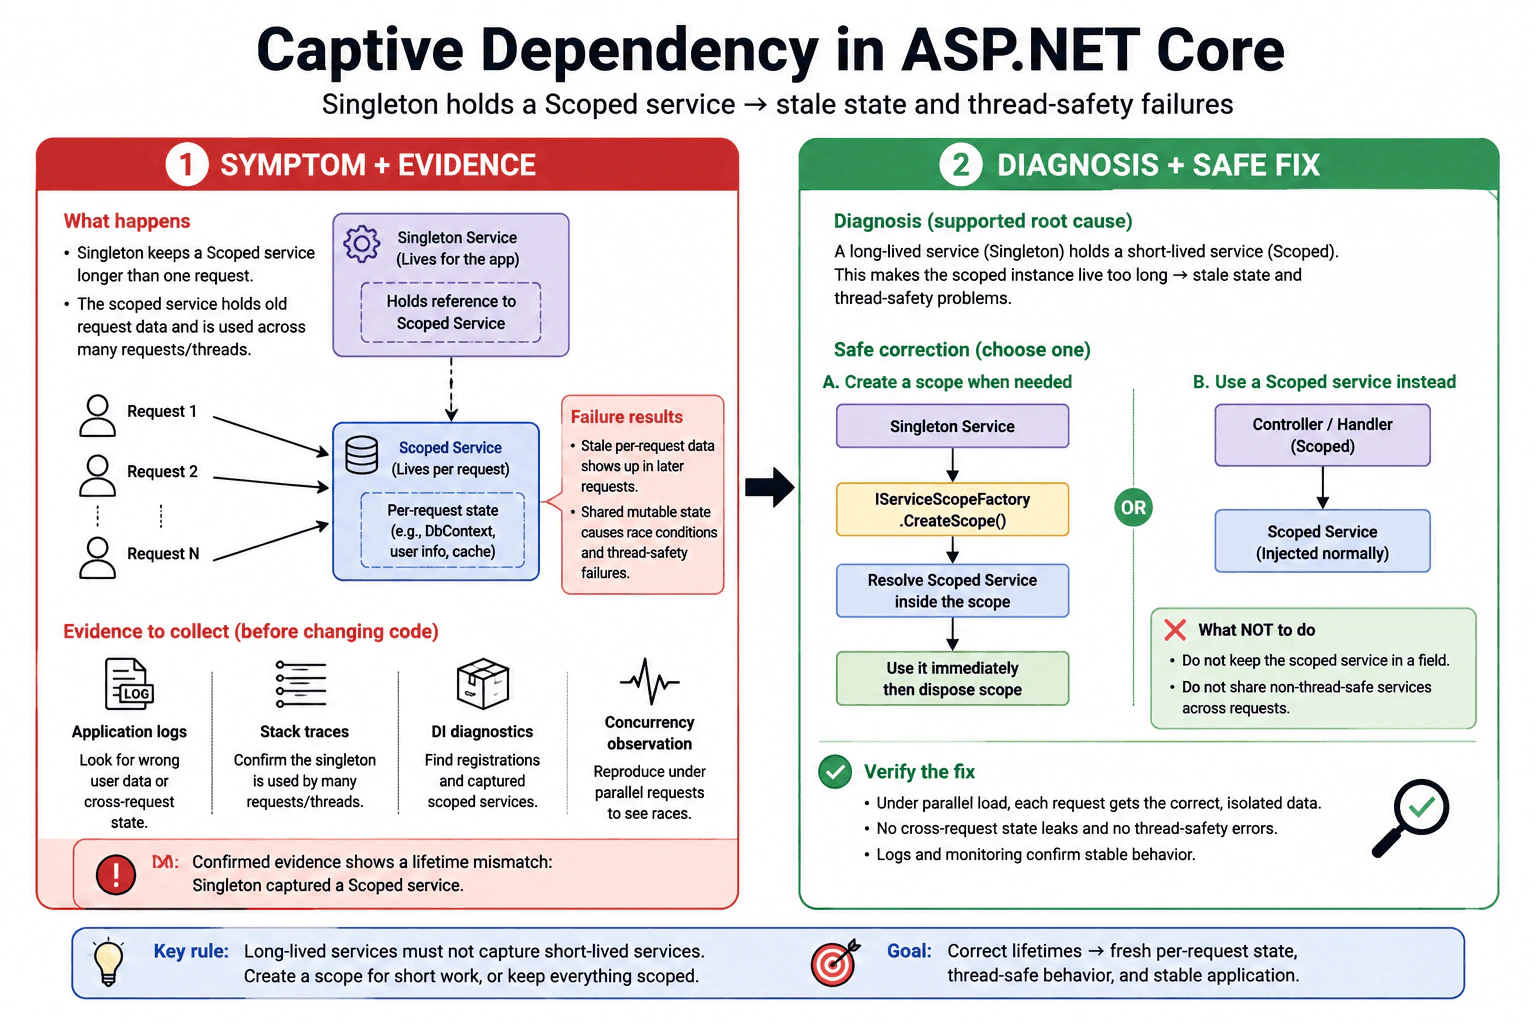
A captive dependency is when a singleton keeps a scoped service longer than intended. In ASP.NET Core, that can cause stale per-request state, shared mutable data across requests, and thread-safety bugs. The fix is to match lifetimes or create a scope when needed.
Detailed Explanation
This question asks about a mistake in how one part of a program keeps another part around for too long. One piece is meant to be short-lived and work on one job, but a longer-lived piece holds onto it after that job ends. That can make old data show up again, mix information from different users, or cause strange errors when many things happen at once. In an interview, explain what the mistake is, why it is risky, and how to avoid it safely.
Useful Questions to Ask the Interviewer
Are you asking about a singleton holding a scoped service?
Do you want the runtime bug or the DI rule?
Should I include the safest fix pattern too?
How to Explain It in an Interview
In ASP.NET Core, a captive dependency is a lifetime mismatch. A singleton is created once and kept for the whole app. A scoped service is created per request, or per scope. If the singleton stores a scoped service in a field, that scoped object becomes captive to the singleton and lives much longer than intended.
That is a problem because scoped services often hold per-request state, database contexts, or other mutable data. After the request ends, that state may be stale. If the singleton is used by many requests, the same captured object can also be touched from multiple threads, which can create race conditions and thread-safety failures.
The practical fix is to avoid injecting scoped services into singletons. Use a singleton only with singleton-safe dependencies. If a singleton really needs scoped work, create a scope with IServiceScopeFactory or move the logic into a scoped service. The rule is simple: the longer-lived service must not capture a shorter-lived one unless you create and dispose that shorter-lived scope correctly.
In the built-in container, a direct scoped-into-singleton injection is often caught early in development, but the design problem still matters anytime a singleton resolves scoped work and keeps it for later.
Technical Approach
Identify the service lifetimes involved.
Check whether a singleton stores a scoped service in a field.
Reproduce the problem under multiple requests or threads.
Look for stale request data, disposed-object errors, or race conditions.
Fix the lifetime mismatch by redesigning the dependency flow.
Verify with repeated requests and concurrency testing.
Practical Insights
Time cost is low to explain, but debugging can take time if the bug only appears under real traffic. Memory cost can increase because the scoped object stays alive too long. Maintenance cost is medium because the lifetime design must be kept consistent across the app.
Why Interviewers Ask This
To check whether the candidate understands ASP.NET Core service lifetimes, can spot lifetime mismatch bugs, and can explain why they create stale state, leaks, and thread-safety problems.
Common interview mistakes
A common mistake is thinking the scoped service is recreated automatically just because it was injected. Another mistake is ignoring thread-safety and only looking for disposed-object exceptions. People also sometimes fix the symptom by catching errors instead of correcting the lifetime mismatch.
Interview tip
Say the lifetime rule first, then explain the bug with one concrete example, then finish with the fix. Keep the answer tied to request scope, stale state, and thread safety.
Interviewer may ask next
How do you fix a singleton that needs scoped work?
Do not store the scoped service in the singleton. Create a scope with IServiceScopeFactory, resolve the scoped service inside that scope, use it immediately, and dispose the scope when the work is done. That keeps the scoped lifetime correct.
Does ASP.NET Core always throw for this?
Not always. In development, the built-in container often detects a scoped service injected into a singleton and throws early. But if the scoped service is captured indirectly, the app may still run and fail later with stale state or thread-safety bugs. So the design should still be treated as invalid.
More questions load as you scroll
Disclaimer: This interview guide is for educational and informational purposes only. It is designed to help readers prepare, but it does not guarantee any interview result, hiring decision, offer, or outcome. Interview questions, hiring criteria, and preferred answers can vary by employer, interviewer, industry, location, and time. All answers, examples, and explanations in this guide are suggested examples for interview preparation, not definitive answers or instructions for professional practice. They are based on research and judgment, are provided without warranties of any kind, and should be adapted to the question, role, and applicable laws and professional requirements. Diagrams are simplified illustrations intended to highlight the main concepts and their relationships; actual situations, systems, and practices may be more complex. Alternative approaches may be equally valid or better suited to a particular question, context, or interviewer. To the fullest extent permitted by applicable law, the contributors and publisher are not liable for decisions made, actions taken, or losses incurred based on this guide.
State Laws and Professional Responsibilities: Laws and requirements governing an occupation vary by state and jurisdiction. You are responsible for checking the current laws, licensing requirements, and scope-of-practice rules that apply to your location and role, and for ensuring that your answers and actions comply with them. Adapt examples in this guide to those requirements. This guide is not legal advice.
Content Accuracy and Verification: To the fullest extent permitted by applicable law, we do not represent or warrant that interview guides, questions, answers, examples, or diagrams are accurate, complete, current, error-free, or suitable for any particular purpose. You are responsible for independently reviewing and verifying the information before relying on it.