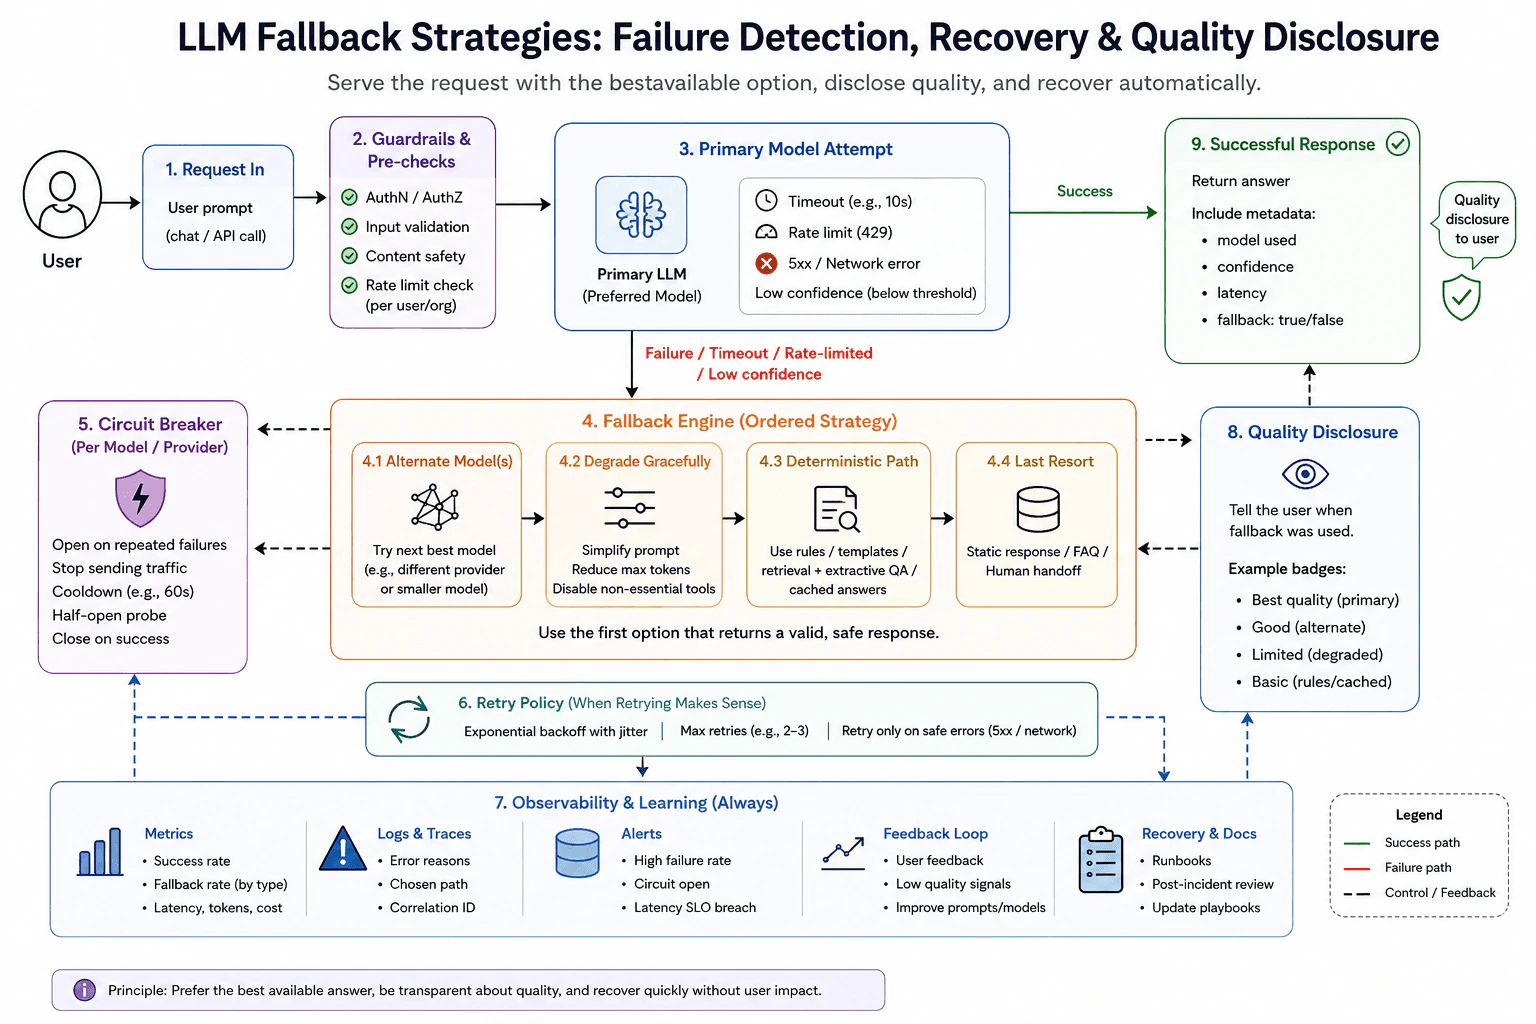
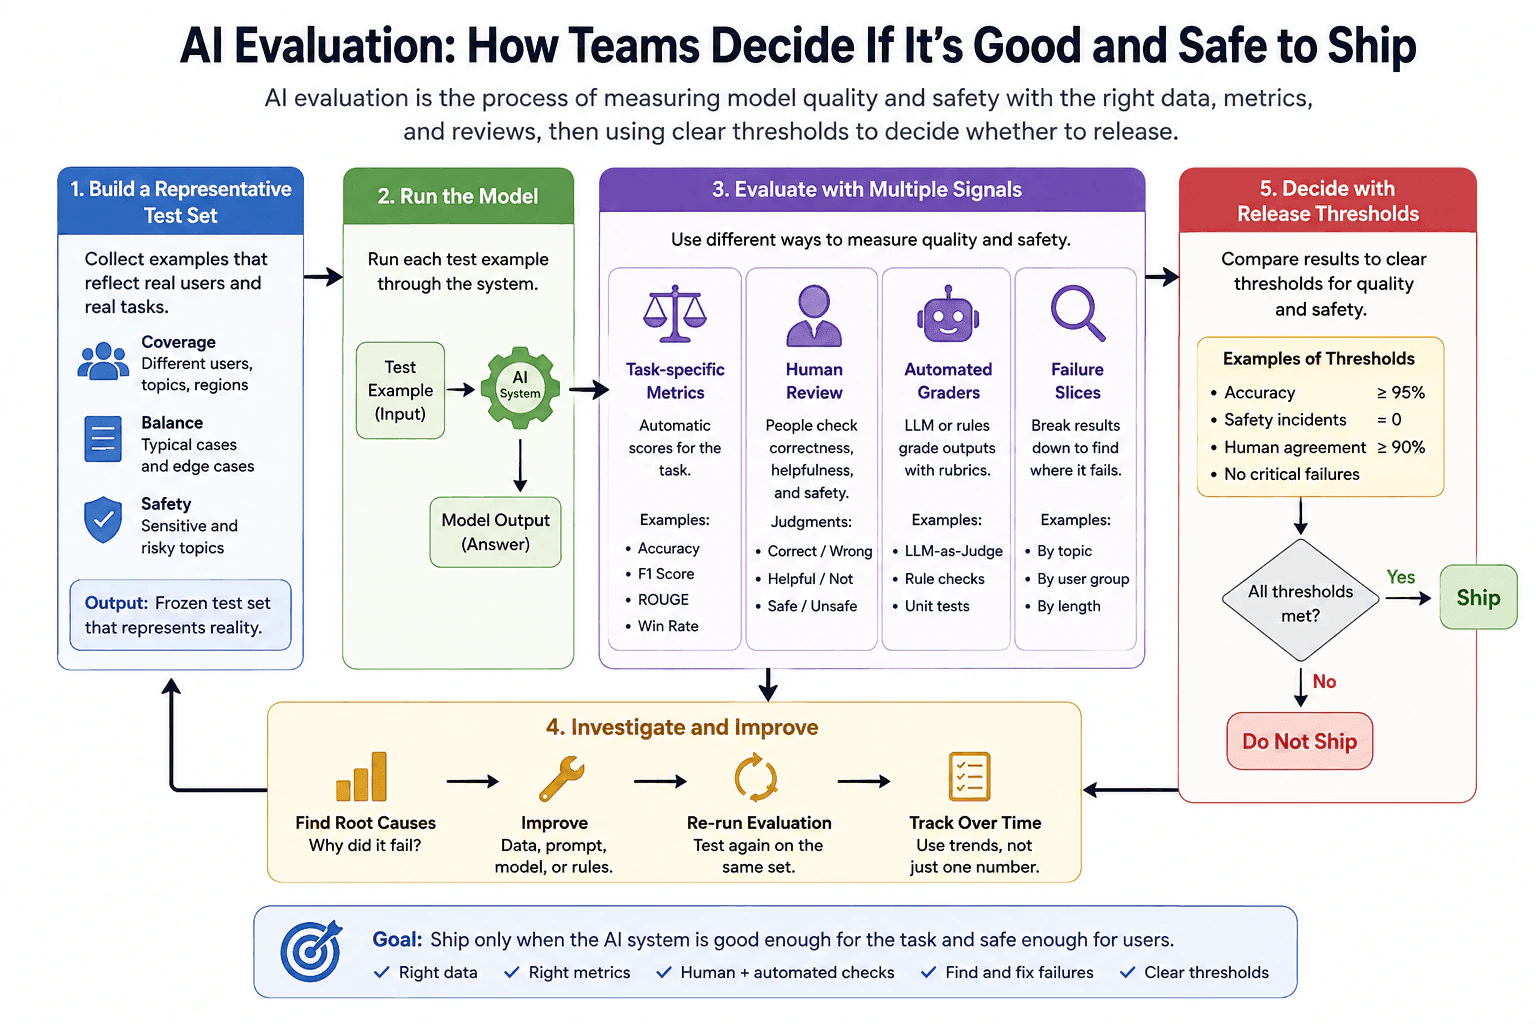
277 AI Engineer Interview Questions & Answers

124 top • 14 Amazon • 15 Anthropic • 14 Cohere • 15 Google DeepMind • 13 Meta • 14 Microsoft AI • 13 Mistral AI • 14 NVIDIA • 15 OpenAI • 11 Perplexity • 15 xAI

AI Engineer icon

Questions with Detailed ExplanationsWith Detailed Explanations

(Last Updated: August 28, 2026)

81. Design a Video Generation Service (Sora-like)Ai System DesignHard

Question Details

The system boundary and principal flows should make job submission, moderation, GPU scheduling, model execution, progress delivery, storage, retries, cost controls, and provenance explicit.

Short Interview Answer (30-60 seconds)

At a high level, I would build this as an asynchronous video job system. A client submits a prompt and settings through the API Gateway. The Job Service runs safety and policy checks, then places accepted work into a priority Job Queue. The Scheduler assigns GPU capacity while the Cost Controller enforces budgets and limits. Model Workers generate frames, report progress, and save checkpoints. Final videos and metadata go to storage, while provenance records how each output was created. The trade-off is more system complexity, but we gain safer GPU usage, retries, progress updates, and cost control.

Detailed Explanation

This system lets a user request a video without waiting on one long connection. Video generation takes time and uses expensive GPU machines. We need to accept the request, check that it is safe, decide when it can run, show progress, save the result, retry when needed, control spending, and record how the video was created. The diagram solves this with a job-based flow. Each job moves through submission, moderation, queueing, scheduling, GPU execution, result delivery, storage, provenance, and monitoring.

Useful Questions to Ask the Interviewer
  • How should we balance shorter wait times against GPU cost?
  • Which users or jobs should receive higher priority?
  • How strict should moderation, retry limits, and budget limits be?
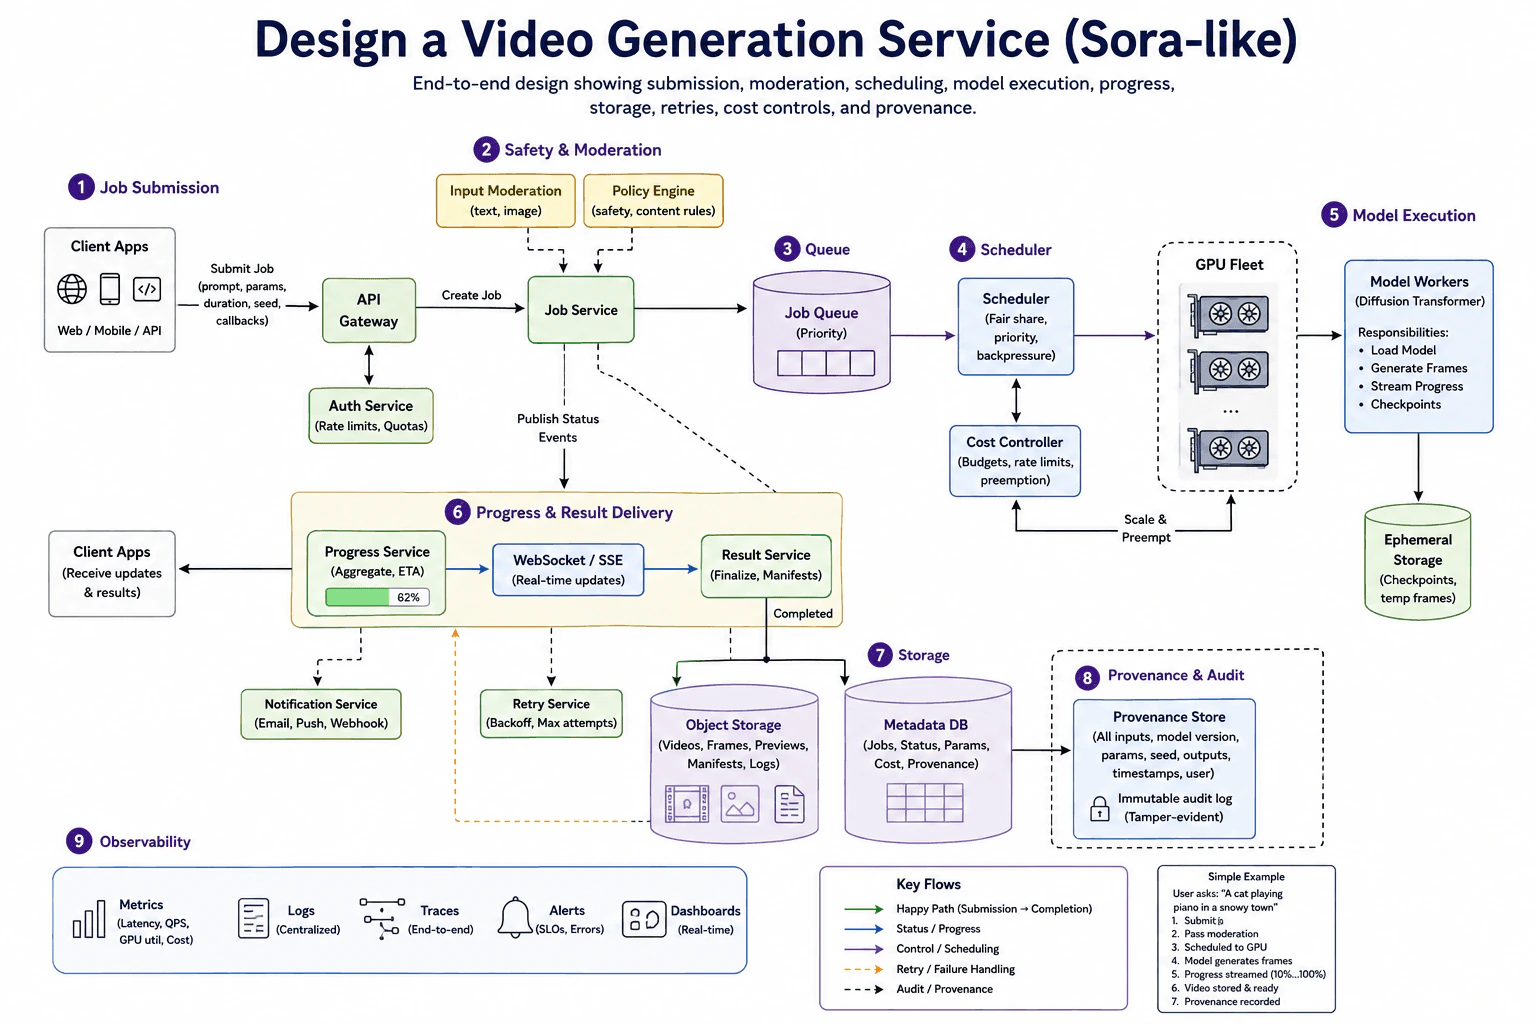
Design a Video Generation Service (Sora-like) diagram
How to Explain It in an Interview
1. Submit the video job

I would start by making video generation an asynchronous job. For example, a user may ask for "A cat playing piano in a snowy town." Client Apps can be web, mobile, or API clients. They submit the prompt, parameters, duration, seed, and callback information to the API Gateway. The API Gateway works with the Auth Service. The diagram shows rate limits and quotas there. These controls stop one caller from using too much shared capacity. The gateway then sends the create-job request to the Job Service.

2. Check safety before using GPU capacity

The Job Service receives results from Input Moderation and the Policy Engine. Input Moderation checks submitted text or images. The Policy Engine applies safety and content rules. This step matters because unsafe work should be stopped before expensive generation begins. After the checks pass, the Job Service sends the accepted work to the priority Job Queue. The Job Service also publishes status events toward the progress-delivery flow.

3. Queue and schedule the work

The Job Queue holds pending jobs and gives the Scheduler controlled access to them. The Scheduler uses fair share, priority, and backpressure. Fair share helps prevent one group from taking all capacity. Backpressure means slowing new work when the system is already busy. The Cost Controller works with the Scheduler using budgets, rate limits, and preemption. Preemption means delaying or stopping lower-priority work when policy requires it. The Scheduler then sends jobs to the GPU Fleet. The Cost Controller can also scale or preempt GPU capacity.

4. Generate the video on the GPU Fleet

The GPU Fleet provides the accelerator machines used by Model Workers. The diagram shows a diffusion-transformer model inside those workers. Their responsibilities are loading the model, generating frames, streaming progress, and creating checkpoints. A checkpoint is saved intermediate work from a long generation. Model Workers write checkpoints and temporary frames to Ephemeral Storage. This storage is for in-progress data rather than the final user result.

5. Deliver progress, results, and retries

The Progress Service aggregates job status and an estimated completion time. It sends real-time updates through WebSocket or SSE. SSE means Server-Sent Events, a simple way for a server to push updates to a client. The Result Service finalizes completed outputs and manifests. Client Apps receive updates and results through this delivery area. Notification Service can send email, push, or webhook messages. The diagram also includes a Retry Service with backoff and a maximum number of attempts. Backoff means waiting before trying failed work again.

6. Store results and record provenance

Object Storage keeps videos, frames, previews, manifests, and logs. Metadata DB keeps jobs, status, parameters, cost, and provenance information. Provenance means a record of how an output was produced. The Provenance Store records inputs, model version, parameters, seed, outputs, timestamps, and user information. It also keeps an immutable, tamper-evident audit log. Observability covers the whole system with metrics, centralized logs, end-to-end traces, alerts, and real-time dashboards. These signals help operators track latency, throughput, GPU use, cost, errors, and job health.

Practical Complexity & Trade-offs

The main design choice is separating fast request handling from slow GPU generation. The benefit is that clients do not need to keep one request open for a long time. The downside is more services, queues, state, and failure cases. Priority scheduling and fair share improve control, but some users may wait longer. Backpressure protects the GPU Fleet when demand is high. Cost controls reduce waste, but preemption can delay lower-priority work. Checkpoints and retries improve recovery, but they use extra storage and compute. Real-time progress improves the user experience, but adds another delivery path to operate. Provenance and audit records improve traceability, but they also add storage and data-management work.

Why Interviewers Ask This

Interviewers ask this question to test whether you can design around slow, expensive, and probabilistic AI work. They want to see safe job intake, queueing, GPU scheduling, progress delivery, retries, storage, cost control, and provenance. They also test how you manage scarce resources and failures. A strong answer explains why each component exists, keeps responsibilities clear, and discusses realistic trade-offs without making unsupported guarantees.
Interviewer may ask next
What would you change if demand suddenly becomes much larger than the available GPU capacity?

I would keep the same architecture and use the existing Job Queue, Scheduler, Cost Controller, and Auth Service more aggressively. The Job Queue would continue holding pending work instead of sending every request directly to GPUs. The Scheduler would use its fair-share and priority rules so one user or job class cannot take all capacity. Backpressure would reduce the rate at which work reaches the GPU Fleet when capacity is full. The Cost Controller would continue enforcing budgets, rate limits, and preemption rules. The Auth Service quotas would also limit how much work each caller can submit. Progress Service should keep showing the real waiting state instead of showing false execution progress. The main downside is longer wait time for lower-priority jobs. This approach protects expensive GPU capacity and keeps the system predictable while preserving the rest of the design.

How would the design handle a failure during a long video generation job?

I would keep the failure inside the existing execution, retry, progress, and storage design. Model Workers already create checkpoints and temporary frames in Ephemeral Storage. The diagram also includes a Retry Service with backoff and a maximum number of attempts. That prevents an unlimited retry loop. Progress Service should publish the real job state so the client does not see misleading progress. Metadata DB continues storing job status and related metadata. A final video should reach Object Storage only after Result Service finalizes the completed result and manifests. Provenance and observability should still record what happened through the existing provenance data, metrics, logs, traces, and alerts. The main downside is extra delay and compute cost. Checkpoints can reduce how much intermediate work is lost, but they also consume storage. All other moderation, scheduling, cost-control, and delivery parts remain unchanged.

82. What is LLMOps, and how does it differ from traditional MLOps?Llmops And Production AiEasy

Question Details

Keep the answer focused on versioned models, prompts, data, indexes and evaluators, release gates, observability, governance, incidents, and rollback compared with MLOps.

Short Interview Answer (30-60 seconds)

LLMOps extends MLOps for production LLM applications. It versions models, prompts, data, indexes, evaluators, and configuration; adds richer evaluation and release gates; monitors quality and drift; and supports governance, feedback, incident response, and rollback to known good versions.

Detailed Explanation

This question asks how teams safely run AI systems that generate text after they are built. These systems have more moving parts than older prediction systems. Teams must track not only the main model and data, but also instructions, search content, tests, and settings. They must test changes before release, watch the system after release, handle problems quickly, and return to a known good version when needed. The answer should explain these extra responsibilities and also show which production practices are shared with traditional machine learning operations.

Useful Questions to Ask the Interviewer
  1. Should I compare the full production lifecycle, or focus mainly on versioning, release, and monitoring?
  2. Should I include retrieval-based LLM applications, where an index or knowledge source can change separately from the model?
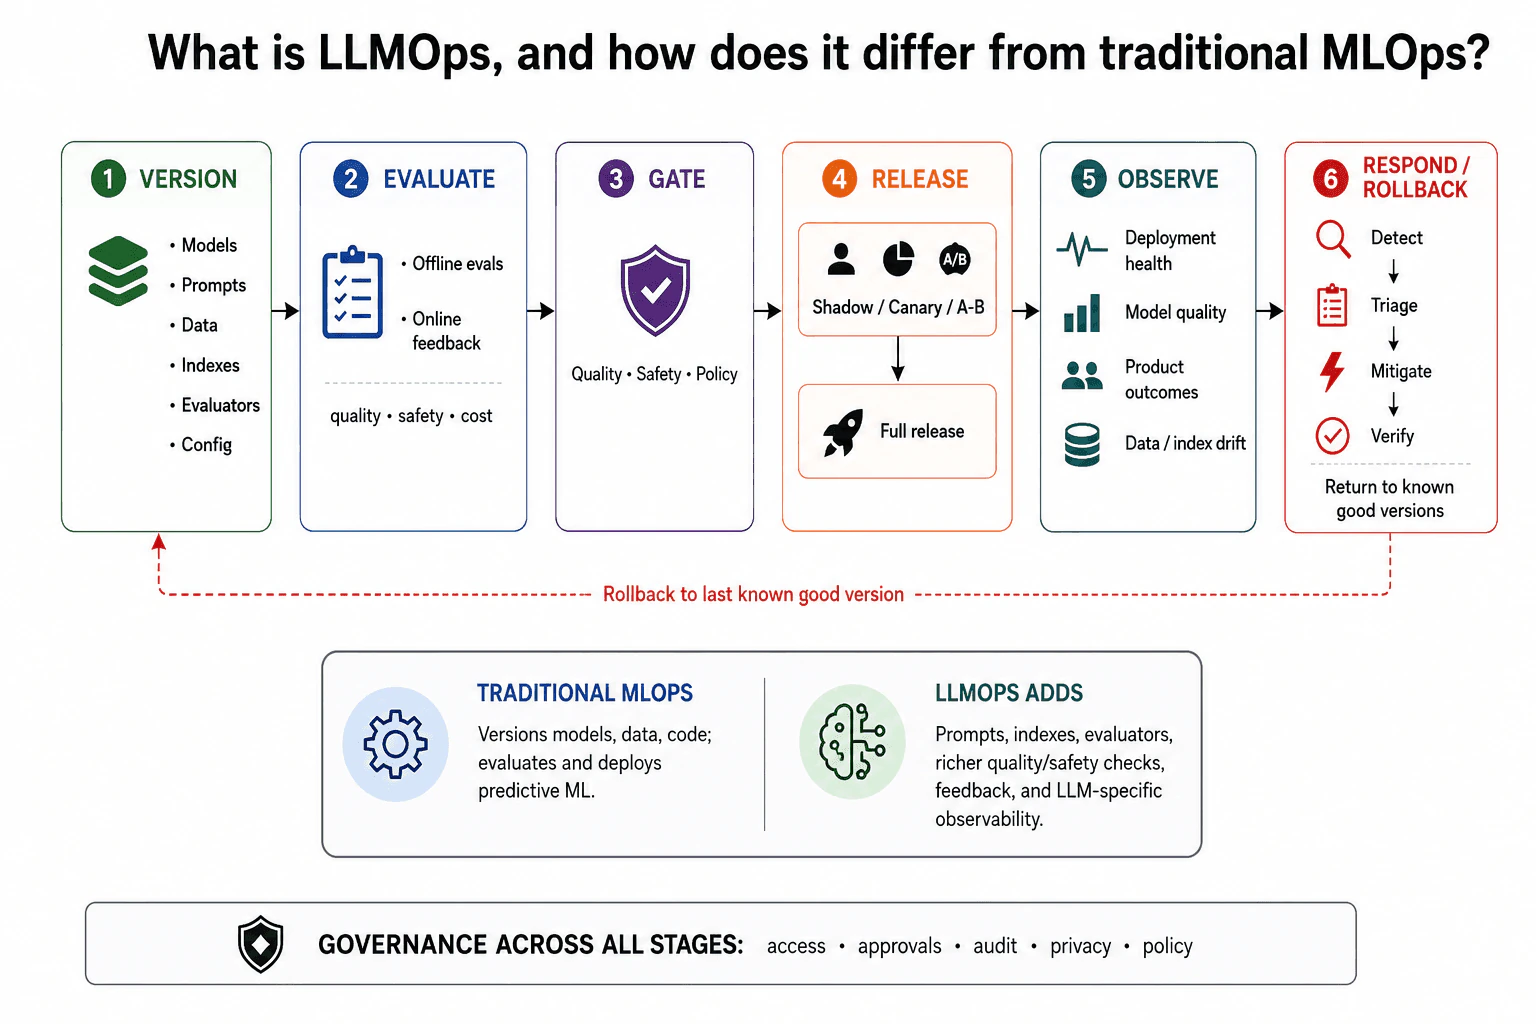
What is LLMOps, and how does it differ from traditional MLOps? diagram
How to Explain It in an Interview

Start with the big picture: LLMOps is MLOps extended for applications built around large language models.

Traditional MLOps already provides important practices. Teams version models, data, code, and other deployment artifacts. They evaluate models, release them, monitor production systems, handle incidents, and roll back bad changes.

LLMOps keeps those ideas but manages additional assets that can change an LLM application's behavior. The diagram shows models, prompts, data, indexes, evaluators, and configuration as versioned assets. Teams should also keep lineage. Lineage means knowing exactly which versions were used together in a release. This makes a release easier to reproduce, compare, investigate, and restore.

Next comes evaluation. Before release, teams run offline evaluations on known test cases. The diagram groups the main concerns as quality, safety, and cost. After deployment, teams also collect online feedback from real use. This matters because an LLM can return a technically valid response that is still wrong, unsafe, expensive, or unhelpful.

Changes then pass through release gates. A release gate is a check that blocks a change when required conditions are not met. The diagram uses quality, safety, and policy as the main gates.

A new version does not have to go directly to every user. Teams can use a shadow release, where the new version receives production-like traffic but its output is not served to users. They can use a canary release, where a small part of traffic uses the new version. They can also use an A/B test to compare variants. These are release options, not mandatory steps for every system. If the required signals are good, the team can move to full release.

Observability means being able to understand how the production system is behaving. The diagram separates four useful views. Deployment health covers whether the service is operating normally. Model quality covers the behavior of generated answers. Product outcomes cover whether users are succeeding. Data or index drift covers meaningful changes in the information feeding retrieval or evaluation.

When something goes wrong, the response flow is detect, triage, mitigate, and verify. Triage means finding the scope and likely source of the problem. Mitigation reduces user impact. If a recent change caused the regression, the team can return the affected assets to known good versions. That rollback may involve the model, prompt, index, or configuration rather than only application code.

Governance applies across all stages. The diagram highlights access control, approvals, audit records, privacy, and policy.

The key difference is therefore not that MLOps disappears. LLMOps builds on it. It adds stronger handling for LLM-specific assets and risks, including prompts, indexes, evaluators, richer quality and safety evaluation, feedback, and LLM-specific observability. The tradeoff is more operational work and more artifacts to manage. The benefit is safer releases, clearer diagnosis, better reproducibility, and faster recovery when a production change fails.

Release Lifecycle
  1. Version the production assets: model, prompts, data, indexes, evaluators, and configuration. Record lineage so each release can be reproduced.
  2. Run offline evaluations before release. Check the quality, safety, and cost signals that matter for the application.
  3. Apply release gates for quality, safety, and policy.
  4. Release gradually with shadow, canary, or A/B methods when appropriate. Move to full release after the required checks pass.
  5. Observe separate production signals: deployment health, model quality, product outcomes, and data or index drift.
  6. When an incident occurs, detect it, triage its scope, mitigate the impact, and verify recovery.
  7. Roll back affected assets to known good versions when rollback is the safest containment step.
  8. Apply governance across all stages through access controls, approvals, audit records, privacy, and policy checks.
Time & Space Complexity

There is no useful Big-O complexity for LLMOps itself because it is an operational lifecycle, not one algorithm. The main costs are practical. Offline evaluations take compute, test data, and time. Online monitoring and feedback need storage and analysis. More models, prompts, indexes, evaluators, and configurations increase maintenance work. Controlled releases can make deployment slower, but they reduce risk. Keeping version history and lineage uses extra storage, while rollback requires keeping known good artifacts available. Runtime latency and memory still depend on the chosen model, serving system, retrieval path, and traffic, not on LLMOps as a fixed formula.

Where it is used

This approach is useful for production LLM applications where models, prompts, retrieval indexes, evaluation rules, or configuration change over time. Examples include support assistants, search assistants, enterprise knowledge systems, coding assistants, and workflow agents. It is especially useful when teams need controlled releases, audit history, production feedback, incident response, and the ability to restore known good versions quickly.

Why Interviewers Ask This

The interviewer wants to know whether you understand that production LLM systems need more than model deployment. A strong answer should explain what LLMOps keeps from traditional MLOps and what it adds for prompts, indexes, evaluators, release gates, observability, governance, incidents, and rollback.

Common interview mistakes

A common mistake is saying that LLMOps is simply MLOps with a larger model. LLMOps also treats prompts, indexes, evaluators, and configuration as important production assets. Another mistake is monitoring only uptime and latency while ignoring model quality, product outcomes, and data or index drift. Candidates also forget that offline tests are not enough; real production feedback matters. Another mistake is describing shadow, canary, and A/B releases as mandatory instead of optional controlled-release methods. Finally, do not describe rollback as only a code rollback. A production regression may require restoring a model, prompt, index, or configuration version.

Interview tip

Start with one sentence: LLMOps extends MLOps to manage the extra assets and risks of LLM applications. Then walk through the lifecycle in order: version, evaluate, gate, release, observe, respond, and roll back. Finish with the four monitoring views from the diagram: deployment health, model quality, product outcomes, and data or index drift.

Interviewer may ask next
Why do prompts and retrieval indexes need versioning in LLMOps?

They can change application behavior even when the model and application code stay the same. Versioning them gives the team lineage, which means knowing exactly which prompt, index, model, data, evaluator, and configuration were used in a release. This makes evaluation reproducible and lets the team restore the exact known good combination during an incident.

How would you safely release a new prompt or model version?

First run offline evaluations and check the required quality, safety, and policy gates. Then use a controlled rollout such as shadow traffic, a canary, or an A/B test when appropriate. Watch deployment health, model quality, product outcomes, and data or index drift. If the release causes a regression, contain the impact, return the affected assets to known good versions, and verify that the system has recovered.

83. Explain the AI product lifecycle from ideation to production.Llmops And Production AiEasy

Question Details

Expected depth includes problem definition, baseline, data and prompt or model choices, offline evaluation, safety review, staged release, monitoring, feedback, and retirement.

Short Interview Answer (30-60 seconds)

Define the problem and baseline first. Then choose and version the data, prompts, model, and tools. Evaluate quality and safety offline, release gradually with rollback ready, monitor production health and quality, learn from feedback, iterate, and finally retire obsolete versions safely.

Detailed Explanation

An AI product should start with a real user problem, not with a model. First, decide what users need, what success means, and what risks matter. Build a simple starting solution so you can judge whether AI adds value. Then prepare the data and choose the prompts, model, and tools. Test the product before real users depend on it. Release it gradually, watch what happens, learn from feedback, and keep improving it. When an old version is no longer useful, migrate users and retire it safely while keeping the records needed for learning and operations.

Useful Questions to Ask the Interviewer
  1. What user problem and business outcome should this AI product solve?
  2. What quality and safety conditions must be met before increasing production traffic?
  3. Should I explain the complete lifecycle through monitoring, feedback, rollback, and retirement?
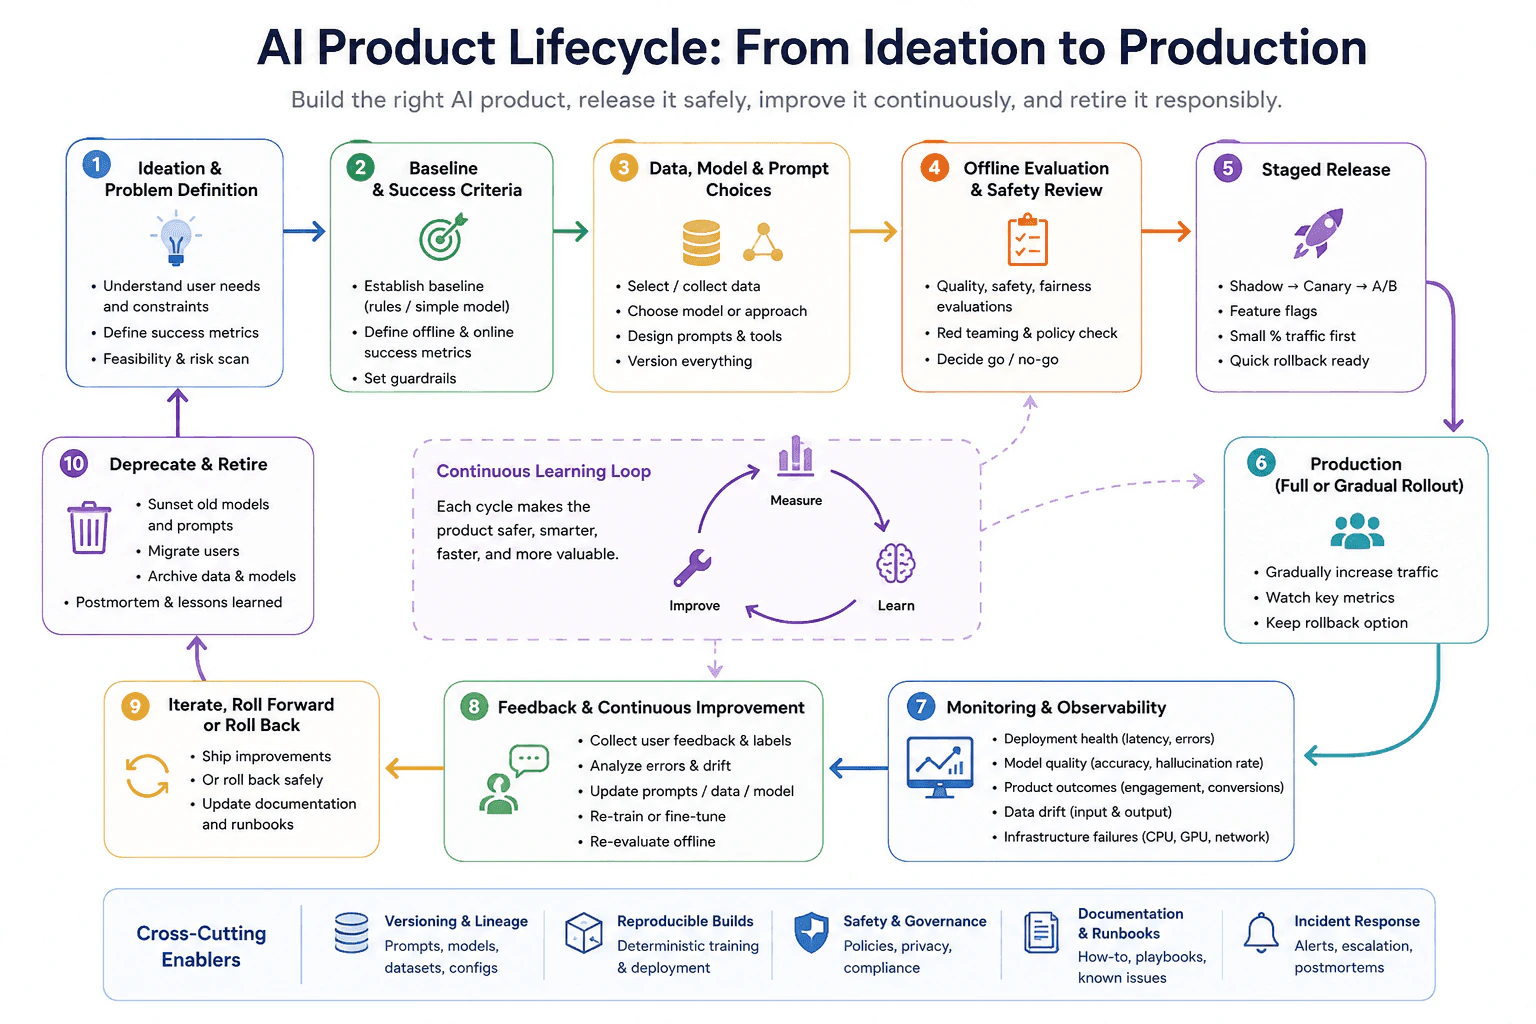
Explain the AI product lifecycle from ideation to production. diagram
How to Explain It in an Interview

I would describe the AI product lifecycle as a continuous loop with ten practical stages.

  1. Ideation and problem definition: Understand the user need and constraints. Define success metrics and perform an early feasibility and risk scan. This prevents the team from building AI without a clear product reason.
  1. Baseline and success criteria: Establish a simple baseline, such as rules or a simple model. Define offline and online success measures. Set guardrails, which are limits that keep the system inside acceptable behavior.
  1. Data, model, and prompt choices: Select and curate the needed data. Choose the model or other technical approach. Design the prompts and tools. Version the prompts, models, datasets, and configurations so the team can trace every release and reproduce previous builds.
  1. Offline evaluation and safety review: Before production exposure, evaluate quality, safety, and fairness when relevant. Use red-team testing to deliberately probe weak or unsafe behavior. Check applicable policies and make a clear go or no-go decision.
  1. Staged release: Introduce the new version gradually. A shadow release runs it without changing the user-visible result. A canary sends only a small percentage of traffic to it. An A/B test compares controlled variants when that is appropriate. Keep feature flags and a quick rollback path ready.
  1. Production rollout: Increase traffic gradually when the staged-release evidence is acceptable. Continue watching key signals while retaining the option to roll back.
  1. Monitoring and observability: Watch separate categories because one healthy signal does not prove the whole system is healthy. Deployment health covers latency and errors. Model quality covers measures such as accuracy or hallucination rate when those measures apply to the product. Product outcomes cover measures such as engagement or conversion when relevant. Data drift means production inputs or outputs are changing from expected patterns. Infrastructure monitoring covers failures in resources such as CPU, GPU, or network systems.
  1. Feedback and continuous improvement: Collect user feedback and labels. Analyze errors and drift. Use the evidence to update prompts, data, or the model. Retrain or fine-tune only when needed. Re-run offline evaluation before releasing the next version.
  1. Iterate, roll forward, or roll back: Ship improvements when they pass the required checks. Roll back safely when a release causes unacceptable problems. Update documentation and runbooks so operators know how the system works and how to respond to known issues.
  1. Deprecate and retire: Sunset old models and prompts when they are no longer needed. Migrate users, archive required data and model artifacts, and capture postmortems and lessons learned.

Several practices support the whole lifecycle. Versioning and lineage record which prompts, models, datasets, and configurations produced each release. Reproducible builds make releases repeatable. Safety and governance cover policies, privacy, and compliance. Documentation and runbooks explain operation and recovery. Incident response provides alerts, escalation, containment, rollback, and postmortems.

The main tradeoff is release speed versus risk. Faster rollout gives real-world feedback sooner, but exposing too much traffic at once increases the impact of a bad change. Staged releases, monitoring, versioning, and rollback let the team learn quickly while keeping failures contained.

Release Lifecycle
  1. Define the user problem, constraints, success metrics, feasibility, and risks.
  2. Establish a simple baseline and offline and online success criteria.
  3. Curate data and choose the prompt, model, tools, and other needed configuration.
  4. Version prompts, models, datasets, and configurations and keep lineage for reproducibility.
  5. Run offline quality and safety evaluation, including red-team and policy checks when relevant.
  6. Make a go or no-go decision before production exposure.
  7. Release through shadow, canary, or A/B stages with feature flags and rollback ready.
  8. Increase production traffic gradually while monitoring deployment health, model quality, product outcomes, data drift, and infrastructure failures separately.
  9. Collect feedback, analyze errors and drift, update the appropriate artifacts, and re-evaluate offline.
  10. Roll forward when the change is safe, roll back when needed, and maintain documentation and runbooks.
  11. Deprecate and retire obsolete models and prompts, migrate users, archive required artifacts, and capture lessons learned.
Time & Space Complexity

The main costs are operational rather than algorithmic. More model, prompt, dataset, and configuration versions require more storage, testing, tracking, and maintenance. Offline evaluations and staged releases require extra compute and engineering work, but they reduce the chance that a bad release affects every user. Monitoring also has cost, but separating deployment health, model quality, product outcomes, data drift, and infrastructure failures makes production problems easier to diagnose. Version lineage, reproducible builds, documentation, and incident-response processes add process overhead, but they make rollback, audits, debugging, and future releases safer.

Where it is used

This lifecycle is used for production AI systems such as assistants, recommendation features, classification services, document-processing products, search experiences, and AI features inside larger applications. It is useful whenever a team must prove that an AI change is valuable and safe, release it with controlled risk, observe real production behavior, learn from feedback, handle incidents, and eventually retire obsolete versions.

Why Interviewers Ask This

Interviewers want to know whether the candidate understands that building an AI product is an end-to-end lifecycle, not just choosing or training a model. A strong answer connects problem definition, baselines, versioned artifacts, offline evaluation, safety review, staged release, production monitoring, feedback, rollback, incident response, and responsible retirement.

Common interview mistakes

Common mistakes are choosing a model before defining the user problem, skipping a simple baseline, changing prompts or models without versioning them, and treating offline evaluation as enough evidence for production. Other mistakes include skipping safety review, releasing all traffic at once, having no rollback option, or monitoring only one broad health score. Deployment health, model quality, product outcomes, data drift, and infrastructure failures should be watched separately. Teams also fail when they collect feedback but do not re-evaluate changes before release, leave runbooks outdated, or keep obsolete models and prompts running without a retirement plan.

Interview tip

Explain the lifecycle as one continuous loop: define, baseline, choose and version, evaluate, release gradually, monitor, learn, improve, and retire. Mention rollback and incident response as safety mechanisms. In production, explicitly separate deployment health, model quality, product outcomes, data drift, and infrastructure failures.

Interviewer may ask next
Why should an AI team use a staged release instead of sending all traffic to a new version immediately?

A staged release limits the impact of a bad change while the team gathers production evidence. Shadow deployment can run the new version without changing the user-visible result. Canary deployment sends only a small share of traffic to it. A/B testing compares controlled variants when appropriate. The team watches deployment health, model quality, and product outcomes during each stage. If important signals become unacceptable, it can stop the rollout or roll back instead of exposing every user.

How should an AI team separate different kinds of production problems?

Start by separating the signals. Deployment health shows latency and errors. Model-quality measures show whether the AI behavior has regressed. Product outcomes show whether users are getting the intended value. Data-drift checks show whether inputs or outputs have changed from expected patterns. Infrastructure telemetry shows CPU, GPU, network, or other serving failures. Then compare the exact prompt, model, dataset, configuration, and deployment versions. This narrows the fault boundary before the team changes the system.

84. How do you serve LLMs in production?Llmops And Production AiEasy

Question Details

Walk through the choices involved in model packaging, runtime, batching, token streaming, scaling, health checks, safety middleware, and service-level objectives.

Short Interview Answer (30-60 seconds)

I package and version the model, tokenizer, prompts, adapters, and configuration, then run them on an optimized inference service. I add batching, token streaming, safety middleware, autoscaling, health checks, telemetry, SLOs, and progressive releases with rollback so the service remains fast, safe, observable, and reliable.

Detailed Explanation

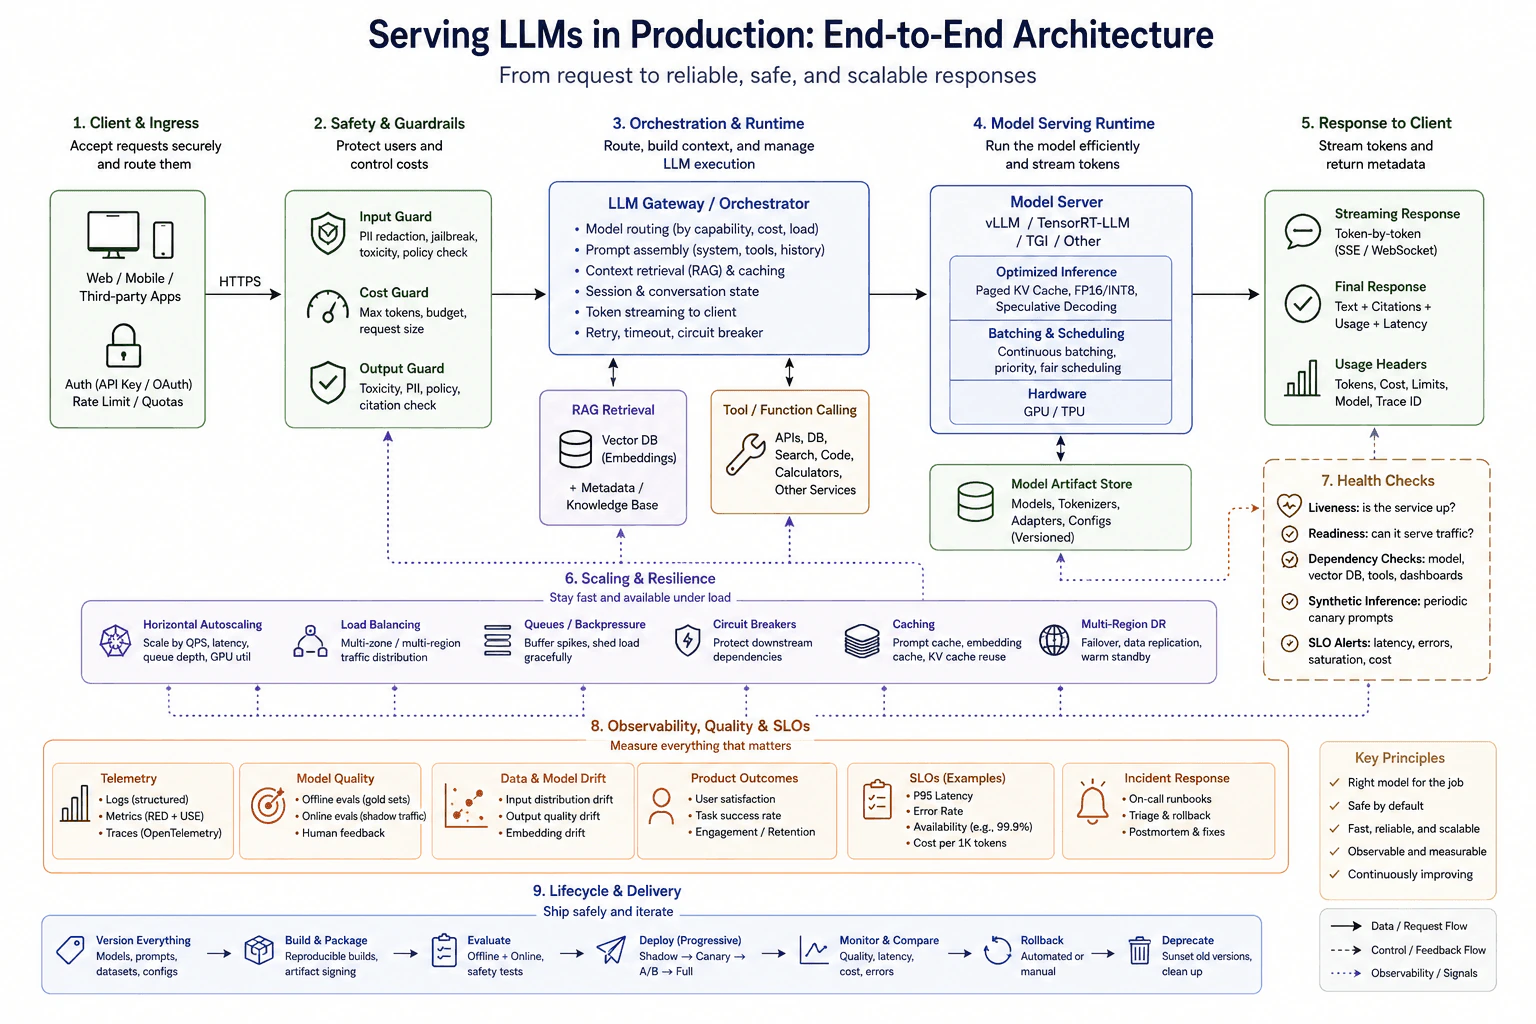
This question asks how to turn a language model into a dependable service for real users. You need to explain how a request enters the system, how unsafe or oversized requests are handled, how work is grouped efficiently, and how words are returned as they are produced. You also need to explain how the service handles changing traffic, checks whether it is healthy, measures speed and reliability, and rolls out changes safely. The goal is to show a clear path from one user request to a reliable response.

Useful Questions to Ask the Interviewer
  1. What matters most for this service: low response delay, high throughput, low cost, or a balance of them?
  2. Do clients need token-by-token streaming, or can they wait for the complete response?
  3. Is there one model, or should requests be routed between models based on capability, cost, or load?
  4. What availability and latency objectives should the service meet?
  5. Are retrieval, tools, or conversation history part of the request path?
  6. What input and output safety rules are required?
How do you serve LLMs in production? diagram
How to Explain It in an Interview

I would start by defining the scope and making the serving setup reproducible. I version the model, tokenizer, prompts, adapters, datasets used for evaluation, and configuration. This lineage tells me exactly which artifacts produced a result. If production behavior later changes, I preserve request IDs, timestamps, model and prompt versions, configuration, and relevant telemetry before changing anything. I first reproduce the problem safely when possible and isolate the smallest useful boundary, such as ingress, orchestration, retrieval, model serving, or infrastructure.

1. Package and version the serving artifacts

The model should not be copied manually onto production machines. I create a reproducible build that points to versioned model artifacts, tokenizer files, optional adapters, prompts, and configuration. The model artifact store keeps these versions immutable enough to reproduce a release and roll back to a known-good version. This also makes deprecation controlled rather than accidental.

2. Accept requests through controlled ingress

Web, mobile, or third-party clients send requests through a secure entry point. Authentication, API keys or OAuth, rate limits, quotas, and request-size limits belong here. These checks protect the service before expensive model work begins.

3. Apply safety and cost guardrails

Input guardrails can check for sensitive data, prompt-injection or jailbreak patterns, toxicity, and policy violations. Cost controls can limit maximum tokens, budgets, and request size. Output guardrails inspect generated content before it reaches the client. These checks are middleware around the model because production safety is a system responsibility, not only a model property.

4. Orchestrate the request

An LLM gateway or orchestrator chooses the model based on capability, cost, and current load. It assembles the system prompt, user input, conversation history, and any required context. If the application uses retrieval, it can query a vector database and knowledge source. If tool calling is allowed, it can call approved APIs, databases, search systems, code tools, or other services. The orchestrator also applies timeouts, retries, and circuit breakers so one slow dependency does not block the whole request indefinitely.

5. Run the model efficiently

The model server loads the versioned artifacts onto suitable accelerators such as GPUs or TPUs. The serving runtime should support the model format and hardware while meeting throughput and latency needs. Useful optimizations can include a paged KV cache, which reuses attention state from earlier tokens, lower-precision execution such as FP16 or INT8 when supported and validated, and speculative decoding when the model and runtime support it.

6. Batch and schedule requests

Batching improves accelerator use by processing compatible work together. For LLMs, continuous batching is useful because requests have different prompt lengths and finish at different times. A scheduler can admit new work as other requests complete. It can also apply priority or fair scheduling. The main tradeoff is throughput versus latency: waiting longer can create a larger batch and better hardware use, but it can also increase the time a user waits.

7. Stream generated tokens

I normally stream tokens to the client as they are generated instead of waiting for the whole answer. Server-Sent Events or WebSocket-style connections can carry this stream. Streaming improves perceived responsiveness because the user sees output earlier. The service still needs to handle client cancellation, disconnects, timeouts, and final metadata such as usage, latency, model version, and trace ID.

8. Scale and protect the service under load

I scale model-server instances horizontally by adding or removing replicas. Useful scaling signals include request rate, queue depth, latency, and accelerator utilization. A load balancer sends traffic only to healthy instances. Queues and backpressure absorb short spikes but must be bounded so overload does not grow without limit. Circuit breakers protect failing dependencies. Caching can reduce repeated prompt, retrieval, embedding, or KV-cache work when reuse is safe. Higher-availability systems can use multiple zones or regions with an appropriate failover and warm-standby design.

9. Use health checks with different meanings

A liveness check asks whether the serving process is still running. A readiness check asks whether the instance can actually serve traffic, which can include checking that the model is loaded. Dependency checks can cover required systems such as the model store, retrieval database, or tools. Synthetic inference can periodically send a small known request through the serving path. Health checks should remain lightweight enough that they do not create extra failure during an incident.

10. Separate observability, quality, and SLOs

I collect structured logs, metrics, and distributed traces. Useful serving signals include latency, time to first token, tokens per second, queue depth, accelerator utilization, errors, token usage, saturation, and cost. I keep deployment health separate from model quality. A process can be alive and ready while the model gives worse answers. I therefore track several groups separately: infrastructure failures, service health, model quality, data or model drift, and product outcomes.

Service-level objectives, or SLOs, state the behavior the service should provide. Typical SLO categories include latency, availability, error rate, and cost. The exact targets depend on the product requirements rather than being assumed in advance. Model quality and safety also need acceptance criteria, but they should not be confused with infrastructure availability.

11. Evaluate and release changes safely

Before full deployment, I evaluate the new version offline on controlled data. Online evaluation can then use shadow traffic, where a candidate receives copies of real requests without serving its answer. A canary release sends a small amount of real traffic to the new version. A/B testing can compare versions for product outcomes when that experiment is appropriate. I monitor quality, latency, errors, saturation, and cost during the rollout.

If the new version causes unacceptable behavior, I contain the impact first by reducing or stopping its traffic. Rollback is a recovery action, not proof of the root cause. I preserve evidence and compare model, prompt, dataset, configuration, retrieval, tool, dependency, and environment versions. I then isolate the failing boundary, test the smallest hypothesis, apply the smallest safe correction, rerun evaluation, and repeat a limited rollout before increasing traffic again.

12. Close the lifecycle

After deployment, telemetry, drift checks, feedback, and incident response continue. Incidents should have alerts, runbooks, traffic-shedding or rate-limiting options, graceful degradation where appropriate, rollback procedures, and a post-incident review. Versions that are no longer needed should be deprecated deliberately, with lineage retained long enough to understand past behavior.

The main design idea is simple: the request path should be fast and safe, while a surrounding control loop makes it scalable, observable, measurable, and recoverable.

Release Lifecycle
  1. Define the workload, latency goal, throughput goal, availability need, safety rules, and cost limits.
  2. Version the model, tokenizer, prompts, adapters, evaluation datasets, and configuration so releases are reproducible.
  3. Put authentication, rate limits, quotas, and request-size controls at ingress.
  4. Apply input safety and token-budget checks before expensive inference work.
  5. Route the request through an orchestrator that selects the model and builds conversation, retrieval, or tool context when required.
  6. Send inference to an optimized model server with suitable accelerator hardware, KV-cache support, and validated precision settings.
  7. Use continuous batching and scheduling while bounding queue delay and protecting fairness.
  8. Stream generated tokens to the client and handle cancellation, disconnects, timeouts, usage metadata, and trace IDs.
  9. Scale healthy replicas using demand, queue, latency, and accelerator signals. Use load balancing, bounded backpressure, circuit breakers, caching, and failover when required.
  10. Use liveness, readiness, dependency, and lightweight synthetic checks for different health questions.
  11. Monitor service telemetry, infrastructure health, model quality, product outcomes, drift, safety, and cost as separate signals.
  12. Evaluate new versions offline and online, then release through shadow, canary, A/B, or progressive deployment as appropriate.
  13. If a release fails, contain or roll back first when needed, preserve evidence and version lineage, isolate the failing boundary, test a hypothesis, apply the smallest safe correction, verify it, and continue monitoring.
  14. Deprecate old versions deliberately after the replacement is stable.
Practical Complexity & Trade-offs

The biggest costs are accelerator memory, accelerator time, network traffic, and operational work. Larger models and longer prompts usually require more memory and computation. The KV cache also grows with active context and concurrent requests. Batching improves accelerator use, but waiting too long to form work groups increases response delay. More replicas improve capacity and availability but raise cost. Streaming keeps connections open longer. Retrieval and tool calls add network delay and new failure points. Multi-region failover improves resilience but adds infrastructure and data-management cost. Maintenance also becomes harder as the number of model, prompt, configuration, dependency, safety-rule, and deployment versions grows.

Where it is used

This serving pattern is used for production chat assistants, enterprise copilots, retrieval-augmented question answering, customer-support systems, coding assistants, document-analysis services, agent systems, and APIs that expose LLM capabilities. A small internal service may use one model and one region. A high-traffic public service may need model routing, continuous batching, horizontal autoscaling, bounded queues, multi-zone or multi-region failover, stronger safety middleware, detailed observability, explicit SLOs, and progressive deployment.

Why Interviewers Ask This

Interviewers want to know whether you understand the complete production path around an LLM, not just model inference. A strong answer shows that you can package and version artifacts, choose a serving runtime, batch requests, stream tokens, scale capacity, design meaningful health checks, apply safety controls, observe the service, define SLOs, and release changes safely. They also want to see whether you understand important tradeoffs such as throughput versus latency, reliability versus cost, and deployment health versus answer quality.

Common interview mistakes

A common mistake is treating production serving as only putting an HTTP endpoint in front of a model. That ignores packaging, versioning, safety, scheduling, streaming, scaling, health checks, observability, SLOs, and rollback. Another mistake is maximizing batch size without considering queue delay and time to first token. Do not autoscale only from CPU when queue depth, latency, accelerator utilization, or request demand better represent model-serving pressure. Do not treat liveness and readiness as the same signal. Do not assume that a healthy process means good model quality. Keep deployment health, model quality, product outcomes, drift, and infrastructure failures separate. Avoid unbounded retries, queues, caches, or token budgets because they can make overload worse. Do not send a new model or prompt directly to all traffic without evaluation, progressive rollout, monitoring, and a rollback path. Finally, do not call rollback the root-cause fix. Rollback contains impact; diagnosis still needs preserved evidence, version lineage, boundary isolation, a tested hypothesis, and verification.

Interview tip

Walk through one request from client ingress to streamed response, then explain the control loop around that path: scaling, health checks, observability, SLOs, evaluation, progressive deployment, and rollback. Name the main tradeoffs as you go. Batching improves throughput but can add waiting time, stronger redundancy improves resilience but costs more, and a healthy server does not automatically mean the model is producing good answers.

Interviewer may ask next
How would you choose a batching strategy for an LLM service?

I would start from the latency objective and the traffic shape. LLM requests have different prompt lengths and generation lengths, so fixed batches can waste accelerator capacity while waiting for slower requests. Continuous batching is usually a better fit because completed requests can leave and new requests can enter while the accelerator keeps working. I would bound queue time and batch size so throughput does not come at the cost of excessive user delay. I would monitor queue depth, batch size, time to first token, total latency, tokens per second, accelerator utilization, and fairness. If latency rises while utilization stays low, I would investigate scheduling, queueing, retrieval, tools, or other dependencies before simply adding replicas.

What should happen if a newly deployed model is healthy but answer quality gets worse?

I would treat that as a model-quality regression rather than an infrastructure-health failure. I would preserve request IDs, timestamps, model version, prompt version, dataset version, configuration, rollout state, and relevant telemetry. If user impact is meaningful, I would reduce or stop the canary and return traffic to the known-good version. Then I would compare offline evaluations, shadow or canary results, prompt changes, retrieval behavior, tool behavior, data changes, and environment differences to isolate the cause. After the smallest safe correction, I would rerun evaluation and use another limited rollout before increasing traffic. Liveness and readiness can both pass while model quality still fails its acceptance criteria.

85. How do you monitor LLM applications in production?Llmops And Production AiEasy

Question Details

Turn quality, safety, latency, cost, availability, input shifts, component traces, alert thresholds, and privacy-aware samples into a production-ready procedure with measurable checks.

Short Interview Answer (30-60 seconds)

I monitor every request with privacy-safe metrics, logs, traces, and version metadata. I track quality, safety, latency, cost, availability, and drift against baselines. Alerts start an evidence-based investigation, followed by containment, correction, verification, and safe continuous improvement.

Detailed Explanation

Monitoring means watching the whole service after real users start using it. I want to know whether answers are useful and safe, whether responses arrive quickly, whether the service stays available, and whether spending stays reasonable. I also watch whether the kinds of requests people send are changing. When something looks wrong, I need enough recorded evidence to find where the problem started. I protect private information while collecting that evidence. After a correction, I check that users are better served and that the same problem does not return.

Useful Questions to Ask the Interviewer
  1. Which user outcomes matter most: answer quality, task success, safety, speed, reliability, or cost?
  2. What alert thresholds or service targets already exist for latency, errors, safety, and spending?
  3. Which components can I trace, such as the application, model provider, retrieval system, tools, and external services?
  4. What user data may be sampled, and what redaction, retention, and access rules apply?
  5. How are prompt, model, configuration, and release versions recorded?
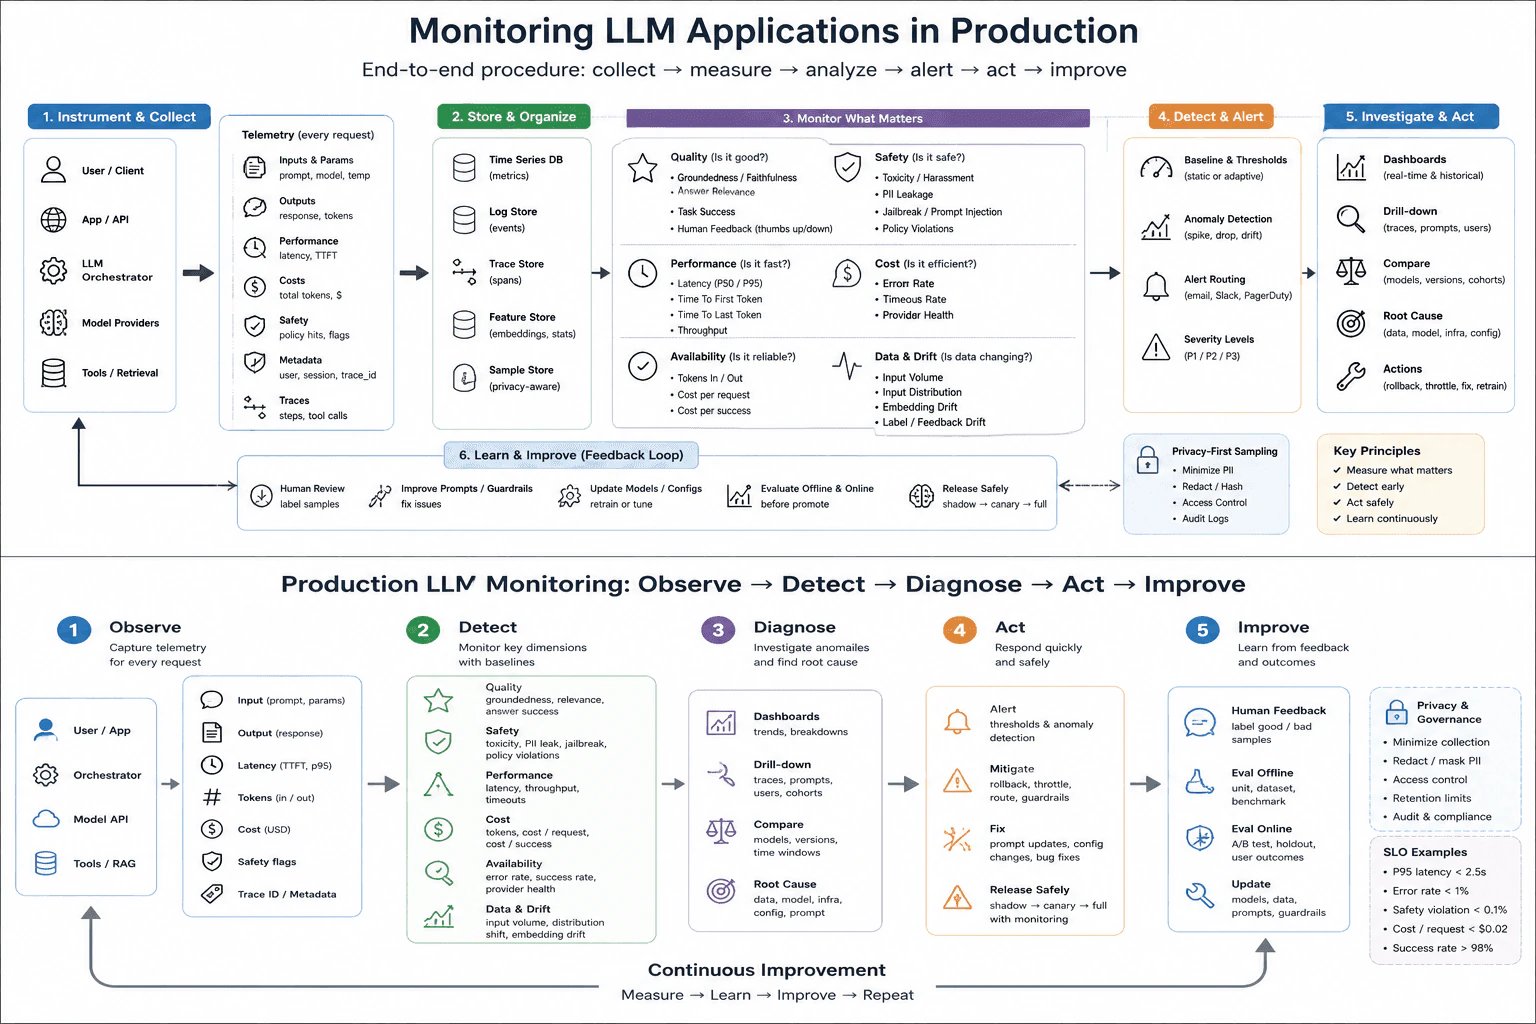
How do you monitor LLM applications in production? diagram
How to Explain It in an Interview

I would describe production monitoring as an observe, detect, diagnose, act, and improve loop.

First, I instrument the full request path. The request may pass through the user or client, application or API, LLM orchestrator, model provider, retrieval system, tools, and downstream services. For each request, I capture useful input and output metadata, prompt and model version, token counts, latency, time to first token, safety results, request ID, trace ID, retrieval calls, tool calls, retries, and relevant errors. I do not collect unnecessary private content.

Second, I organize the evidence by type. Time-series storage holds numeric metrics. A log store holds structured events. A trace store holds request spans across components. A feature or signal store can hold drift-related statistics. A privacy-aware sample store holds only the small set of redacted or hashed examples needed for review. Samples should use data minimization, access controls, short retention, and audit logs.

Third, I monitor separate signal groups because one healthy signal can hide another failure. For quality, I can track groundedness or faithfulness when relevant, answer relevance, task success, evaluation results, and human feedback. For safety, I track policy violations, toxicity or harassment signals, privacy leakage, and jailbreak or prompt-injection signals. For performance, I track latency percentiles, time to first token, total response time, throughput, and timeouts. For cost, I track tokens in and out, cost per request, cost per successful task, and spending trends. For availability, I track error rate, timeout rate, success rate, and provider health. For drift, I compare input volume, input distributions, topics, embeddings when useful, and feedback or label distributions.

Fourth, I compare these signals with baselines. A baseline is the normal range for a metric. Some thresholds can be static when a hard limit is known. Others can adapt to normal traffic patterns. I alert on sustained user impact instead of every small spike. Each alert should provide enough context to investigate, such as severity, time window, affected cohort or version, request IDs, and links to dashboards and traces. The exact threshold values depend on the product and should not be invented without requirements.

Fifth, I diagnose with evidence. I use dashboards for trends and historical views, then drill down into traces, prompts or request metadata, users or cohorts, and affected versions. I compare model versions, prompt versions, configurations, traffic cohorts, and time windows. This helps separate a model-quality regression from a retrieval failure, tool failure, application bug, provider problem, configuration issue, data shift, or infrastructure failure. A correlation is only a hypothesis until the trace, comparison, or controlled test supports it.

Sixth, I act safely. If user impact is serious, I may roll back a model, prompt, configuration, or feature flag; throttle traffic; disable a failing tool; use a safe fallback; or move traffic away from an unhealthy dependency. This is containment. It reduces harm while the root cause is being confirmed. It is not the same as the permanent correction.

Finally, I close the feedback loop. Human review can label useful privacy-safe samples. I can improve prompts or guardrails, update models or configurations, and add failing cases to evaluation sets. I evaluate changes offline first. When appropriate, I then use shadow traffic, a canary release, or an A/B test. I compare the new version with the previous baseline before expanding traffic. After release, I keep monitoring the same signals to confirm the change improved the system without creating a new quality, safety, latency, cost, or availability regression.

Release Lifecycle
  1. Instrument the complete production request path with request IDs, trace IDs, structured logs, metrics, and version metadata.
  2. Redact, hash, or omit sensitive fields before storing samples.
  3. Store numeric metrics, logs, traces, drift signals, and privacy-aware samples in suitable stores.
  4. Track quality, safety, performance, cost, availability, and input drift as separate monitoring dimensions.
  5. Establish normal baselines and product-specific alert thresholds.
  6. Detect sustained anomalies and route alerts by severity.
  7. Start diagnosis from the affected time window, request IDs, traces, versions, and cohorts.
  8. Compare the application, model, retrieval, tools, provider, configuration, data, and infrastructure boundaries.
  9. Contain serious impact with rollback, throttling, feature disablement, or a safe fallback when appropriate.
  10. Apply the smallest root-cause correction supported by evidence.
  11. Verify production recovery and check that other quality, safety, latency, cost, and availability signals did not regress.
  12. Feed reviewed examples into offline evaluation, then use shadow, canary, or A/B release methods when appropriate.
  13. Continue monitoring after rollout and repeat the feedback loop.
Time & Space Complexity

Monitoring adds some work to every request. Numeric metrics are usually the cheapest signals because they are small. Logs need more storage. Distributed traces need still more storage because they record many steps across components. Detailed request samples can be the most expensive and create the greatest privacy risk, so they should be limited and redacted. Sampling lowers storage and processing cost, but aggressive sampling can hide rare failures. More alerts and dashboards also create maintenance work. The practical goal is to collect enough evidence to diagnose real problems without slowing the application, creating too much noise, or storing unnecessary user data.

Where it is used

This approach is used for production chat assistants, retrieval-augmented generation systems, tool-using agents, customer-support assistants, document-processing applications, AI search systems, and other services that call LLMs. It is especially useful when teams frequently change prompts, model versions, retrieval logic, tools, configurations, guardrails, or traffic routing because monitoring connects a production regression to the affected request path and deployed version.

Why Interviewers Ask This

The interviewer wants to know whether you can operate an LLM application safely after it reaches real users. A strong answer separates answer quality, safety, speed, cost, availability, and changing inputs. It also shows that you collect evidence before guessing, trace failures across components, set useful alert thresholds, protect private data, respond safely to incidents, and verify changes before wider release.

Common interview mistakes

Common mistakes include monitoring only server uptime while ignoring answer quality and safety; logging raw private prompts when aggregate signals would be enough; tracking only averages instead of percentiles and cohorts; losing prompt, model, or configuration version information; stopping traces before retrieval or tool calls; alerting on every small spike instead of sustained impact; inventing universal thresholds instead of using product requirements; treating correlation as proof of a root cause; using rollback as if it were the permanent correction; changing several components at once before collecting evidence; and declaring success after deployment without checking production outcomes and regression evaluations.

Interview tip

Present the answer as one loop: observe, detect, diagnose, act, and improve. Name the six main signal groups: quality, safety, performance, cost, availability, and drift. Then explain how request IDs, traces, dashboards, version comparisons, privacy-aware samples, containment, evaluation, and safe releases turn an alert into a verified correction.

Interviewer may ask next
How would you investigate a sudden quality drop if latency and availability still look healthy?

I would start with the affected time window and compare request cohorts, prompt versions, model versions, configurations, retrieval results, tool behavior, and recent releases. I would use request IDs and traces to inspect representative privacy-safe examples, then run those cases through offline evaluation. I would not treat a time correlation as proof. I would confirm the suspected boundary with a controlled comparison. If user impact is high, I could roll back or reduce traffic while investigating. After the correction, I would verify quality, safety, latency, cost, and user outcomes before expanding traffic again.

How do you balance detailed production monitoring with privacy and cost?

I collect small aggregate metrics for every request because they are useful and relatively cheap. I keep request IDs, trace IDs, version metadata, and structured events so evidence can be correlated without storing unnecessary content. Detailed traces and content samples are sampled according to need. Sensitive fields are minimized, redacted, or hashed, with access controls, short retention, and audit logs. Lower sampling reduces cost and privacy exposure, but it can make rare failures harder to diagnose, so I choose the sampling level based on risk and the evidence needed.

86. How do you implement logging and tracing for LLM applications?Llmops And Production AiMedium

Question Details

Expected coverage includes correlation IDs, model and prompt versions, retrieval or tool spans, latency and token fields, redaction, retention, and searchable failure traces.

Short Interview Answer (30-60 seconds)

I assign one correlation ID per request, propagate it through logs and trace spans, and record model and prompt versions, retrieval and tool activity, latency, tokens, status, and errors. I redact sensitive data before storage, apply retention rules, and keep failure traces searchable end to end.

Detailed Explanation

A production AI request may pass through several steps before the user gets a response. When something goes wrong, engineers need a clear record of what happened and in what order. They should be able to see which version was used, which outside information or action was involved, how long each step took, and where the failure started. The system must also avoid storing private or secret information carelessly. Good logging and tracing make one request easy to follow from entry to response and make failures easier to find and explain.

Useful Questions to Ask the Interviewer
  1. Does the application use retrieval, external tools, or both?
  2. Does one request cross multiple services or background jobs?
  3. What personal, secret, or regulated data must never be stored in telemetry?
  4. What retention, audit, and access-control requirements apply?
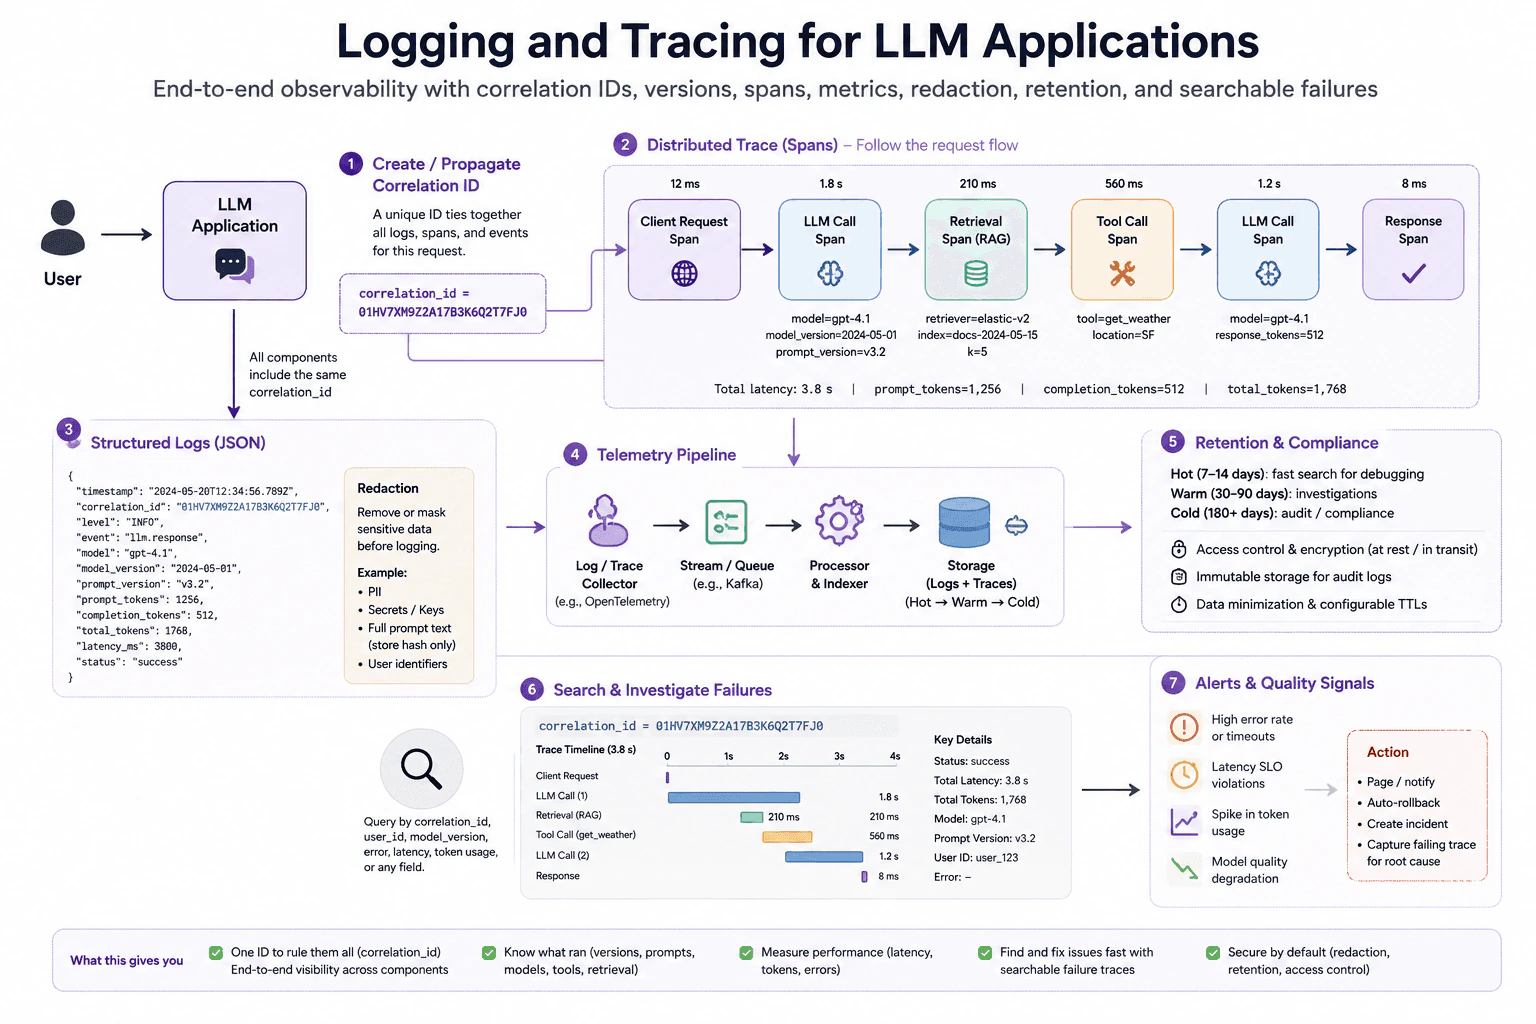
How do you implement logging and tracing for LLM applications? diagram
How to Explain It in an Interview

I would start at request entry. I create one correlation ID for the request and propagate it through the whole LLM application. The same ID appears in related logs, spans, and events. If the request crosses another service or asynchronous job, I pass the context there too. This gives one searchable key for the complete request.

I would also create a distributed trace. A trace represents the full request. A span represents one timed operation inside that trace. For example, the trace can contain a client-request span, an LLM-call span, a retrieval span, a tool-call span, another LLM-call span, and a response span. The parent-child relationship and timestamps show the real execution order and the time spent at each boundary.

For each important span, I record safe structured fields. These include the correlation ID, trace and span identifiers, operation name, timestamp, duration, status, and error details when a step fails. For an LLM call, I also record the model name or identifier, model version, prompt version, input-token count, output-token count, and total-token count. For retrieval, I record the retrieval component or index version and timing. For tools, I record the tool name, timing, status, and only safe argument or result metadata.

Version fields are important because they provide lineage. Lineage means I can tell which model, prompt, retrieval configuration, or tool behavior produced a particular result. If failures begin after a version change, I can search and compare affected traces instead of guessing.

I would use structured logs, such as JSON-style key-value events, rather than relying on free-form text. Structured fields make it easier to search by correlation ID, model version, prompt version, user or session identifier when allowed, error type, latency, token usage, or status. Logs and traces should describe the same request consistently.

Sensitive information must be removed or masked before telemetry is stored. I would redact personal information, secrets, API keys, authentication tokens, sensitive tool arguments, and sensitive prompt text. When the identity of a prompt is enough, I can store a prompt version or safe hash instead of the full text. Redaction happens before the storage boundary so unsafe raw values do not enter the telemetry store.

The telemetry pipeline can send logs and traces through a collector, then a stream or queue, then a processor and indexer, and finally into searchable storage. The important design point is that telemetry collection should not become part of the critical response path more than necessary. The application should continue serving requests even if observability storage is slow or temporarily unavailable, while the telemetry pipeline handles buffering and processing safely.

Retention should be intentional. Recent data can stay in fast searchable storage for debugging. Older data can move to warmer or colder storage or be deleted according to operational, legal, privacy, and audit needs. The diagram illustrates hot, warm, and cold retention tiers rather than one universal retention period. Access control, encryption at rest and in transit, data minimization, configurable retention limits, and protected audit records reduce the risk of telemetry becoming a security problem.

When a failure occurs, I search by correlation ID or trace ID and open the complete timeline. I check each model, retrieval, tool, and response span in order. I compare latency, token counts, status, error details, and version fields. This lets me narrow the fault boundary. For example, a slow retrieval span points investigation toward retrieval, while a failed tool span points toward the tool boundary. I do not assume the model is the cause until the trace evidence shows it.

Aggregated telemetry can also create alerts for high error rates, timeouts, latency-objective violations, unusual token usage, or model-quality degradation. An alert can page the team, create an incident, or trigger an approved rollback process. The request-level trace is still needed because an alert tells me that something is wrong, while the trace helps explain what happened.

The main tradeoff is observability versus privacy, cost, and operational overhead. More fields and longer retention make investigation easier, but they increase storage, indexing, security, and compliance costs. I would therefore collect the minimum useful context, redact sensitive content before storage, use controlled retention tiers, protect access, and keep correlation and trace IDs consistent across the complete request path.

Key Insight / Why This Solution Works
  1. Create a correlation ID when the request enters the LLM application.
  2. Propagate the correlation and trace context through every service, retrieval call, tool call, and asynchronous job.
  3. Create one trace for the request and child spans for the client request, LLM calls, retrieval, tools, and response where applicable.
  4. Add model, prompt, retrieval, and tool version information to the relevant records.
  5. Record duration, token counts, status, and error details at useful boundaries.
  6. Emit structured logs that carry the same correlation and tracing context.
  7. Redact personal information, secrets, sensitive prompts, and sensitive tool data before storage.
  8. Send logs and traces through the telemetry collector, processing, indexing, and searchable storage pipeline.
  9. Apply access control, encryption, data minimization, and retention rules.
  10. Investigate failures by correlation ID or trace ID, rebuild the timeline, isolate the failing span, and use aggregate error, latency, token, and quality signals for alerting.
Where it is used

This design is useful in production chat systems, retrieval-augmented generation applications, AI agents that call tools, multi-service LLM platforms, and other systems where one user request passes through several AI or application steps. It is especially useful for investigating model-call failures, retrieval failures, tool failures, slow requests, unexpected token usage, version regressions, and production incidents.

Why Interviewers Ask This

The interviewer wants to know whether you can make an LLM application observable in production. A strong answer shows that you can connect one request across the model, retrieval, tools, and application code; identify which versions ran; measure latency and token usage; protect sensitive information; retain telemetry safely; and reconstruct failures from searchable logs and traces.

Common interview mistakes

Common mistakes include using different request IDs in different components, failing to propagate trace context into retrieval or tool calls, and logging only the final LLM result instead of the full request path. Another mistake is using free-form logs without searchable fields. Teams also create security risk when they store full prompts, personal information, secrets, API keys, or sensitive tool arguments without redaction. Retaining all telemetry forever is another mistake. Finally, aggregate metrics do not replace request-level traces: an error-rate or latency alert shows that a problem exists, but the correlated trace provides the evidence needed to isolate the failing boundary.

Interview tip

Explain the request in order: create one correlation ID, propagate it, create spans, record versions and measurements, redact sensitive data, send telemetry to searchable storage with retention controls, and then reconstruct a failed request from its trace. Finish with the privacy, cost, and retention tradeoff.

Interviewer may ask next
How would you trace a request that uses both retrieval and an external tool?

I would keep one correlation ID and one trace for the whole request. Retrieval gets its own child span, and the tool call gets another child span. The retrieval span records safe version information, timing, status, and useful retrieval metadata. The tool span records the tool name, timing, status, and redacted argument or result metadata. Each LLM call also gets its own span with the model version, prompt version, token counts, latency, and status. The resulting timeline shows exactly where time was spent and which boundary failed.

How do you balance detailed observability with privacy and storage cost?

I collect the minimum structured fields needed to investigate behavior. I keep identifiers, versions, timings, token counts, status, and safe error context, but I redact personal information, secrets, authentication tokens, sensitive prompts, and sensitive tool data before storage. Recent telemetry can stay in fast searchable storage, while older data can move to cheaper retention tiers or be deleted according to operational, legal, privacy, and audit needs. Access controls and encryption protect the retained data. The tradeoff is simple: more telemetry helps debugging, but it also increases cost and privacy exposure.

87. How do you handle model updates and migrations without downtime?Llmops And Production AiMedium

Question Details

Lay out the implementation or decision path for compatibility checks, shadow traffic, dual running, canary rollout, state or index migration, acceptance metrics, and rollback without downtime.

Short Interview Answer (30-60 seconds)

Keep the current version serving while you validate the new one in stages. Check compatibility, shadow traffic, dual-run both versions, migrate state reversibly, and canary gradually. Promote only when acceptance metrics pass. Keep the old version warm so the router can roll back quickly if guardrails fail.

Detailed Explanation

The goal is to replace a running AI system without stopping service. I keep the current version available while I prepare and test the new version. I first check that the new version works with the same requests, stored data, and connected systems. Then I copy real traffic to it without using its answers. I compare both versions, move a small amount of real traffic, and increase that traffic only when the results stay healthy. If important measurements become worse, I send traffic back to the current version. I remove the old version only after the new one stays stable.

Useful Questions to Ask the Interviewer
  1. What is changing: the model, prompt, serving code, configuration, schema, feature store, vector index, or several of them together?
  2. Which acceptance metrics must pass before traffic can increase?
  3. Does any database state, feature data, cache, or vector index need migration during the release?
  4. How fast must rollback happen if quality, latency, safety, errors, cost, or business metrics become worse?
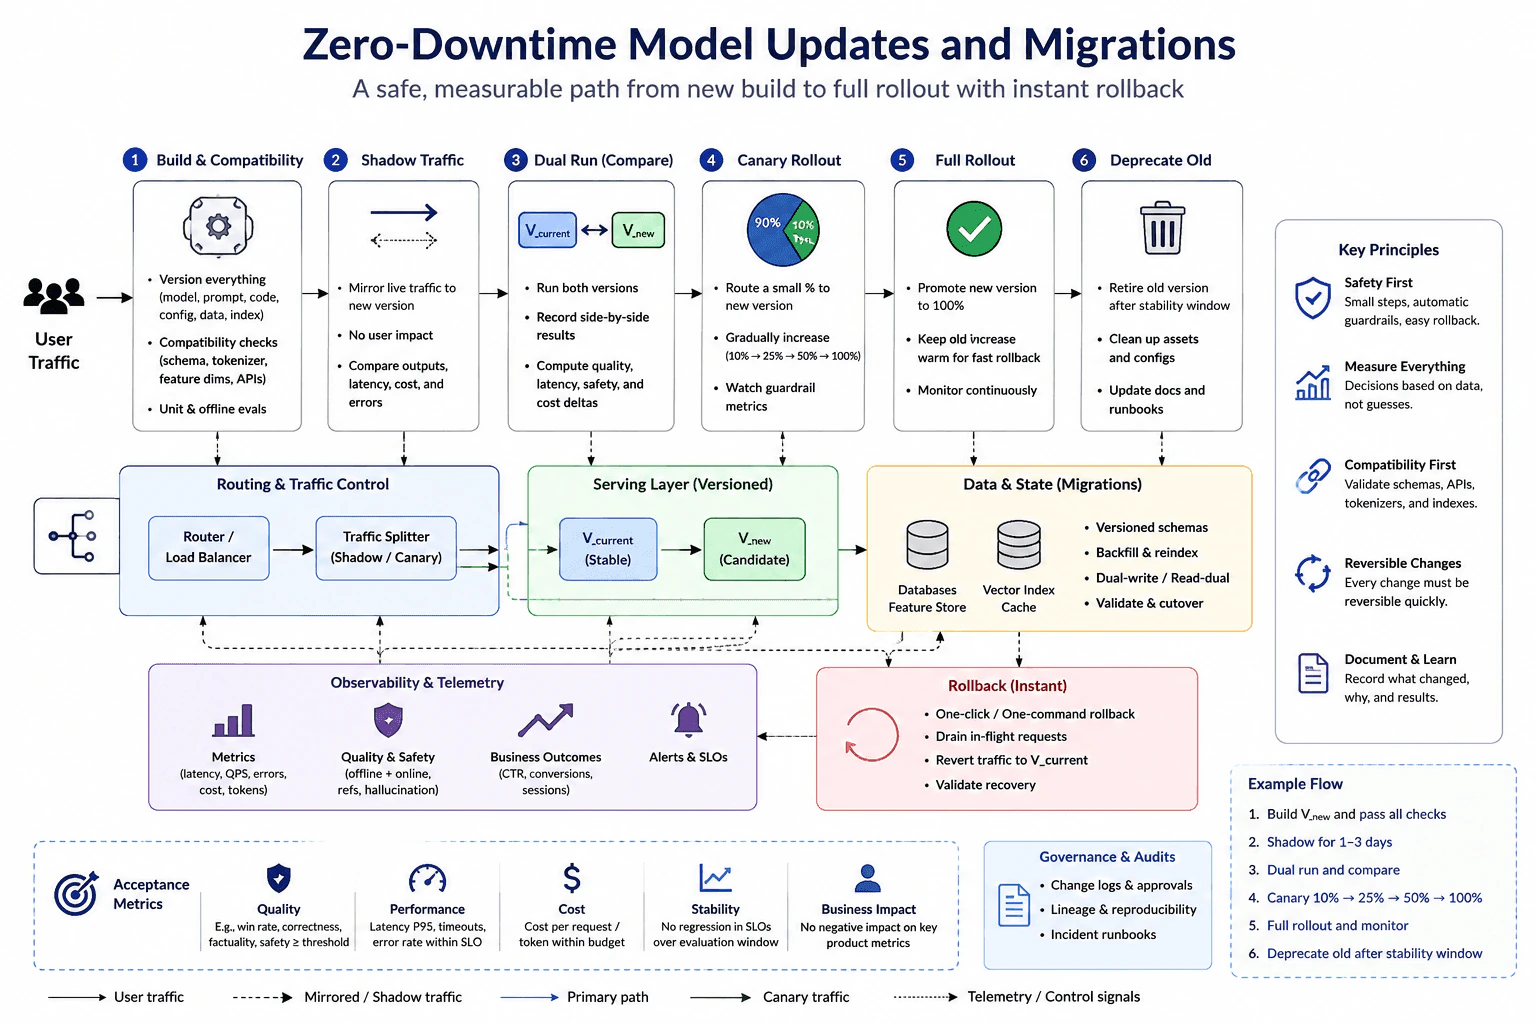
How do you handle model updates and migrations without downtime? diagram
How to Explain It in an Interview

I would use a staged and reversible rollout.

First, I build a versioned candidate release. I version the model, prompt, code, configuration, data, and indexes so I know exactly what is running. I run compatibility checks before changing production routing. These checks cover schemas, tokenizer or feature assumptions, model input and output contracts, APIs, dependencies, and any state the model needs. I also run unit tests and offline evaluations.

Next, I use shadow traffic. Shadow traffic means the traffic splitter copies real production requests to the candidate, but the candidate does not return the user response. The current version still serves users. I compare candidate outputs, latency, errors, quality, safety, and cost. This gives production-like evidence with no user-facing change.

Then I dual-run the current and candidate versions. Both versions process comparable work so I can record side-by-side results. I separate measurements into useful groups. Deployment health includes latency, throughput, errors, and alerts. Model quality includes correctness and safety. Product outcomes cover important user or business results. I also watch cost and stability. This prevents one good metric from hiding a problem somewhere else.

If a database, feature store, cache, schema, or vector index must change, I migrate it without breaking the current serving path. I use versioned schemas and reversible methods such as backfill and reindex or dual-write and read-dual. For example, I can build a new vector index in the background while the old index still serves traffic. I validate the new state before cutting reads over to it.

Before the canary starts, I define acceptance metrics. Typical gates include model quality, safety, latency, error rate, cost per request, stability, and important business impact. The exact thresholds depend on the system and must be agreed before rollout.

Next, I start a canary rollout. A canary sends only a small percentage of real user traffic to the candidate. If the acceptance gates pass, I increase traffic gradually. The exact percentages are an operational choice. The important rule is that each increase is controlled by measured results, not by guesswork.

During the rollout, the routing and traffic-control layer can send requests to either the stable current version or the candidate. The serving layer keeps both versions available. Observability collects metrics, quality and safety signals, business outcomes, alerts, and service-level objectives. Governance records change approvals, version lineage, reproducible build information, and incident runbooks.

Rollback remains available throughout the rollout. If a guardrail fails, I stop promotion and route traffic back to the current version. I safely drain or finish in-flight requests when needed and verify that service and product metrics recover. I do not remove the current version while rollback is still needed.

When the candidate reaches 100 percent traffic, I still keep the current version warm during a stability window. I continue monitoring the new release. Only after that window passes do I deprecate the old version. I remove old models, indexes, temporary migration paths, and obsolete configuration, then update documentation and runbooks.

The main tradeoff is temporary cost and operational complexity. Shadow traffic and dual running use extra inference capacity. Reindexing and dual state paths use additional storage and engineering work. I accept that temporary cost because every stage produces evidence and keeps the change reversible. The core rule is simple: make small changes, measure each step, and always keep a fast rollback path.

Release Lifecycle
  1. Build a reproducible candidate and version the model, prompt, code, configuration, data, schema, and dependent indexes.
  2. Run compatibility checks, unit tests, and offline evaluations before production routing changes.
  3. Keep the current version as the stable serving path.
  4. Mirror production requests to the candidate as shadow traffic. Do not return candidate responses to users yet.
  5. Dual-run current and candidate versions and compare quality, safety, latency, throughput, errors, cost, stability, and business outcomes.
  6. Migrate required database state, feature data, caches, schemas, or vector indexes with reversible methods such as versioned schemas, backfill and reindex, or dual-write and read-dual.
  7. Define acceptance metrics and rollback guardrails before the canary starts.
  8. Route a small percentage of real traffic to the candidate.
  9. Increase the canary gradually only while the acceptance gates continue to pass.
  10. Continuously monitor observability signals, alerts, service-level objectives, quality, safety, cost, stability, and product outcomes.
  11. If a guardrail fails, stop promotion, route traffic back to the current version, and validate recovery.
  12. After the candidate reaches 100 percent traffic, keep the current version warm through a stability window.
  13. When stability is proven, deprecate the old version, remove temporary migration assets, and update lineage, change records, documentation, and runbooks.
Practical Complexity & Trade-offs

This approach temporarily uses more resources because the current and candidate versions may run together. Shadow traffic and dual running add inference work. A second vector index, backfill, or dual state path adds storage, compute, and operational work. Monitoring and rollback also require routing rules and automation. The benefit is lower release risk. Problems can be found before every user is exposed, and the current version remains ready for recovery.

Where it is used

This approach is used when replacing a production model, changing a prompt or serving configuration, upgrading model dependencies, rebuilding a vector index, migrating feature-store data, changing a schema, or introducing a candidate that may change quality, safety, latency, cost, or business outcomes. It is especially useful for production AI services where stopping traffic for a migration is not acceptable.

Why Interviewers Ask This

Interviewers want to know whether you can change a production AI system without interrupting users. A strong answer shows safe versioning, compatibility checks, shadow traffic, dual running, reversible data or index migration, canary rollout, measurable acceptance gates, observability, rollback, and controlled deprecation. It also shows that you can distinguish deployment health, model quality, cost, stability, and business impact instead of treating one metric as proof that a release is safe.

Common interview mistakes

Common mistakes are switching 100 percent of traffic immediately, relying only on offline tests, defining success criteria after the rollout starts, and treating low error rate as proof that model quality is good. Another mistake is replacing an index or schema in place so rollback becomes difficult. Teams also fail when they remove the current version too early, do not keep version lineage, mix model-quality problems with serving failures, or collect telemetry without connecting it to a promotion or rollback decision.

Interview tip

Explain the design as a sequence of reversible gates: compatibility, shadow traffic, dual running, state or index migration, canary rollout, full rollout, stability monitoring, and deprecation. For each gate, say what evidence you collect and what makes you continue or roll back. Emphasize that the current version stays available until the candidate proves stable.

Interviewer may ask next
How would you migrate a vector index if the new model uses different embeddings?

I would build a new versioned index instead of overwriting the current one. I would backfill it with embeddings from the new model while the old index keeps serving traffic. I would validate document coverage, retrieval quality, latency, errors, and resource use. If useful, I would read from both indexes during comparison. After the new index passes its acceptance gates, I would gradually cut reads over to it. I would keep the old index available through the stability window so rollback means routing reads back to the previous index.

What should trigger rollback during a canary rollout?

I would define rollback guardrails before the canary starts. I would stop promotion if important measurements cross those limits, such as model-quality regression, safety failures, higher error rate, unacceptable latency, unexpected cost growth, stability problems, or harmful business impact. I would route traffic back to the current version, safely handle in-flight requests, and verify that service and product metrics recover. Then I would use the collected telemetry to isolate the cause before trying another rollout.

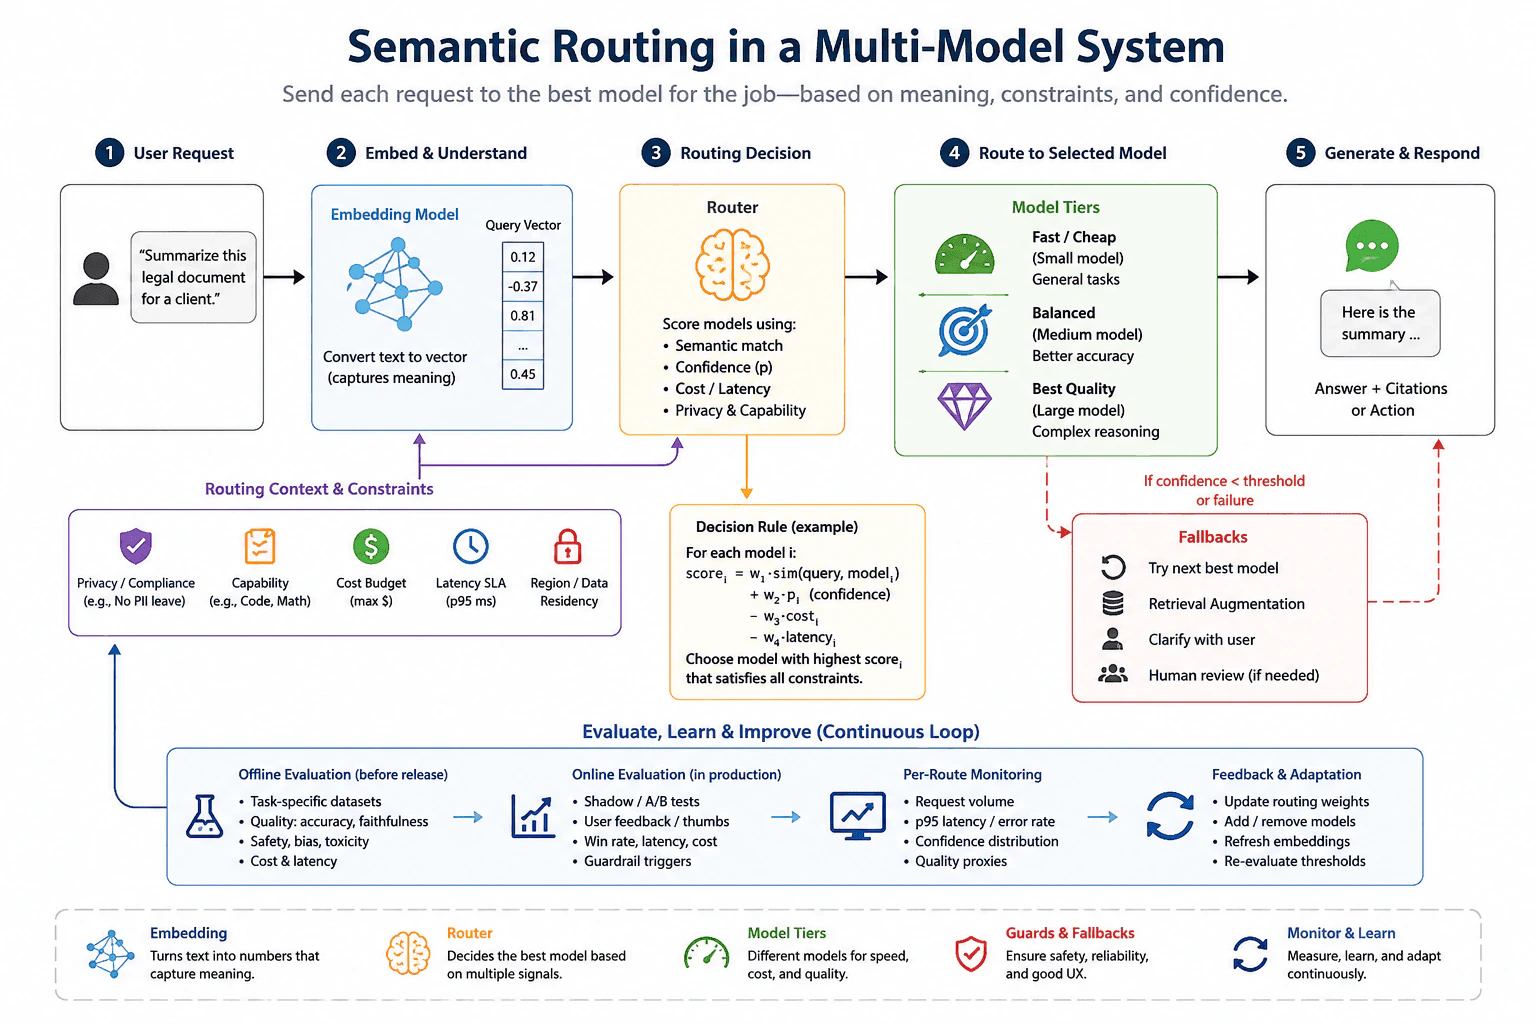
88. What is semantic routing, and how do you implement it in a multi-model system?Llmops And Production AiHard

Question Details

Ground the definition in routing features, model tiers, confidence thresholds, privacy or capability constraints, fallbacks, evaluation, and per-route monitoring.

Short Interview Answer (30-60 seconds)

Semantic routing chooses a model from the meaning of the request plus production constraints. I score eligible model tiers using semantic match, confidence, cost, and latency, enforce privacy and capability rules first, apply a confidence threshold, use explicit fallbacks, and evaluate and monitor each route separately.

Detailed Explanation

Semantic routing means looking at what a request is trying to do and sending it to the most suitable model. For example, a short summary may go to a fast, low-cost model, while a difficult reasoning task may need a stronger model. The choice should also respect rules about private information, available features, response speed, and budget. If the system is not confident about its choice, it should use a safe backup path. In production, we measure each route so we can find wrong choices, delays, higher costs, failures, or falling answer quality.

Useful Questions to Ask the Interviewer
  1. What request types and model tiers are available in the system?
  2. Which constraints are hard requirements, such as privacy, data residency, required capabilities, or regional restrictions?
  3. Which goals matter most for routing: answer quality, latency, cost, or a combination?
  4. What should happen when no model reaches the confidence threshold or the selected route fails?
  5. What offline evaluation data and per-route production metrics are available today?
What is semantic routing, and how do you implement it in a multi-model system? diagram
How to Explain It in an Interview

I would describe semantic routing as a decision layer in front of several models. It routes by the meaning of the request and its context instead of using only fixed keywords.

First, I collect routing features. A useful semantic feature is an embedding, which is a numeric representation of meaning. I can also use intent or task type, topic, estimated complexity, input length, user tier, privacy sensitivity, latency sensitivity, cost budget, required capability, and session history. These signals should be limited to information that actually helps the routing decision.

Second, I apply hard constraints before ranking models. A hard constraint is a rule that cannot be traded away for a better routing score. For example, a model must be allowed to receive the request's data, support the required capability, satisfy privacy or regional rules, fit the allowed budget, and meet any required latency limit. A high semantic score must never override privacy or capability requirements.

Third, I score only the models that remain eligible. A simple routing score can combine semantic match, route confidence, expected cost, and expected latency. The exact weights depend on the product goal. A latency-sensitive product can give more weight to speed. A difficult task can favor a higher-quality model tier when the extra cost and latency are acceptable.

I would normally expose the choices as model tiers. A fast and cheap tier handles simple or general work. A balanced tier gives a middle point between cost, speed, and quality. A best-quality tier handles more difficult reasoning when its higher cost or latency is justified. These are routing roles, not guarantees about any specific vendor model.

Next, I compare the best route with a confidence threshold. If the highest eligible route is confident enough, I select it. If confidence is below the threshold, or the chosen model fails, I follow an explicit fallback strategy. The fallback can try the next best eligible model, use retrieval-augmented generation when outside information is needed, ask the user to clarify an ambiguous request, send a sensitive case to human review, or return a controlled error when no safe route exists.

The selected model then generates the response or performs the requested action. If the application requires citations or retrieved evidence, the response should carry that grounding through to the final result instead of losing it after routing.

Before release, I evaluate the router offline with task-specific examples. I check whether requests are sent to suitable routes and whether the resulting answers meet the required quality, safety, latency, and cost goals. A new router, weight set, or threshold can then be compared with the current version using shadow traffic, a canary release, or an A/B test when appropriate.

In production, I monitor every route separately. Useful telemetry includes request volume, selected route, fallback rate, p95 latency, error rate, cost, confidence distribution, and suitable quality signals. I also watch for input-distribution drift, route-distribution changes, and quality degradation.

Finally, I use that evaluation and monitoring data to adjust routing weights, thresholds, model availability, embeddings, and policies. I version routing configuration, prompts, models, and evaluation data so I can reproduce a routing regression and roll back a bad change safely.

The main tradeoff is that semantic routing can lower cost and latency while keeping difficult requests on stronger models, but the router becomes another production component that can make mistakes. Hard constraints, calibrated thresholds, explicit fallbacks, offline evaluation, controlled online tests, versioning, and per-route monitoring keep that risk manageable.

Key Insight / Why This Solution Works
  1. Ingest and preprocess the request. Parse it and identify any privacy or policy-sensitive content.
  2. Extract semantic routing features such as an embedding, intent, topic, estimated complexity, input length, user tier, privacy sensitivity, latency sensitivity, cost budget, required capability, and session context.
  3. Apply hard constraints. Remove models that violate privacy, data-location, capability, cost, latency, or other required rules.
  4. Score each remaining model using justified signals such as semantic match, route confidence, expected cost, and expected latency.
  5. Compare the best eligible route with the configured confidence threshold.
  6. If the threshold is met, select that model tier. If confidence is too low or the route fails, follow the fallback strategy.
  7. Use an appropriate fallback such as the next best eligible model, retrieval-augmented generation when external context is needed, user clarification, human review, or a controlled error.
  8. Generate the response or action with the selected route.
  9. Evaluate routing offline before release and compare routing changes with shadow, canary, or A/B testing when appropriate.
  10. Monitor request volume, route choice, latency, errors, cost, confidence distribution, fallback use, and quality signals for each route.
  11. Feed monitoring results back into routing weights, thresholds, model availability, embeddings, and policies while keeping configurations versioned and reversible.
Where it is used

Semantic routing is useful when one application has several model choices with different speed, cost, quality, privacy, or capability profiles. Examples include sending simple summarization or classification work to a fast, low-cost tier, sending harder reasoning to a higher-quality tier, adding retrieval when a request needs outside knowledge, keeping sensitive requests on approved routes, and choosing routes differently for latency-sensitive or budget-sensitive users.

Why Interviewers Ask This

Interviewers want to see whether you can turn a multi-model system into a controlled production service instead of choosing models with simple keywords. They are testing how you combine request meaning with confidence, cost, latency, privacy, capability constraints, fallback behavior, evaluation, and per-route monitoring. They also want to know whether you can change routing rules safely and detect when one route starts producing worse results.

Common interview mistakes

A common mistake is routing with keywords alone and calling it semantic routing. Another is ranking models before applying privacy or capability constraints, which can let an invalid route win. Teams also use confidence scores without evaluating the threshold, provide no explicit fallback, assume the largest model is always best, or use retrieval as a fallback even when missing information is not the problem. Another mistake is monitoring only global averages instead of measuring request volume, latency, errors, cost, confidence, fallback use, and quality separately for each route.

Interview tip

Explain the flow in order: request features, hard constraints, model scoring, confidence threshold, selected tier, fallback, evaluation, and per-route monitoring. Make it clear that privacy and capability rules are hard gates, while semantic match, confidence, cost, and latency guide the ranking of eligible models.

Interviewer may ask next
How would you choose and tune the confidence threshold for semantic routing?

I would evaluate several thresholds on a representative labeled dataset instead of choosing one by intuition. For each threshold, I would compare route quality, fallback rate, latency, cost, and downstream answer quality. A higher threshold usually creates more fallbacks but reduces low-confidence routing. A lower threshold routes more requests directly but can increase wrong-route decisions. I would choose the threshold that meets the product's quality and safety requirements, test it with shadow or canary traffic, monitor confidence distributions and route outcomes, and version the threshold so it can be rolled back.

What should happen when the preferred model is unavailable or does not satisfy a privacy or capability constraint?

Privacy and capability constraints remain hard requirements during failure. I would exclude any model that violates those rules and try the next best eligible model. If no eligible model can safely complete the request, the system can use retrieval when missing external context is the problem, ask the user for clarification, request human review for a sensitive case, or return a controlled error. I would record the failed route, fallback path, latency, and outcome so the team can monitor reliability for that route.

89. How do you implement fallback strategies when the primary model is unavailable or rate-limited?Llmops And Production AiHard

Question Details

Require an implementation-level account of failure detection, timeout and retry policy, alternate model or deterministic path, quality disclosure, circuit breakers, and recovery.

Short Interview Answer (30-60 seconds)

I use a request orchestrator with bounded timeouts and limited retries with backoff and jitter. If the primary model still fails, I follow an ordered fallback chain. I add circuit breakers, disclose degraded quality, log the chosen path, and probe the primary model for safe recovery.

Detailed Explanation

A production AI service should keep serving users when its preferred model is temporarily busy or unavailable. The application needs a planned backup path instead of making unlimited attempts. It first gives the preferred service a short, controlled chance to succeed. If that fails, it tries approved alternatives in a known order. The user should receive the best safe answer currently available, with a clear notice when quality or capability is lower. The system should also stop sending traffic to a repeatedly failing service, record what happened, and automatically test when the preferred service is ready again.

Useful Questions to Ask the Interviewer
  1. Which failures should trigger fallback: timeout, rate limit, server error, network error, or a product-defined low-confidence result?
  2. What total latency budget must the request stay within?
  3. Which alternate models and deterministic paths are approved?
  4. How much quality degradation is acceptable before returning a static response or human handoff?
  5. Does fallback policy vary by request type, user tier, region, or provider?
How do you implement fallback strategies when the primary model is unavailable or rate-limited? diagram
How to Explain It in an Interview

Start with a request orchestrator. This is the component that owns routing, timeout, retry, fallback, disclosure, and recovery policy.

The request first passes normal guardrails and pre-checks. These can include authentication, authorization, input validation, content-safety checks, and known per-user or per-organization rate-limit checks. Then the orchestrator calls the preferred model with a per-attempt timeout and a total request deadline.

Classify the result before deciding what to do. A normal response continues on the success path. A timeout, network failure, temporary 5xx server failure, or rate limit can enter retry or fallback handling. A 429 rate-limit response should respect provider retry guidance such as Retry-After when it is available and when waiting still fits the request deadline. If the product has a meaningful and validated confidence threshold, a result below that threshold can also enter a fallback path. Do not invent a confidence score when the application has no reliable confidence signal.

Retries must be bounded. Use a small maximum attempt count, such as two or three attempts when the latency budget permits. Exponential backoff increases the delay between attempts. Jitter adds a small random amount so many workers do not retry at the same moment. Retry only failures that are safe and likely to be temporary. Do not keep retrying validation, authorization, safety, or other clearly permanent failures. Stop when the total request deadline is close.

If the primary path still cannot serve the request, enter an ordered fallback engine. The first fallback can be another approved model, possibly from another provider or a smaller model. The next step can degrade gracefully by simplifying the prompt, reducing the maximum output size, or disabling non-essential tools. If generation is still unavailable, use a deterministic path such as rules, templates, retrieval plus extractive answering, or a cached answer. The final path can be a static response, FAQ result, or human handoff. Stop at the first option that produces a valid and safe response.

Use a circuit breaker for each model or provider. A circuit breaker temporarily stops traffic to a dependency after repeated failures. This prevents the application from wasting time and capacity on a service that is already unhealthy. After a cooldown period, move to a half-open state and send a small probe. If the probe succeeds, close the circuit and resume normal traffic. If it fails, reopen the circuit and continue using fallback paths.

Quality disclosure is part of the design. When a fallback path changes capability or expected quality, tell the user. The product can expose simple states such as primary, alternate, degraded, or rules-and-cache. A response can also include operational metadata such as which model or path was used, latency, and whether fallback occurred. Include a confidence value only when the application has a defined and meaningful confidence measure.

Observability should run on every path. Record the request or correlation ID, failure reason, selected path, model used, latency, token usage when available, fallback status, and circuit-breaker state. Track success rate, fallback rate by reason, latency, cost signals, and open-circuit counts. Alert on sustained provider failures, high fallback rates, open circuits, or latency objective breaches. Keep deployment health separate from model quality so an infrastructure incident is not mistaken for a quality regression.

Recovery should be automatic but controlled. While the circuit is open, normal requests use fallback paths. After the cooldown, send a probe to the preferred model. When probes succeed, close the circuit and restore normal routing. In higher-risk systems, traffic can return gradually while monitoring error rate and latency instead of switching all requests back at once.

The main tradeoff is availability versus quality, latency, and cost. A stronger alternate model may preserve quality but cost more. A smaller model may be faster and cheaper but less capable. Too many retries increase latency and can make an outage worse. Deterministic fallbacks are predictable but less flexible. The goal is to return the best safe answer available, disclose degraded behavior, protect unhealthy dependencies, and recover quickly.

Key Insight / Why This Solution Works
  1. Accept the request and apply authentication, authorization, validation, safety, and routing checks.
  2. Set a total request deadline and a shorter timeout for each model attempt.
  3. Call the preferred model.
  4. Classify the result as success, timeout, rate limit, temporary server failure, network failure, or another known condition.
  5. For a retryable temporary failure, retry only while the request deadline allows it. Use exponential backoff, jitter, and a small maximum attempt count.
  6. For a 429 response, honor Retry-After when available and practical; otherwise move to fallback.
  7. If the primary path still fails, enter the ordered fallback engine.
  8. Try an approved alternate model first.
  9. If needed, degrade gracefully by simplifying the prompt, reducing output size, or disabling non-essential tools.
  10. If model generation is unavailable, use a deterministic path such as rules, templates, retrieval plus extractive answering, or cached results.
  11. Use a static response, FAQ result, or human handoff as the last resort.
  12. Open the per-model or per-provider circuit breaker after repeated failures according to the configured policy.
  13. Tell the user when fallback changes quality or capability.
  14. Record the failure reason, chosen path, model, request ID, latency, fallback status, and circuit state.
  15. After the cooldown, send a half-open probe to the primary service.
  16. Close the circuit and resume normal traffic after successful recovery; otherwise reopen it and continue fallback routing.
Where it is used

This pattern is used in production chat assistants, AI search, document-processing services, summarization APIs, support automation, retrieval-based assistants, and other applications that depend on model-serving infrastructure. It is most useful when the primary model or provider can experience timeouts, rate limits, temporary server failures, network problems, or capacity shortages while the product still needs a safe degraded mode.

Why Interviewers Ask This

The interviewer wants to know whether you can keep an AI product available without causing retry storms or hiding degraded behavior. A strong answer shows how you detect failures, control timeouts and retries, choose safe alternatives, protect unhealthy providers, disclose quality changes, observe fallback behavior, and recover the primary path safely.

Common interview mistakes

Common mistakes are retrying every error, using too many retries, ignoring the total request deadline, and retrying without jitter. Another mistake is having several fallback models without a clear order or safety checks. Teams also fail when they keep sending traffic to an unhealthy provider because no circuit breaker exists. Treating every 429 as an immediate blind retry can make rate limiting worse; respect retry guidance and the latency budget. Do not hide fallback use when capability changes. Do not invent confidence values. Finally, logging only the provider error is not enough; also record the request ID, selected path, fallback reason, latency, model, circuit state, and recovery result.

Interview tip

Explain the flow in order: detect and classify the failure, retry only when safe, choose the next approved fallback, disclose reduced quality, protect the unhealthy provider with a circuit breaker, observe every path, and probe for recovery. Mention the tradeoff between availability, latency, quality, and cost.

Interviewer may ask next
How do you decide whether to retry an error or immediately use a fallback?

Retry only failures that are temporary, safe to repeat, and still fit the total request deadline. Examples can include some network failures, timeouts, temporary 5xx errors, and a 429 when provider retry guidance allows a short wait. Use a small retry count with exponential backoff and jitter. Do not retry validation, authorization, safety, or other clearly permanent errors. When the retry budget is exhausted, move to the ordered fallback path.

How do you safely return traffic to the primary model after it recovers?

Use the circuit breaker's cooldown and half-open state. While the circuit is open, normal requests use fallback paths. After the cooldown, send a small probe to the primary model. If the probe succeeds, close the circuit and resume traffic. For a higher-risk system, restore traffic gradually while watching failure rate and latency. If the probe fails, reopen the circuit and continue using fallback paths.

90. What is AI evaluation?Evaluation And TestingEasy

Question Details

Define AI evaluation and explain how a team uses representative test examples, task-specific metrics, human review, automated graders, failure slices, and release thresholds to decide whether an AI system is good and safe enough to ship.

Short Interview Answer (30-60 seconds)

I would ship an AI system only after it passes clear quality and safety release gates on a representative test set. AI evaluation is the process of running realistic examples through the system, scoring the outputs with task specific metrics, reviewing some outputs with people, using validated automated graders, and checking failure slices such as topic, user group, or input length. The tradeoff is that broader evaluation costs more time and review effort, but narrow evaluation can miss important failures.

Detailed Explanation

AI evaluation is how a team checks whether an AI system is good and safe enough to release. The team starts with test examples that reflect real users, common tasks, edge cases, and risky topics. It runs those examples through the system and checks the answers in several ways. Some checks use scores. Some use people. Others use automated graders. The team also groups failures to see where problems appear. It then compares the evidence with clear release rules and ships only when the required quality and safety bars are met.

Useful Questions to Ask the Interviewer
  1. What user tasks and safety risks matter most for this system?
  2. Which quality and safety conditions must pass before release?
  3. Which outputs need human judgment because automatic checks are not enough?
What is AI evaluation? diagram
How to Explain It in an Interview

Start with the release decision. The goal is not to get one impressive score. The goal is to collect enough evidence to decide whether the system is good and safe enough for its intended users.

First, build a representative test set. Use examples that reflect real tasks, different users, topics, regions, typical cases, edge cases, and sensitive or risky topics. Keep the evaluation set frozen for a release comparison so that a new system version is measured against the same examples. This creates a stable boundary for regression checks.

Second, run every test example through the AI system and save the model output. The system under evaluation is the full behavior that produces the answer. The evaluation process should avoid changing the test examples or scoring rules during the same release decision.

Third, measure the outputs with task specific metrics. The metric must match the task. Accuracy can work when there is a clear correct answer. F1 score can help when precision and recall both matter. ROUGE can be useful for some text overlap checks. Win rate can compare two systems when a reliable comparison process exists. No single metric should stand in for overall quality or safety.

Fourth, add human review where judgment matters. Reviewers can check correctness, helpfulness, nuance, and safety. Human review catches problems that simple numeric metrics may miss. Use a clear rubric so reviewers judge the same criteria. Human review is valuable but slower and more expensive than automatic scoring.

Fifth, use automated graders for checks that can be repeated at scale. A grader may be a deterministic rule, a unit style check, or a model that applies a rubric. Deterministic checks should stay separate from probabilistic model judgments. A model grader must be validated against trusted human judgments before the team relies on it for release decisions.

Sixth, inspect failure slices. A slice is a group of test cases with something in common, such as topic, user group, or input length. Overall averages can hide a serious weakness in one slice. Slice analysis helps the team find where the system fails and investigate the root cause.

Seventh, compare the results with agreed release thresholds. The diagram shows example gates such as accuracy of at least 95 percent, zero safety incidents, human agreement of at least 90 percent, and no critical failures. These are examples, not universal standards. A real team sets thresholds from the product risk, task needs, and user impact. If every required gate passes, the team can ship. If any required gate fails, the team should not ship.

When a gate fails, investigate the cause, improve the data, prompt, model, rules, or guardrails, then run the evaluation again on the same frozen set. Track results over time so regressions are visible. This loop matters because evaluation is not a one time score. It is a repeatable release process.

The main limitation is that an evaluation can only test what the team included and measured. A representative test set reduces risk but cannot prove that every possible real world case is safe. That is why teams combine metrics, people, automated checks, slice analysis, and clear release gates instead of trusting one signal.

Technical Approach
  1. Define the release decision. State what quality and safety conditions must be true before shipping.
  2. Build a representative frozen test set. Include real tasks, different users, topics, regions, typical cases, edge cases, and risky topics.
  3. Run each example through the AI system and store the output.
  4. Score the output with task specific metrics that match the behavior being tested.
  5. Add human review for correctness, helpfulness, nuance, and safety where judgment is needed.
  6. Add automated graders for repeatable checks. Keep deterministic rules separate from probabilistic model graders, and validate model graders against trusted human judgments.
  7. Break results into failure slices such as topic, user group, or input length. Look for weak groups that an overall average can hide.
  8. Compare all required results with release thresholds. Ship only when every required quality and safety gate passes.
  9. If a gate fails, find the root cause, improve the data, prompt, model, rules, or guardrails, rerun the evaluation on the same frozen set, and track results over time.
Practical Insights

Traditional algorithmic complexity is not the main concern here. Practical cost grows with the number of test examples, the cost of running the AI system, the number of metrics and graders, and the amount of human review. Human review is usually the slowest and most expensive part. Model based graders can reduce review effort but add their own inference cost and validation work. Larger slice analysis also needs enough examples in each group to make the result useful. In CI, the team can keep a stable regression set for every release and run larger evaluations when the risk justifies the extra time and cost.

Why Interviewers Ask This

Interviewers ask this to see whether a candidate can turn a vague idea of model quality into a clear release decision. They want to know whether the candidate can choose representative test data, combine several kinds of evidence, separate deterministic checks from probabilistic judgments, find weak slices, and set release gates that protect users without pretending one score proves the whole system is safe.

Common interview mistakes

Common mistakes are using a test set that does not reflect real users, choosing metrics that do not match the task, trusting one average score, skipping human review for subjective or safety sensitive outputs, and treating a model grader as correct without validating it. Another mistake is mixing deterministic checks with probabilistic judgments as if they mean the same thing. Teams can also miss serious problems by ignoring failure slices. Changing the test set during a release comparison makes regression results hard to trust. Finally, passing a benchmark does not prove that every real world case is safe.

Interview tip

Explain the flow as a release decision: representative examples, system outputs, task specific metrics, human review, validated automated graders, failure slices, then release thresholds. Make it clear that no single score proves quality or safety. End with the failure loop: if a required gate fails, do not ship, find the cause, improve the system, and evaluate again.

Interviewer may ask next
What would you do if the overall score passes but one failure slice performs badly?

I would treat that slice as part of the release boundary and not hide it behind the overall average. For example, if one user group, topic, or input length has a serious quality or safety failure, I would inspect those cases, find the root cause, and decide whether that slice has a must pass threshold. This matters because a strong average can hide concentrated harm. The tradeoff is that more slice gates make evaluation stricter and require enough examples in each slice, but they give a safer and more honest release decision.

How would you keep this evaluation practical as the test set grows?

I would keep the same evaluation strategy but split execution by cost and risk. The core release boundary would use a stable regression set with important quality and safety gates in CI, while larger human review and expensive grader runs could happen on a slower release path. This matters because every example and grader adds runtime or review cost. The tradeoff is speed versus coverage. The team should keep the highest risk cases in the fast gate and move lower priority breadth to larger scheduled evaluations without changing the final release standards.

More questions load as you scroll

Disclaimer: This interview guide is for educational and informational purposes only. It is designed to help readers prepare, but it does not guarantee any interview result, hiring decision, offer, or outcome. Interview questions, hiring criteria, and preferred answers can vary by employer, interviewer, industry, location, and time. The examples and explanations reflect the authors' research and judgment, are provided without warranties of any kind, and should not be treated as the only correct approach. Diagrams are simplified illustrations intended to highlight the main components and their interactions; actual systems and implementations may be more complex. Alternative approaches may be equally valid or better suited to a particular question, context, or interviewer. To the fullest extent permitted by applicable law, the author, contributors, and publisher are not liable for decisions made, actions taken, or losses incurred based on this guide.